Connected Consumer Survey 2018: TV and video services in Australia and New Zealand
←
→
Page content transcription
If your browser does not render page correctly, please read the page content below

Connected Consumer Survey 2018: TV and video services in Australia and New Zealand

                Connected Consumer Survey
                2018: TV and video services
                in Australia and New Zealand

                Martin Scott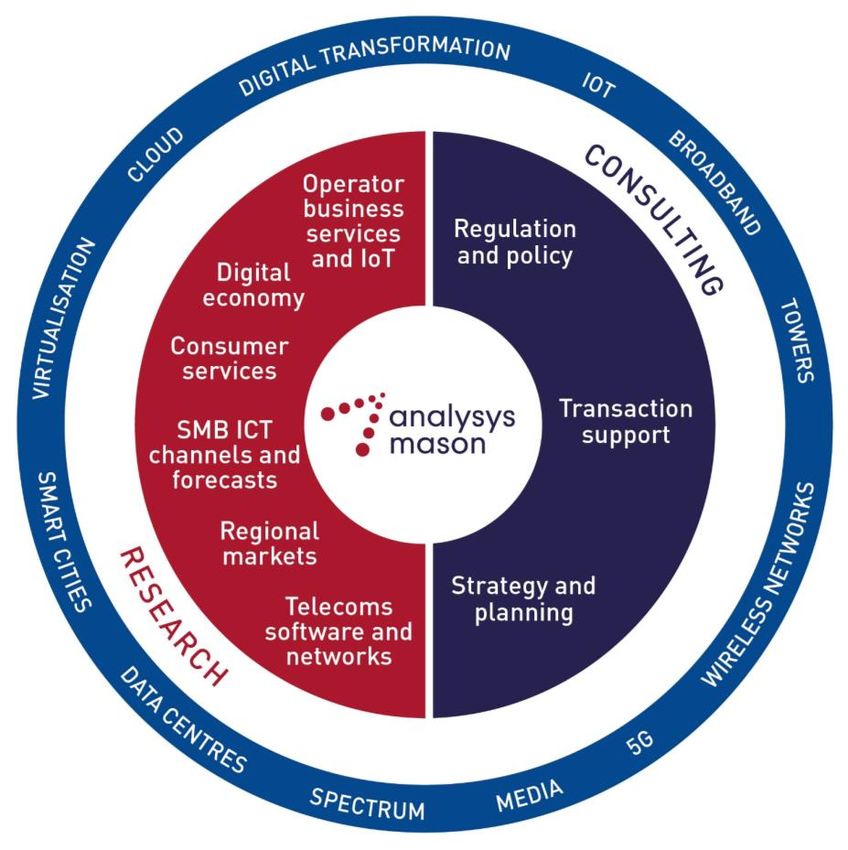
Connected Consumer Survey 2018: TV and video services in Australia and New Zealand                                                                               2

About this report

This report focuses on aspects of Analysys Mason’s Connected                                              GEOGRAPHICAL COVERAGE
Consumer Survey that relate to the behaviour, preferences and
plans that consumers have related to their use of pay-TV and OTT
video services. This is a rapidly changing part of the landscape
and the interaction between pay TV and OTT is complex.
The survey was conducted in association with Survey Sampling
International (SSI) between July and September 2018. The survey
groups were chosen to be representative of the Internet-using
population in Australia and New Zealand. We set quotas on age,                                                                         Australia
gender and geographical spread to that effect. There were a
minimum of 1000 respondents per country.                                                                                                      New Zealand

             KEY QUESTIONS ANSWERED IN THIS REPORT                                                    WHO SHOULD READ THIS REPORT

 ▪ Why is pay-TV churn increasing, how is this related to changing video             ▪ Product managers and strategy teams working for pay-TV providers or
   consumption patterns, and what can pay-TV providers do to mitigate or               operators with pay-TV operations or companies that use video services
   adapt to this change?                                                               as a value-added service (VAS) to support their core services.
 ▪ How is ‘service stacking’ (subscribing to multiple services) evolving and         ▪ Marketing executives and product managers for pay-TV providers and
   how is this likely to change in future?                                             operators that are making decisions about TV and video service design
 ▪ How should pay-TV providers evolve their services in order to remain                and its impact on customer retention.
   relevant in a world of changing viewing habits?                                   ▪ Strategy teams for pay-TV providers and operators that are assessing
 ▪ How are consumers’ viewing habits changing in light of increased use of             the impact of changing viewing habits on their business – in particular
   OTT video?                                                                          the relationship between pay-TV and OTT video services.

 ▪ Is cord cutting an increasing threat to pay-TV services in all countries?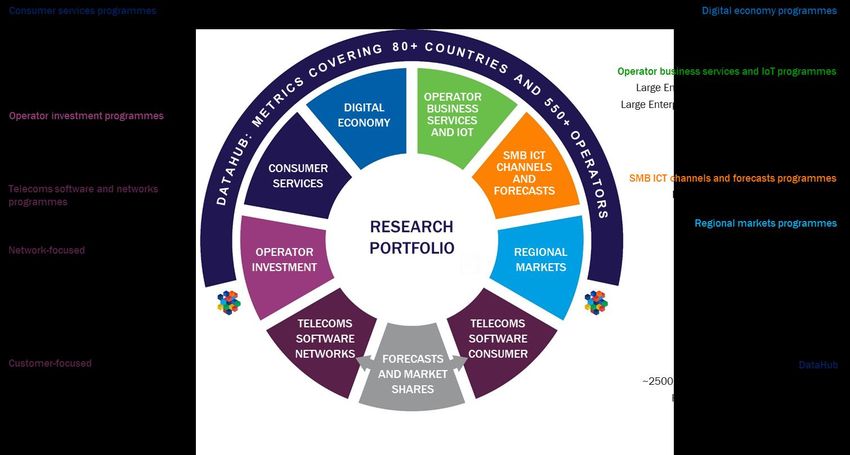
Connected Consumer Survey 2018: TV and video services in Australia and New Zealand                                                                                                           11

Netflix is universally dominant in Australasia, Europe and the USA, but local services
also perform well
Figure 6: Penetration of paid-for OTT video services overall and also for selected players in each country 1
                                70%

                                60%

                                                                                                                                                              64%
Percentage of all respondents

                                50%

                                                                                                                                                                    53%
                                                                                 47%

                                                                                                                              47%
                                40%
                                      43%

                                                                                           40%

                                                                                                                                      38%
                                            37%

                                                                                                                                                                                    Hulu
                                30%

                                                                                                        Lightbox

                                                                                                                                                     Now TV
                                20%
                                                           Stan

                                10%

                                0%
                                             Australia                                 New Zealand                                          UK                        USA

                                                                        % paid OTT          % Netflix        % Amazon Video         % Next largest
                                                                                                                                                                          Source: Analysys Mason

Netflix had by far the highest penetration of any paid-for TV video service among respondents in all four countries of Australia, New Zealand,
the UK and the USA (see Figure 6). Amazon Video has not been established in Australia and New Zealand for long, and the amount of
content that they make available is limited compared to that which is available in the UK and the USA. Local players in both Australia and
New Zealand have performed reasonably, compared to their British and American peers.
Netflix’s role could be interpreted by some as ‘king maker’, given its high penetration – whichever provider can successfully negotiate to
integrate Netflix’s content library with their own is likely to benefit. In February 2019, Foxtel announced the integration of Netflix into its
forthcoming iQ4 set-top box, but the degree of service integration was not yet apparent. No such partnership exists in New Zealand.
1               See slide 26 for sample size and slide 27 for relevant survey questions.
Connected Consumer Survey 2018: TV and video services in Australia and New Zealand                                                                                       15

Australian consumers currently watch Foxtel for sport, Netflix or Stan for drama –
there are opportunities for further specialisation in documentaries and e-sports
Figure 9: Percentage of respondents that selected a content                                           Which content a company chooses to use to differentiate its
genre as one of their three most viewed and the percentage                                            service when consumers take multiple services side-by-side is
point variation from the average for users of selected OTT and                                        important. We can identify a clear affinity between particular OTT
pay TV services, Australia 1                                                                          video services and content genres. Figure 9 shows the elevation
                                                                                                      of interest in genres among customers of different services.
    Content type         % of
                                                                    Foxtel
                         panel who YouTube Netflix        Stan                 Foxtel   Non-Foxtel      ▪ 43% of Australian respondents selected drama as one of
                                                                     Now
                         chose
                                                                                                          their top three most important genres. This is where Netflix
    Drama                   43%       -4%       5%        11%        -1%        1%          0%            (and Stan) excel and will be a key motivation for Foxtel’s
    News                    40%       1%        -9%        -8%      -12%        3%          -1%           partnership with Netflix, as announced in February 2019.
    Documentaries           32%       2%        -1%        2%        -3%        -1%         0%          ▪ YouTube users are much more likely to value music videos,
    Sports                  32%       0%        -2%        -8%       20%       15%          -4%           more so than user-generated content. The launch of
                                                                                                          YouTube Music, in mid-2018, suggests valid synergies.
    Feature films           26%       1%        7%        10%        -2%        -5%         1%
    Music videos            22%       7%        1%         -1%       1%         -6%         1%          ▪ Foxtel’s appeal is heavily tied to sports – 47% of Foxtel
                                                                                                          customers consider sports a priority compared to 28% of
    Sitcoms                 19%       1%        4%        13%        1%         3%          -1%
                                                                                                          non-customers. We note Optus’ attempt to break this
    User-generated                                                                                        dominance, as well as its plans to partner with YouTube and
                            12%       5%        2%         1%        4%         -1%         0%
    content
                                                                                                          Twitter for free broadcasts (they used SBS in 2018).
    Children shows          11%       1%        3%         0%        1%         -1%         0%
    Soaps                   11%       -2%       0%         -5%       1%         3%          -1%
                                                                                                        ▪ A notable opportunity for engagement may exist among
                                                                                                          consumers who value documentaries – 32% of respondents
    Panel/interview/
    chat/table talk
                            6%        -1%       -2%        1%        0%         -3%         1%            identified it as key. Fetch TV appears to be addressing this.
    e-sports                3%        0%        1%         -1%       6%         0%          0%          ▪ e-sports may also present a deeper opportunity for Foxtel
                                   Strongest positive/negative variation     Source: Analysys Mason       Now. Foxtel Now users were three times more likely to be
     Key:      x%        –y%                                                                              interested in e-sports. Foxtel has made forays in this area,
                                   away from the average for each service
                                                                                                          broadcasting the FIFA18 E-league on Fox Sports in 2018.
1   See slide 26 for sample size and slide 27 for relevant survey questions.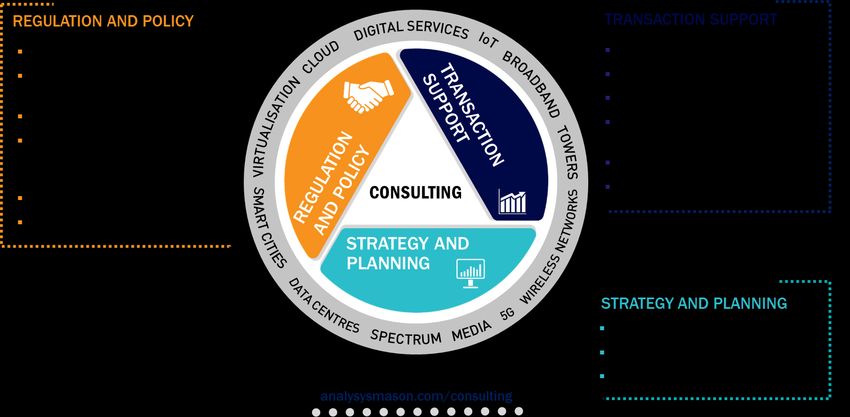
Connected Consumer Survey 2018: TV and video services in Australia and New Zealand

               Contents                            Executive summary

                                                   The IP revolution will fundamentally change TV in Australia and
                                                   New Zealand

                                                   OTT can be an effective route to revenue growth for operators

                                                   In this new world, players can make better TV services

                                                   Methodology and panel information

                                                   About the author and Analysys Mason
Connected Consumer Survey 2018: TV and video services in Australia and New Zealand                                                                                  29

About the author

                       Martin Scott (Principal Analyst) co-ordinates Analysys Mason’s research initiatives related to media and TV. He manages the Video Strategies
                       research programme. Martin has held numerous positions within Analysys Mason during the last 10 years, including heading the company's
                       Consumer Services, Data and Regional Markets practices. He also launched Analysys Mason’s Connected Consumer Survey and Consumer
                       smartphone usage series of research. His primary areas of specialisation include telco TV strategy, OTT video and media, consumer smartphone
                       usage, the bundling and pricing of multi-play services, including quadruple-play bundling, customer satisfaction and consumer-facing marketing
                       strategy. He also specialises in statistics, surveys and the analysis of primary research.
Connected Consumer Survey 2018: TV and video services in Australia and New Zealand 30
Analysys Mason’s consulting and research are uniquely positioned
Analysys Mason’s consulting services and research portfolio CONSULTING
We deliver tangible benefits to clients across the telecoms
industry:
▪ communications and digital service providers, vendors,
financial and strategic investors, private equity and
infrastructure funds, governments, regulators, broadcasters,
and service and content providers.
Our sector specialists understand the distinct local challenges
facing clients, in addition to the wider effects of global forces.
We are future-focused and help clients understand the challenges
and opportunities that new technology brings.
RESEARCH
Our dedicated team of analysts track and forecast the different
services accessed by consumers and enterprises.
We offer detailed insight into the software, infrastructure and
technology delivering those services.
Clients benefit from regular and timely intelligence, and direct
access to analysts.Connected Consumer Survey 2018: TV and video services in Australia and New Zealand 31 Research from Analysys Mason
Connected Consumer Survey 2018: TV and video services in Australia and New Zealand   32

Consulting from Analysys Mason
Connected Consumer Survey 2018: TV and video services in Australia and New Zealand

                 PUBLISHED BY ANALYSYS MASON LIMITED IN MARCH 2019
                 Bush House • North West Wing • Aldwych • London • WC2B 4PJ • UK
                 Tel: +44 (0)20 7395 9000 • Email: research@analysysmason.com • www.analysysmason.com/research • Registered in England and Wales No. 5177472
                 © Analysys Mason Limited 2019. All rights reserved. No part of this publication may be reproduced, stored in a retrieval system or transmitted in any form or by any means – electronic,
                 mechanical, photocopying, recording or otherwise – without the prior written permission of the publisher.
                 Figures and projections contained in this report are based on publicly available information only and are produced by the Research Division of Analysys Mason Limited independently of any
                 client-specific work within Analysys Mason Limited. The opinions expressed are those of the stated authors only.
                 Analysys Mason Limited recognises that many terms appearing in this report are proprietary; all such trademarks are acknowledged and every effort has been made to indicate them by the
                 normal UK publishing practice of capitalisation. However, the presence of a term, in whatever form, does not affect its legal status as a trademark.
                 Analysys Mason Limited maintains that all reasonable care and skill have been used in the compilation of this publication. However, Analysys Mason Limited shall not be under any liability for
                 loss or damage (including consequential loss) whatsoever or howsoever arising as a result of the use of this publication by the customer, his servants, agents or any third party.
You can also read