LOOKING PAST THE PITCH - JULIAN MORRISON HEAD OF RESEARCH RELATIONSHIPS & NATIONAL KEY ACCOUNTS MARCH 2021 - FSITV

Page created by Jordan Fuller
 
CONTINUE READING
LOOKING PAST THE PITCH - JULIAN MORRISON HEAD OF RESEARCH RELATIONSHIPS & NATIONAL KEY ACCOUNTS MARCH 2021 - FSITV
LOOKING PAST THE PITCH

                       Julian Morrison
        Head of Research Relationships
              & National Key Accounts

                          March 2021
LOOKING PAST THE PITCH - JULIAN MORRISON HEAD OF RESEARCH RELATIONSHIPS & NATIONAL KEY ACCOUNTS MARCH 2021 - FSITV
AGENDA

       Why manager           Look past the ‘pitch’ for a   Current perspectives
    selection is difficult    sustainable advantage

2
LOOKING PAST THE PITCH - JULIAN MORRISON HEAD OF RESEARCH RELATIONSHIPS & NATIONAL KEY ACCOUNTS MARCH 2021 - FSITV
THE LOW COST OPTION

  URGENT SALE, 6 CD STACKER, SUBWOOFER LEAD
  SYSTEM, MAGS

   Tyres replaced 5 months ago, motor still
  runs and is driveable but needs work needs
  work or good for parts or new project, need
  gone asap, pickup Pakenham, no reg or rwc,
  last reg 2/2/17.

  $500 o.n.o will not go under $400

Source: Verbatim from Gum tree add

    3
LOOKING PAST THE PITCH - JULIAN MORRISON HEAD OF RESEARCH RELATIONSHIPS & NATIONAL KEY ACCOUNTS MARCH 2021 - FSITV
THE CAR BUYER’S DILEMMA

          250,000

          200,000

          150,000
Price $

          100,000

           50,000

               -
                    Hyundai Excel (1993)   Toyota Corolla (2020)   Porsche 911 (2020)

 4
LOOKING PAST THE PITCH - JULIAN MORRISON HEAD OF RESEARCH RELATIONSHIPS & NATIONAL KEY ACCOUNTS MARCH 2021 - FSITV
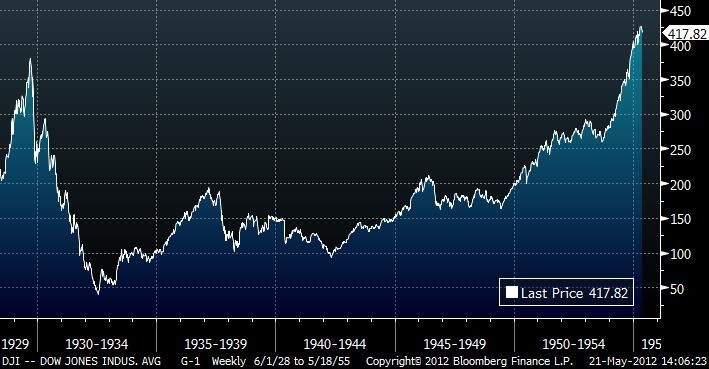
THE INVESTOR’S DILEMMA…
(IF FUND MANAGERS WERE CARS)

              250,000

              200,000

              150,000
    Price $

              100,000

               50,000

                   -
                        Hyundai Excel (1993)   Toyota Corolla (2020)   Porsche 911 (2020)

5
LOOKING PAST THE PITCH - JULIAN MORRISON HEAD OF RESEARCH RELATIONSHIPS & NATIONAL KEY ACCOUNTS MARCH 2021 - FSITV
IS ALPHA ACHIEVABLE? IS IT WORTH IT?

                                       Manager Alpha (LHS)                       Manager Fees (RHS)
    15%                                                                                                                  1.2%

    10%                                                                                                                  1.0%

     5%
                                                                                                                         0.8%
     0%
                                                                                                                         0.6%
     -5%
                                                                                                                         0.4%
    -10%

    -15%                                                                                                                 0.2%

    -20%                                                                                                                 0.0%
           1   7   13   19   25   31     37    43    49      55   61   67   73   79    85   91    97   103   109   115

                                                    Number of Managers

6
LOOKING PAST THE PITCH - JULIAN MORRISON HEAD OF RESEARCH RELATIONSHIPS & NATIONAL KEY ACCOUNTS MARCH 2021 - FSITV
“Eagles soar, but weasels don’t
    get sucked into jet engines”
    Steven Wright

7
LOOKING PAST THE PITCH - JULIAN MORRISON HEAD OF RESEARCH RELATIONSHIPS & NATIONAL KEY ACCOUNTS MARCH 2021 - FSITV
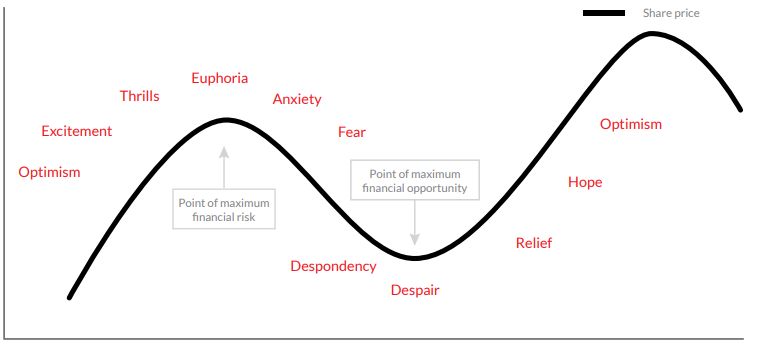
BUT EVEN MODERATE OUTPERFORMANCE CAN MAKE A BIG DIFFERENCE

                         Annualised outperformance                                        End balance                                  Multiple of end balance vs index

                                   Index return*                                            $627,377

                                           1%                                               $872,112                                        1.4x (or $244,736 more)

                                           3%                                             $1,670,691                                        2.7x (or $1,043,314 more)

                                           5%                                             $3,164,791                                        5.0x (or $2,537,414 more)

Source: Morningstar and Allan Gray Australia as at 30 Sept 2019. *All Ordinaries TR Index return of 11.84% p.a. for 37 years to Sep 2019.

     8
WHAT AN ACTIVE MANAGER SHOULD BE

          Distinct

          Transparent

          Sustainable advantage

          Difficult to replicate

9
4 KEY INDICATORS OF A SUSTAINABLE ADVANTAGE

      Alignment of                               Avoid          Willing to oppose
                      Long-term business
     interest a key                        overconfidence and      consensus
                        owner mindset
        principle                          accept uncertainty

10
ALIGNMENT OF INTEREST A KEY PRINCIPLE

11
ALIGNMENT OF INTEREST

                                        Q: Where is the Good Samaritan? A: Too much career risk

Source: Photo CC by Oiluj Samall Zeid

     12
CAREER RISK                           ‘The central truth of the investment business is that investment
                                          behavior is driven by career risk. In the professional investment
                                          business we are all agents, managing other peoples’ money. The
                                          prime directive, as Keynes knew so well, is first and last to keep
                                          your job. To do this, he explained that you must never, ever be
                                          wrong on your own. To prevent this calamity, professional
                                          investors pay ruthless attention to what other investors in
                                          general are doing. The great majority ‘go with the flow’, either
                                          completely or partially. This creates herding, or momentum,
                                          which drives prices far above or far below fair price. There are
                                          many other inefficiencies in market pricing, but this is by far the
                                          largest.’
                                          Jeremy Grantham, GMO

     13
Source: GMO Quarterly Letter April 2012
CAREER RISK

If you were a fund manager, would you prefer….

a. 80% chance of double bonus and 20% chance of zero bonus
b. Guaranteed average bonus

Leads fundamental managers to make non-fundamental
decisions (e.g. ‘this company is 10% of index – having zero
exposure is too risky’)

 14
WHOSE INTERESTS ARE BEING LOOKED AFTER?

                                                                                                                     Average weight of share – 5 largest active managers

                                                                                                                     Weight of share in ASX300 Index

Source: Morningstar and Allan Gray Australia as at 31 January 2021. 5 largest active managers as determined by Morningstar.

    15
WHAT DRIVES ALIGNMENT OF INTERESTS FOR A FUND MANAGER?

        Ownership                   Performance
        structure                       fees

                                                           Activism
                    Co-investment
                                                  (protect shareholder interests)

16
AVOID OVERCONFIDENCE, ACCEPT
     UNCERTAINTY

17
MACRO FORECASTS AND THE DANGERS OF OVERCONFIDENCE

                                                                                                                     In 1999 just before the dot-com bubble burst, 3 books
                     In 1929 just before the Great Crash, respected
                                                                                                                   were published by 3 highly credentialled economic advisers
                    economist Irving Fisher said “Stock prices have
                                                                                                                         predicting that stocks would rise to record highs:
                 reached what looks like a permanently high plateau”.
                                                                                                                        “Dow 36,000” “Dow 40,000” “Dow 100,000”

                             Dow Jones Industrial Index 1929 – 1954                                                       Dow Jones Industrial Index 1996 – 2012

Source: Bloomberg, Professor Irving Fisher, Economist, October 1929. Quotes, J.Glassman, K.Hassett and C.Kadlec.

     18
THE RETURNS TO PERFECT FORESIGHT
                                                     Value of $10,000 Invested in October 1982 for 37 Years

                                            $10,615,573

                                                                                                                                   $627,377

                                      Hero Advice Portfolio                                                                      ASX All Ords
Source: Morningstar and Allan Gray Australia. ASX All Ordinaries Index and hypothetical hero adviser portfolio performance. Data to 30 Sept 2019. Hero Advice Portfolio is a hypothetical
portfolio where the adviser/investor correctly predicts & invests in the best performing Australian Equity managed fund over non-overlapping 5 year periods over 35+ years.

     19
THE RETURNS TO PERFECT FORESIGHT

                                                             Growth of $10,000 Invested in October 1982
        $12,000,000

        $10,000,000

          $8,000,000

          $6,000,000

          $4,000,000

          $2,000,000

                    $0
                      1982                   1987                  1992                   1997                  2002                   2007         2012   2017

                                                                                Hero Advice Portfolio              ASX All Ords

Source: Morningstar and Allan Gray Australia. ASX All Ordinaries Index and hypothetical hero adviser portfolio performance. Data to 30 Sept 2019.

     20
FIVE WORST 12 MONTHS UNDERPEFORMANCE

                                                        Date                                                                  Underperformance

                                            Aug 1986 - Jul 1987                                                                   -18.4%

                                          May 2007 - April 2008                                                                   -15.8%

                                            Feb 2005 - Jan 2006                                                                   -13.9%

                                           Dec 1988 - Nov 1989                                                                    -12.6%

                                            Feb 2016 - Jan 2017                                                                    -9.4%

Source: Morningstar and Allan Gray Australia. ASX All Ordinaries Index and hypothetical hero adviser portfolio performance.

     21
SOME CONFRONTING STATS

       200

                                                                                                                                          Largest relative
       180
                                                                                                                                          underperformance at
                                                                                                                                          39%
       160                                                                                                                                                               Zero net
                                                                                                                                                                         outperformance
       140                                                                                                                                                               for more than 4
                                                                                                                                                                         years

       120

       100
                                                                                                                                          Worst drawdown point
          80

                                                                         Hero Advice Portfolio                   S&P/ASX 300

Source: Morningstar and Allan Gray Australia. ASX All Ordinaries Index and hypothetical hero adviser portfolio performance. Data December 2004 to 30 Apr 2009. TR Index’ to S&P/ASX 300’.

     22
WILLINGNESS TO OPPOSE CONSENSUS

23
IN ENGINEERING…

Source: Shutterstock.

     24
…BUT IN INVESTING

25
SENTIMENT, PRICE AND RISK MOVE IN SAME DIRECTION

     Price

                               Time
Source: Allan Gray Australia

26
CONTRARIAN INVESTING – A RISK AVERSE APPROACH
            50                                                  Oct 2010: “Newcrest has beaten its production                                   9000000
                                                                forecasts for the first time in nine years, which shows
            45                                                  the business is improving.”                                                     8000000
                                                                - The Australian
            40
                                                                                                                                                7000000
            35
                                                                                                                                                6000000
            30
Price AUD

                                                                                                                                                5000000

                                                                                                                                                          Holdings
            25
                                                                                                                                                4000000
            20
                                                                                                                                                3000000
            15
                                                                                                                                                2000000
            10
                                Aug 2013: “5.8bn loss
             5                  rocks Newcrest”                                                                                                 1000000
                                - The Australian
             0                                                                                                                                  0
              2009   2010         2011       2012        2013        2014        2015       2016        2017       2018    2019   2020   2021

                                                    Allan Gray Australia Equity Fund Holdings              Newcrest Price AUD

 Source: Allan Gray as at 31 January 2021.

 27
INTRODUCING
     ALLAN GRAY

     48 YEARS OF
     DOING THINGS
     DIFFERENTLY

28
2006
                                                                    Australia Equity
                                                                    Fund launched

      1973                 1989                  2005                                        2018              2021
Established in South   The Orbis Group is   Allan Gray Australia       2011             Allan Gray Australia   16 years in
   Africa in 1973      formed in Bermuda     began operating in     Australia Stable    Solutions launched      Australia
                                            Sydney and applied      Fund launched
                                                for its AFSL

                                                                       2017
                                                                   Australia Balanced
                                                                    Fund launched

 29
INVESTMENT PHILOSOPHY

Value

                        Time

30
HUGE DISPERSION IN SECTOR VALUATION – PRESENTS OPPORTUNITY
                       80                                                                                                                                               20

                                                                        Forward P/E ratio           AGA relative weight
                       60                                                                                                                                               15

                       40                                                                                                                                               10

                       20                                                                                                                                               5
                                                                                                                                                                           AGA relative
                                                                                                                                                                            weight (%)
                                                                                                                                                                          Australia Equity
  Forward P/E ratio 0                                                                                                                                                   0
                                                                                                                                                                              Fund

                      -20                                                                                                                                               -5

                      -40                                                                                                                                               -10

                      -60                                                                                                                                               -15
                              Information Healthcare Communication   Utilities   Industrials    Consumer     Consumer   Real Estate   Energy   Financials   Materials
                                  Tech                 Services                                Discretionary  Staples
Source: Factset, Allan Gray 31 December 2020

     31
SUMMARY
Manager selection can be made easier

Look for an approach that emphasises….

        Alignment of interests
        Business owner mentality to investment
        Avoiding overconfidence and acceptance of uncertainty
        Latitude and willingness to oppose consensus

32                             White paper available at allangray.com.au
CONNECT WITH US

33
About this presentation
Objective of             To provide you with some key high level information about Allan Gray and Orbis, their investment philosophy and the following Funds:
presentation             (i) the Allan Gray Australia Equity Fund, the Allan Gray Australia Balanced Fund and the Allan Gray Australia Stable Fund (Allan Gray Funds); and
                         (ii) the Orbis Global Equity Fund (Australia Registered) (Orbis Fund or Global Equity Fund).

                         Please don’t take this presentation as an offer to sell or a recommendation that you should invest in any Fund. Before making an investment decision, please read the relevant
                         Fund’s Product Disclosure Statement and Information Booklet (together PDS). The PDS is available from www.allangray.com.au or www.orbis.com free of charge.

Issuer of units          Equity Trustees Limited, AFSL No. 240975
Investment Manager       Allan Gray Funds: Allan Gray Australia Pty Ltd, AFSL No. 298487
                         Orbis Fund: Orbis Investment Management Limited; Australian Distributor: Orbis Investment Advisory Pty Limited, AFSL No. 237862
Orbis Global Strategy    The Orbis Global Equity Strategy represents combined returns of all Orbis funds following the same global investment objective. The strategy information has been used to
and Global Equity Fund   demonstrate Orbis’ contrarian investment philosophy. The Global Equity Fund is Orbis’ Australian domiciled fund that employs the same investment objective as the strategy.
                         Australian retail investors who are interested in the Global Equity Strategy must invest in the Australian domiciled fund.

No personal advice       This presentation only provides general information or advice. It does not take into account any investor’s personal financial circumstances, objectives or needs. Please read
                         Allan Gray’s or Orbis’ Financial Services Guide if you are interested in the benefits either entity is entitled to receive as an AFS licensee. The FSG is available from their
                         respective websites.
Risks                    There are risks with any investment, including one in the Funds. Please read the risk section of the relevant PDS for more details.
Performance              Past performance is not a reliable indicator of future performance and the value of any investment in the Funds is not guaranteed. The net returns for the Orbis Global Equity
information              Strategy, is illustrative and based on returns of the strategy after applying the Retail Class Fee of the Orbis Global Equity Fund based in Australia.

Economic, market, index Such information is provided to indicate reasons for our investment decisions or represents our views on certain matters and based on certain assumptions and proprietary
or stock commentary     analysis. It is not intended to be personal financial advice. You should not rely on our commentary to make any investment decision. This is because our views can and do
                        change over time, or may turn out to be incorrect.
Other                    Finally, please seek professional advice, if necessary. We have tried to ensure the information in this presentation is accurate in all material respects but cannot provide any
                         guarantee that it is.

 34
You can also read