Market Outlook Report- 18th Feb 2021 - Webflow
←
→
Page content transcription
If your browser does not render page correctly, please read the page content below
Market Outlook Report- 18th Feb 2021

                                Compiled by:
            CapitalVia Global Research Limited- Investment Advisor
903, B-1, 9th Floor, NRK Business Park, Scheme No. 54, P.U.-4,Vijay Nagar Square,
                               Indore-452010 (M.P.)

                     Head of Research - Gaurav Garg

             For feedback or queries, mail us at pr@capitalvia.com
                            Ph no.: (+91) 88273 92806
Indian Markets

            Index             Last              High               Low             Change            Change%

             Nifty          15208.90          15314.30           15170.75            -104.55           -0.68%

            Sensex          51703.83          52078.15          51586.34            -400.34             -0.77%

           Banknifty        36910.95          37331.45          36764.25             -187.45            -0.51%

           Nifty FUT        15190.55          15323.85           15165.05            -139.70            -0.91%

               Nifty opened on a flat note on 17th February 2021, it tried to sustain at higher levels but could
               not and closed below 15300, the support seems to be at 15200 and resistance at 15450.
Overview

               Investors may initiate longs if Nifty crosses and sustains above 15250.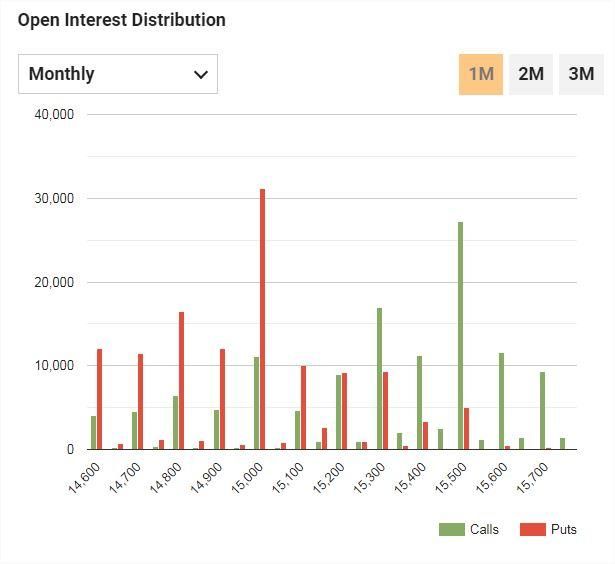
Global Markets

 Index          Last            High           Low           Change       Change%         ➢   U.S. Treasury yields hit one-year highs on Wednesday, lending support to
                                                                                              the dollar but pressuring lofty valuations for stocks, as investors reckoned
Dow 30            31,522.75     31,608.63     31,443.48         +64.35           +0.20%
                                                                                              that a stimulus-fuelled global recovery will eventually bring rising
Nasdaq            14,047.50      14,175.12    13,995.45         -47.98           -0.34%       inflation.

 DAX                13,974.10   14,046.65     13,934.05         -90.50           -0.64%
                                                                                          ➢   European stock markets retreated Wednesday, consolidating after
FTSE 100            6,725.05     6,747.15       6,710.65         -23.81          -0.35%       recent gains with investors growing wary of rising bond yields while the
                                                                                              earnings season continues.

            Index               S1           Pivot Points         R1                      ➢   Asia Pacific stocks were mostly down on Wednesday morning, with
                                                                                              optimism over a quick global economic recovery from COVID-19
           Dow 30                31493.03         31524.20         31557.30
                                                                                              weighed down by continued virus concerns.

           Nasdaq                14028.57         14048.06         14064.80

            DAX                   13964.51        14005.58            14064.61

           FTSE 100               6646.33         6660.09             6687.62
Derivative Outlook
⮚ Market indices corrected from higher level and traded on a negative note as on Wednesday, 17th February. Profit
booking was witnessed in the market with Nifty ending the day with of loss of 0.68 percent. Mix trend was
observed among sectors where PSU bank, media and auto closed on a positive note while selling witnessed in
the rest of the indices.
⮚ In the coming trading session on Thursday, 18th February volatility in the market is expected to remain high
amid weekly contract expiry. Profit booking could be seen in Nifty as it has breached the major support of 15,200
level. On the higher side 15,350 to 15,400 could be the resistance zone for the index.
⮚ Highest Daily Nifty Call OI-15,500
⮚ Highest Daily Nifty Put OI-15,000
Long built-up:
Scrip Name Closing price Change in price Change in OI
PNB 41.45 4.54% 24.10%
ADANIPORTS 655.75 2.48% 26.08%
IDEA 11.85 0.42% 1.42%Short built-up:
Scrip Name Closing price Change in price Change in OI
ICICIBANK 656.05 -5.20% 6.94%
PFC 130.70 -3.60% 9.04%
IOC 95.40 -0.70% 3.22%
Short covering:
Scrip Name Closing price Change in price Change in OI
NATIONALUM 50.75 0.69% -4.84%
BANKBARODA 84.40 6.23% -3.33%
ZEEL 214.25 3.78% -2.64%
Long Unwinding:
Scrip Name Closing price Change in price Change in OI
DLF 315.20 -1.41% -4.67%
IBULHSGFIN 221.20 -2.49% -2.27%
TATASTEEL 696.10 -0.83% -1.78%Nifty Option Chain
Analysis :
⮚ Nifty closed on a negative note with a loss of around 0.68 percent
as on Wednesday, 17th February. The options data indicates
immediate trading range of the Nifty is likely to be 15,000 – 15,500.
Maximum Put open interest was at 15,000 followed by 14,800 strike,
while maximum Call open interest was at 15,500 followed by 15,300
strike. Call writing was seen at 15,300 and 15,400 strikes while Put
writing was seen at 15,200 and 15,100 strikes. IndiaVIX declined 1.26
percent and close at 21.51.
Source: www.bloombergquint.comNifty Option Chain
Analysis :
➢ As per monthly option data , Nifty should trade in the range of
9000-10000 . Maximum Put writing can be seen at 9000 and
Maximum call writing can be seen at 10000
➢ Nifty closed with gains on Wednesday,6th May. We expect Nifty to
be range bound , Volatility is most likely to increase in the coming
trading session. Indecisiveness can be seen in the market as
trading range of Nifty is getting smaller. As per weekly option data,
nearest support can be seen at 9200 and on the higher side,
resistance can be seen at 9400.
Source: www.bloombergquint.comGlobal Markets
Index Last High Low Change Change%
Dow 30 23783.44 24054.59 23782.28 -99.65 -0.42% ➢ U.S. stocks opened higher on hopes of a pickup in business activity
with states easing Coronavirus-induced curbs, while investors
Nasdaq 8825.55 8913.85 8819.37 17.76 0.20%
looked past a stunning 20 million plunge in U.S. private payrolls last
DAX 10615.73 10771.68 10604.90 -111.74 -1.08% month.
FTSE 100 5850.80 5898.33 5838.70 0.88 0.02%
➢ European stock markets traded slightly lower on Wednesday amid
weak economic data, while better than expected earnings helped
the U.K. to outperform.
Index S1 Pivot Points R1
➢ German factory orders slumped 15.6% in March to their lowest level
Dow 30 23760.10 23906.82 23996.82
since records began in 1991, while IHS Markit's final Composite
Nasdaq 8840.29 8876.96 8901.71 Purchasing Managers' Index for the euro zone, seen as a good
indicator of economic health, plummeted to 13.6 in April from
DAX 10624.80 10676.20 10704.30
March's already dire 29.7, easily its lowest reading since the survey
FTSE 100 5850.41 5874.37 5889.24 began in 1998.Disclosure
➢ CapitalVia Global Research Limited (hereinafter referred as “CapitalVia”) shall not be liable for any misrepresentation, falsification, and deception or for any lack of availability of
services through the website, even if the same are advertised for, on the website.
➢ Customers to take a note: We touch base with our customers and prospects using the phone no.series
+91 7313 816 000 to +91 7313 816 299, +91 7316 736 100 to +91 7316 736 499 & +91 731 677 4001 (Kindly note that CapitalVia serves all it customers only from the above mentioned
numbers. Thus any call from number other than mentioned above, claiming to be from CapitalVia, shall be completely ignored.) Please beware of spoof calls and report such case on
our hotline number +91 8085 999 333
➢ CapitalVia confirms that no employee of ours can engage in (directly or indirectly) any trade or business in capital market.We do not allow any of our employees to participate in
trading business.W also restrict our people from getting into any related business or otherwise for ensuring unbiased services to the clients of CapitalVia.
➢ In compliance to SEBI (Investment Advisers) Regulation 2013, all our Research Analysts are certified by the National Institute of Securities Market (NISM) with an experience of more
than 5000 Hours and its still adding.
➢ The track record of the services offered by CapitalVia is published on a day+1 basis to its websites, i.e. www.capitalvia.com/dashboard.
➢ CapitalVia categorically states that different types of investments involve varying degrees of risk, and there can be no assurance that the future performance of any specific
investment or investment strategy (including those undertaken or recommended by the CapitalVia), will be profitable or equal any historical performance level(s).
➢ Your KYC and RPM formalities need to be complete before you can use any service from CapitalVia. Even if the subscription fee is paid, no service would be rendered to any customer
before completion of KYC and RPM formalities. For completing the KYC formalities, we proceed with the information mentioned on the PAN Card Number only.
➢ The service offered to any customer depends on his/her Risk Profile Management. CapitalVia offers only those service to the customers which are either of the same risk category or
less. In all the other cases, CapitalVia offers no services and the subscription fee is returned.
➢ The website contains features of the services that are currently being offered by CapitalVia and those intended to be offered in the future. CapitalVia intends to launch the services,
confirming with the features listed on the website in total, however, due to business need and regulatory requirement the final launch may contain variables. Notwithstanding
anything contained in the website regarding the services, CapitalVia may decide to postpone the offering of the services or may even decide to withdraw the offering or even a
currently offered service altogether.
➢ Any alliances, partnership co-branding that we have doesn't guaranty or assure free gifts, profit etc. This partnerships are meant for providing additional benefits to our subscribers
during festive season or special occasions while they are subscribing our services. These offers by no means designed or presented to lure our prospects towards subscribing our
services.
➢ CapitalVia is not engaged in any kind of execution services - directly or indirectly. Its alliances with TradeSmart which is engaged in execution services, are restricted to mutually
beneficial marketing activities wherein both CapitalVia and the TradeSmart shall display each other’s products at discounted price, to their own customers, permission based leads
and opportunities. As a business, we DO NOT offer or are involved in any direct or indirect execution services. Our services are limited to providing research based trading
recommendations.
➢ CapitalVia reserve the right to modify/ alter/ change the content of its website. Clients are advised to update themselves from time to time.
➢ Clarification on the news published on 28th June 17 on the13th Page of Indore Times of India. Click Here
➢ Investments in securities are subject to market risks, which includes price fluctuation risk. There is no assurance or guarantee that the objectives of any of the products mentioned in
this document or on this site will be achieved.
➢ As a business, we offer stock recommendations based on technical research ONLY to our subscribers. We have not authorised any organisation or firm to represent us and offer stock
recommendations on our behalf.
➢ As a business, we DO NOT offer or involved in any direct or indirect execution services. Our services are limited to providing research based trading signals.
➢ Methodology of maintaining track record of recommendations Click Here
➢ Police advisory for investors who taking services of financial advisors. Click HereYou can also read