COVID-19 Automotive demand post COVID-19 - Boston Consulting Group

Page created by Judy Berry
 
CONTINUE READING
COVID-19 Automotive demand post COVID-19 - Boston Consulting Group
COVID-19
Automotive
demand post
COVID-19
COVID-19 Automotive demand post COVID-19 - Boston Consulting Group
Anticipate a prolonged Fight phase of 12-24 months
Scenarios and outcome driven by five key questions; shape varies based on regional assumptions

                                                                                                                       Illustrative

                          Flatten                                         Fight                                    Future

                      Shut down                  Restart                                              Cure

Economic
activity                              1a                                    2a
100%                                                                                                           3

                                                            2b                       Potential Pathways
                                      1b

Critical care
patients

Five questions          What will be the LENGTH of               What will be the LENGTH of                   Where does the
                 1a                                        2a                                             3
will shape              “Flatten”?                               “Fight”?                                     economy return
the economic                                                                                                  to relative to the
outcomes                To what DEPTH does the                   What LEVEL of recovery does the              pre-COVID era in
                 1b     economy drop in “Flatten”?         2b    economy achieve in “Fight”?                  “Future”?

Source: BCG                                                                                                        AUTOMOTIVE DEMAND POST COVID-19
COVID-19 Automotive demand post COVID-19 - Boston Consulting Group
As of 15 May 2020

Fight: Auto sales in China on recovery path

     Flatten                    Fight                   Future

2b | LEVEL of recovery

   Vehicle sales                                                                 Vehicle sales                                                             Vehicle sales
   China1                                                                        Europe2                                                                   US3
       -20%                     -46%                                                                         -46%
                                                                                                                                                                           -39%

                                                                                                                                                                    +8%
                                             -3%
                                                                                                                                                                                    -52%
                                                                                                                         ~-80%                              0%
                   -82%                                                             -7%          -7%

     Jan           Feb          Mar          Apr                                  Jan          Feb          Mar           Apr                               Jan     Feb    Mar      Apr
    2019         2020
1. Passenger vehicles sales by month including Mini Vans; 2. New passenger car registrations by month, Europe = EU26 + UK + Iceland, Norway, Switzerland
2. 2020 estimate based on BCG analysis; 3. Light Vehicles (LV) include Passenger Vehicles (PV)
Sources: Marklines/China Association of Automobile Manufacturers (CAAM), ACEA actuals, Wards Automotive, BCG analysis and forecast                                           AUTOMOTIVE DEMAND POST COVID-19
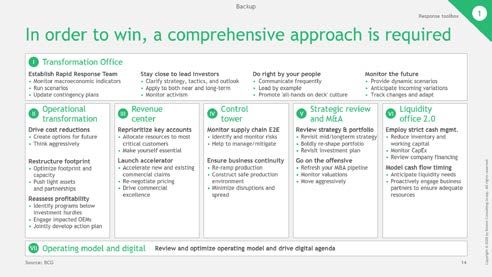
COVID-19 Automotive demand post COVID-19 - Boston Consulting Group
As of 15 May 2020

Economic forecasts deteriorating globally for 2020 while
remaining stable for 2021

     Flatten                       Fight                    Future
2b | LEVEL of recovery

                     GDP growth forecast (YoY in %)                                                                                                                                   GDP level forecast 2
                                                       2020                                                                                2021                                            EOY 2021 vs.
                     -10%    -8%    -6%     -4%      -2%   0%      2%   4%   6%     8%   10%             -10%    -8%     -6%   -4%   -2%    0%      2%   4%      6%   8%    10%             EOY 2019
     China     1
                                                                1.2%         6.0%                                                                             5.8%         9.2%

                                                                                                                                                                                             107–112%

     Europe2                  -7.5%                             1.3%                                                                             1.4%     4.7%

                                                                                                                                                                                             95–101%

     US3                            -5.9% Forecast          2.0% Baseline                                                                        1.7%     4.7%

                                                                                                                                                                                             97–100%
                                   Forecast range

         Forecast (IMF Apr 2020)              Baseline (IMF Jan 2020)                    Forecast range (IMF & Banks3)

Note: As of reports dated 31 March 2020 to 05 May 2020, YoY forecasts 1. Announced by the German Federal Ministry for Economic Affairs and Energy on 29 Apr 2020
2. Range calculated with 25th & 75th percentile values of forecast range 3. Range from forecasts (where available) of International Monetary Fond, JP Morgan Chase; Morgan Stanley;
Bank of America; Fitch Solutions; Credit Suisse; Danske Bank; ING Group; HSBC Source: German Federal Ministry for Economic Affairs and Energy; Bloomberg; IMF; BCG analysis            AUTOMOTIVE DEMAND POST COVID-19
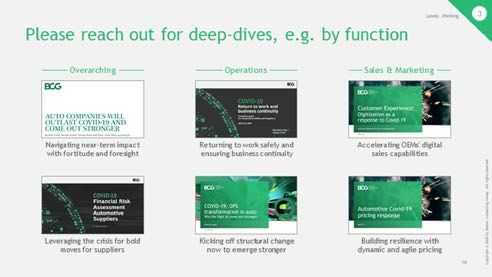
COVID-19 Automotive demand post COVID-19 - Boston Consulting Group
As of 15 May 2020

Change in mobility behavior expected –
intentions stronger in China

     Flatten                     Fight                   Future
3 | Return of economy in the FUTURE

Risk associated with mode of                                                   Mode of transport                                 Change of likelihood to buy/
transport after lockdown                                                       usage after lockdown                              own car after COVID-19
   Very                                                                        Much more                                         Much more
low risk                                                                         frequent                                             likely

                                                                                                            -50%
                                                                 >60%                                                                 -60%

    Very                                                                          A lot less                                      Much less
high risk                                                                         frequent                                           likely
               Public transit                Private car                                       Public transit      Private car                 Buying a car      Owning a car

          People see car as the safest                                                Private car will be more preferred after        Clear picture in China on trend towards
            mode of transportation                                                        lockdown – especially in China            buying/owning car while EU/USA are mixed
Source: BCG; Urban mobility study surveyed 5,000 people in large cities around the world                                                                AUTOMOTIVE DEMAND POST COVID-19
COVID-19 Automotive demand post COVID-19 - Boston Consulting Group
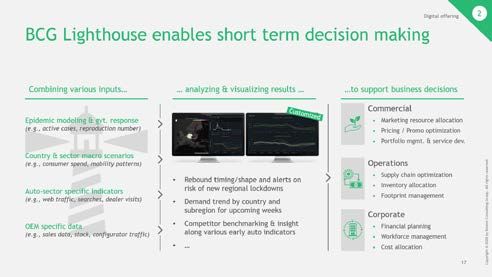
Four scenarios of the crisis are simulated along Flatten-Fight-Future

            1   Optimistic                             2   Most likely I                            3   Most likely II                               4   Pessimistic
GDP level

            ARCHETYPE
            V-shape                                    V skewed to a U                              U-shape                                          W-shape skewed to an L

            MACROECONOMIC
            Positive surprise in virus properties      Virus properties stay or worsen              Virus properties linger with                     Occurrence of 2nd wave with severe global impact
                                                                                                    continued fear of mutation
            Rapid catch-up in mitigation measures      Mitigation efforts are slow / unsuccessful                                                    Repeated shocks on regional/local
            and their effectiveness                    and have to be extended                      Mitigation efforts are intense, yet ultimately   level lead to frequent lockdowns
                                                                                                    unsuccessful
            Significant monetary and fiscal response   Household & business confidence falls                                                         Severe depression of household
                                                       & remains depressed (08/09 crisis)           Heightened incidents as economies reopen         & business confidence
            Household and business spending
                                                                                                    necessitate new shutdowns
            stays largely in tact                      Rebound through governmental                                                                  Severe implications on labor, capital and
                                                       support in investments, business             Household & business confidence remains          productivity of the economy
            Few businesses fail, unemployment
                                                       sector and households                        depressed
            recovers from initial dip                                                                                                                Economy increasingly embraces remote working
                                                                                                    Financial system begins to show cracks
            AUTO
            Government backed incentives and cheap     Confidence slowly increasing, supported by   New vehicle sales remain depressed as market     Auto supply chains severely disrupted
            credit spur quick recovery                 government incentives                        moves into prolonged economic downturn
                                                                                                                                                     Continued shutdowns e.g., plants, dealers
            Deferred automotive demand recovered       Demand partly recovered, yet significant     Significant portion of sales lost
                                                                                                                                                     Lingering change to consumer mobility
                                                       portion of sales lost in ‘20
                                                                                                                                                     patterns; Immense loss of sales

            UNLIKELY                                   COVID-19 CRISIS MOST LIKELY                                                                   UNLIKELY
            Source: BCG analysis
                                                       IN RANGE OF THESE SCENARIOS                                                                                AUTOMOTIVE DEMAND POST COVID-19
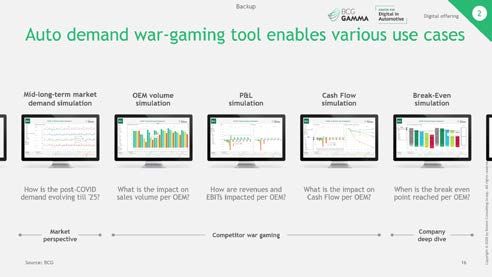
COVID-19 Automotive demand post COVID-19 - Boston Consulting Group
As of 19 May 2020

Automotive Demand: Also in mid-term significant global impact

Sales forecast for CN, EU, US
(vehicle units in M)
Most likely scenario

                                        -14%          -6%          -1%          +4%          +7%          +9%                               -12%          -3%           +1%           +7%           +10%          +12%
      Most likely I                                                                                                    Optimistic
                                                                                                                68.4                                                                                                     70.2
      scenario                   62.5                                    61.8
                                                                                      65.0         66.8
                                                                                                                       scenario      62.5                                      63.1
                                                                                                                                                                                             66.6          68.6
                                                            59.0                                                                                                 60.7
                                               53.4                                                                                                55.2
                                                                                      27.4         28.4         29.4                                                                         28.0          29.1          30.1
                                24.8                                     25.7                                                        24.8                                      26.2
                                                            24.8                                                                                                 25.4
                                               22.8                                                                                                23.4

                                20.5                                     19.8         21.0         21.4         21.8                 20.5                        19.8          20.3          21.4          22.0          22.5
                                               16.8         19.2                                                                                   17.5

                                17.1           13.8         15.0         16.2         16.7         17.1         17.1                 17.1          14.2          15.4          16.6          17.1          17.5          17.6

                                 2019          2020         2021         2022         2023         2024         2025                 2019          2020          2021          2022          2023          2024          2025

                                        -22%          -7%          -4%          0%           +3%          +5%                               -28%          -15%          -13%          -11%          -8%           -6%
      Most likely II                                                                                                   Pessimistic
                                                                                                                65.6                 62.5
      scenario                   62.5
                                                            58.0         59.9
                                                                                      62.2         64.1
                                                                                                                       scenario                                                              55.9          57.5          58.9
                                                                                                                                                                 53.2          54.0
                                               49.0                                                                                  24.8
                                 24.8                                                 26.5         27.6         28.5                               45.1
                                                                                                                                                                                                                         25.4
                                                            24.2         25.0                                                                                    21.9          22.4          23.7          24.6
                                               22.1                                                                                                20.9
                                 20.5                                                 20.0         20.5         21.0                 20.5
                                                            18.9         19.5                                                                                    17.4          17.7          18.0          18.4          18.8
                                               14.8                                                                                                13.5
                                 17.1          12.2         15.0         16.2         15.7         16.1         16.1                 17.1                        13.8          14.0          14.2          14.5          14.6
                                                                                                                                                   10.7
                                 2019          2020         2021         2022         2023         2024         2025                 2019          2020          2021          2022          2023          2024          2025

                                                                                                                                        China               Europe                USA

Source: BCG Automotive Demand Model; IHS; BCG Analysis                                                                                                                         AUTOMOTIVE DEMAND POST COVID-19
Next step: Please feel free to reach out regarding our tools/insights

1             Response
              toolbox              2        Digital
                                            offering                 3        Our latest
                                                                              thinking

Comprehensive approach to          Mid-long-term: Demand scenarios   Overarching and functional deep-
managing COVID-19 response         and P&L / cash flow wargaming     dive material on demand

Handle immediate response          Short-term: Monitor and analyze   Regular publications on crisis,
and leverage crisis in long-term   indicators for decision support   necessary actions & impact on auto

Source: BCG                                                                                   AUTOMOTIVE DEMAND POST COVID-19
COVID-19 Disclaimer

     The situation surrounding COVID-19 is dynamic and rapidly evolving, on a daily basis.
     Although we have taken great care prior to producing this presentation, it represents
     BCG’s view at a particular point in time. This presentation is not intended to: (i)
     constitute medical or safety advice, nor be a substitute for the same; nor (ii) be seen
     as a formal endorsement or recommendation of a particular response. As such you
     are advised to make your own assessment as to the appropriate course of action to
     take, using this presentation as guidance. Please carefully consider local laws and
     guidance in your area, particularly the most recent advice issued by your local (and
     national) health authorities, before making any decision.

                                                                                    AUTOMOTIVE DEMAND POST COVID-19
Disclaimer

      The services and materials provided by Boston Consulting Group (BCG) are subject to BCG’s Standard Terms (a copy of which is available upon
      request) or such other agreement as may have been previously executed by BCG. BCG does not provide legal, accounting, or tax advice. The Client
      is responsible for obtaining independent advice concerning these matters. This advice may affect the guidance given by BCG. Further, BCG has
      made no undertaking to update these materials after the date hereof, notwithstanding that such information may become outdated or inaccurate.

      The materials contained in this presentation are designed for the sole use by the board of directors or senior management of the Client and solely
      for the limited purposes described in the presentation. The materials shall not be copied or given to any person or entity other than the Client
      (“Third Party”) without the prior written consent of BCG. These materials serve only as the focus for discussion; they are incomplete without the
      accompanying oral commentary and may not be relied on as a stand-alone document. Further, Third Parties may not, and it is unreasonable
      for any Third Party to, rely on these materials for any purpose whatsoever. To the fullest extent permitted by law (and except to the extent
      otherwise agreed in a signed writing by BCG), BCG shall have no liability whatsoever to any Third Party, and any Third Party hereby waives any
      rights and claims it may have at any time against BCG with regard to the services, this presentation, or other materials, including the accuracy or
      completeness thereof. Receipt and review of this document shall be deemed agreement with and consideration for the foregoing.

      BCG does not provide fairness opinions or valuations of market transactions, and these materials should not be relied on or construed as such.
      Further, the financial evaluations, projected market and financial information, and conclusions contained in these materials are based upon
      standard valuation methodologies, are not definitive forecasts, and are not guaranteed by BCG. BCG has used public and/or confidential data and
      assumptions provided to BCG by the Client. BCG has not independently verified the data and assumptions used in these analyses. Changes in the
      underlying data or operating assumptions will clearly impact the analyses and conclusions.

                                                                                                                                          AUTOMOTIVE DEMAND POST COVID-19
You can also read