RESULTS 2018 - Ebro Foods
←
→
Page content transcription
If your browser does not render page correctly, please read the page content below
RESULTS
     2018

            1
Contents

▪   BUSINESS UNIT RESULTS 2018
    1.1 Rice
    1.2 Pasta
▪   CONSOLIDATED GROUP RESULTS 2018
    2.1 P&L
    2.2 Debt Performance
▪   CONCLUSION

▪   CORPORATE CALENDAR 2019

▪   LEGAL DISCLAIMER

                                      2
BUSINESS UNIT RESULTS 2018

                             3
1.1.1 Rice 2018
Harvests closed during the last quarter in Europe and North America. In Italy there was an uptick in short-grain and
long-grain rice varieties, while in Spain this only affected long-grain varieties. Long-grain rice prices increased after
the EU announced it was activating its safeguarding mechanism to halt tariff-free imports from EBA countries. Prices
fell in the US, especially in Texas.
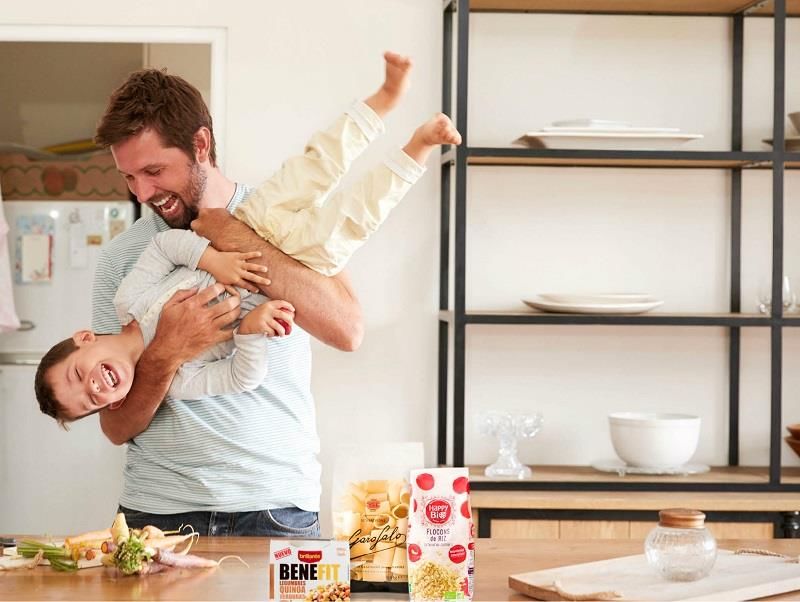
Most of our brands grew in Europe, while the market remained flat. The success of new microwavable products has
led to significant investment to boost capacity. We recently approved a large investment (EUR70 million) in a ready
to serve rice plant at La Rinconada (a former sugar factory), where we expect to start seeing results by the end of
2020.
In North America, we have implemented the various measures that we set out in our last report:
we successfully implemented the latest tariff rise in order to offset inflation pressure (raw materials, auxiliary
raw materials, distribution and salaries), which had been negatively impacting results,
the new microwavable lines in Memphis are now working much better, and
we carried out the adjustments in Freeport, with no issues to report.
However, we are still encountering problems with distribution and employee turnover at factories (particularly
Freeport) due to the full employment rate in the US.
Even though these measures take longer to make an impact, we saw a slight uptick in the 4Q results, which will
gradually continue to consolidate over the coming months.
4
1.1.2 Rice 2018
The division’s year-end sales climbed 5% to EUR1,412.7 million, mainly due to the increase in the price of raw
materials and volume growth in Europe.

Advertising investment fell by EUR1.1 million to EUR27 million, in a year in which we placed greater importance on
trade marketing investment.

EBITDA fell 21.4% to EUR162 million. The latest tariff hike by the US only started to impact results during the last
month. The exchange rate had a negative impact of EUR3.5 million on EBITDA.

EBIT fell 28.2% to EUR123.9 million, primarily due to recent investments to boost capacity, which are already
bearing fruit.

                      EUR Thous.          2016        2017        2018       18/17    CAGR 18/16
                      Sales              1,283,853   1,345,026   1,412,702       5.0%        4.9%
                      Advertising           30,135      28,088      26,969      -4.0%       -5.4%
                      Ebitda               196,264     205,988     161,933     -21.4%       -9.2%
                      Ebitda Margin         15.3%       15.3%       11.5%
                      Ebit                163,561     172,522     123,857     -28.2%       -13.0%
                      Operating Profit    169,240     174,027     125,390     -27.9%       -13.9%

                                                                                                                5
1.2.1 Pasta 2018
On the back of a good 2018/19 harvest, the lower price of durum wheat has allowed us to stockpile in order to
mitigate any volatility risk in 2019.

In terms of our businesses:

     Panzani sales bounced back during 4Q, after the decline in pasta consumption over the summer due to warm
     temperatures. The so-called yellow vests movement has had a negative impact supply and fresh pasta sales,
     but a positive impact on the sale of dry products, due to people stockpiling goods. Lower sales during the
     summer and the negative performance of Roland Monterrat caused a slight decrease in contribution.

     We increased advertising in Garofalo by 55% during 2018. Following our investments aimed at improving its
     weighted distribution, it grew significantly, leading growth in the premium dry pasta segment across various
     markets.

     Bertagni, the Group's most recent acquisition in the premium fresh pasta market, has been consolidated since
     April and has provided EUR9.5 million to EBITDA since its acquisition.

     Riviana Pasta has been affected by distribution problems and the full employment situation in the US,
     although not to the same extent as the Rice Division. Competition slowed slightly in Canada during 4Q,
     allowing us to recover margins and return to growth.

                                                                                                                    6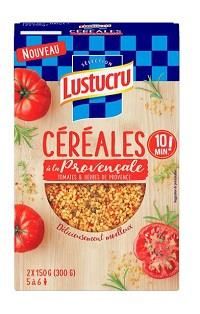
1.2.2 Pasta 2018
The division’s year-end sales were up by 6.6% to EUR1,298.5 million. Bertagni contributed EUR60.2 million, with
organic growth standing at circa 1.6%, in spite of the aforementioned impact on sales from the heatwave in France.

Advertising investment was down EUR2.8 million to EUR63.4 million. However, in the last quarter we invested
20.6% more than in 4Q 2017, helping to balance out our investments in advertising and promotion.

EBITDA fell by EUR6.5 million to EUR156.5 million. Compared to 4Q 2017, EBITDA grew 13.3% and raised the
quarterly margin to 15%, further cementing the expected recovery. Currency had a negative impact on EBITDA of
EUR1 million.

                       EUR Thous.         2016     2017      2018     18/17 CAGR 18/16
                       Sales            1,236,227 1,218,404 1,298,533    6.6%      2.5%
                       Advertising         70,840    66,154    63,368   -4.2%     -5.4%
                       Ebitda             157,089   162,977   156,465   -4.0%     -0.2%
                       Ebitda Margin       12.7%     13.4%     12.0%    -9.9%     -2.6%
                       Ebit               113,544   117,420   106,366   -9.4%     -3.2%
                       Operating Profit    93,294   102,050    99,415   -2.6%      3.2%

                                                                                                                     7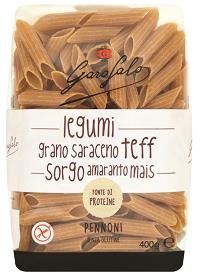
CONSOLIDATED GROUP RESULTS
2018

                             8
2.1 P&L 2018
Group sales grew by 5.6% to EUR2,646.5 million. Organic growth stands at 2%, a healthy figure considering that
the tariff hikes were not fully implemented until 4Q.

During the last quarter, we increased advertising by 12%, meaning that we invested practically the same amount
(EUR92.6 million) as the previous year, in y-o-y terms and at a constant exchange rate.

EBITDA fell by 13.4% to EUR310.8 million, with currency having a negative impact of EUR4.4 million. The year-on-
year Ebitda margin declined by 2.6 pp to 11.7%. If we look at 4Q alone, the measures implemented during 2018
are already bearing fruit, with margins recovering to nearly 14%.

Net profit fell 36% to EUR141.6 million. For the purposes of comparison, we would note that last year, there was a
significant increase in profit, mainly due to the tax-related measures approved in the USA, France and Italy, leading
to one-off extraordinary income of EUR56.5 million being entered in the accounts in respect of corporate income
tax. Excluding this external effect, and despite difficulties in the year, profits fell by 14%.

                EUR Thous.                 2016        2017        2018        18/17 CAGR 18/16
                Sales                      2,459,246   2,506,969   2,646,523       5.6%     3.7%
                Advertising                  100,401      93,134      89,694      -3.7%    -5.5%
                Ebitda                       344,141     359,000     310,763     -13.4%    -5.0%
                Ebitda Margin                 14.0%       14.3%       11.7%
                Ebit                         267,308     279,314     221,951    -20.5%       -8.9%
                Operating Profit             264,608     271,079     218,128    -19.5%       -9.2%
                Pre-tax Profit               259,410     264,131     212,950    -19.4%       -9.4%
                Net Profit                   169,724     220,600     141,589    -35.8%       -8.7%
                ROCE                            16.6        12.3        12.0

                                                                                                                   9
2.2 Debt Performance
2018 ended with a y-o-y increase in net debt of EUR187.4 million to EUR704.6 million, following significant
investments in:
       raw materials, to guarantee supply due to high volatility in the market,
       strategic organic growth via CapEx investment,

               EUR Thous.           2016           2017          2018        18/17    CAGR 18/16
               Total CAPEX           107,724         120,671      138,930    15.1%      13.6%

      the acquisition of Bertagni, including the full acquisition value, even though the ownership stake is only 70%.
      We would highlight that EUR160.4 million of the Nebt Debt figure relates to future PUT options commitments
      negotiated when acquiring Garofalo, Bertagni, Santa Rita and Geovita.
Equity grew by 4.2% to EUR2,162.3 million.

Following the aforementioned major investments and given the one-off EBITDA slowdown, ND/EBITDA18 increased
to 2.3 times. Excluding temporary impacts, our debt remains at a very manageable level and we continue to look for
non-organic opportunities in the market.

                EUR Thous.               31 Dec 16 31 Dec 17 31 Dec 18        18/17    CAGR 18/16
                Net Debt                    443,206   517,185   704,621       36.2%         26.1%
                Average Net Debt            404,137   426,042   627,350       47.3%         24.6%
                Equity                    2,079,326 2,074,637 2,162,334        4.2%          2.0%
                ND Leverage                    21.3%     24.9%      32.6%     30.7%         23.6%
                AND Leverage                   19.4%     20.5%      29.0%     41.3%         22.2%
                x Ebitda (ND)                    1.3       1.4         2.3
                x Ebitda (AND)                   1.2       1.2         2.0

                                                                                                                10
CONCLUSION
Conclusion
We reacted to the various extraordinary and, to a large extent, external effects that occurred during the first few
months of the year, allowing us to already note signs of recovery during 4Q, which we expect to consolidate
further in the coming months.

We are very pleased with the positive performance of our brands and the take-up of new products.

Our major organic investments over the last three years have a different return curve to the non-organic
investments that we are used to, although we expect them to generate strong growth and returns soon.

Garofalo continues to grow internationally as one of the Group’s premium brands. The acquisition of Bertagni will
allow us to expand this concept and not only lead the premium dry pasta category, but also corner the fresh pasta
market.

Harvests were generally good, allowing us to stockpile our raw materials, in order to start 2019 with greater
stability.

To conclude, 2018 was a complicated year, but the final quarter results confirm that the worst is now behind us,
and that we are in a good position to take on 2019 and return to the growth we enjoyed in recent years.

                                                                                                               12
Corporate Calendar
As part of Ebro’s commitment to complete transparency, below we provide our Corporate Calendar for 2019:
➢ 28 February Presentation of YE2018 Results
➢ 1 April Four-month payment of ordinary dividend (EUR0.19/share)
➢ 30 April Presentation of 1Q Results
➢ 28 June Four-month payment of ordinary dividend (EUR0.19/share)
➢ 26 July Presentation of 1H results
➢ 1 October Four-month payment of ordinary dividend (EUR0.19/share)
➢ 31 October Presentation of 9M19 Results and Pre-YE 2019
13Legal Disclaimer
This presentation contains our true understanding to date of estimates on the future growth in the different business lines and the global business, market
share, financial results and other aspects of business activity and the positioning of the Company. All the data included in this report has been put together
according to International Accounting Standards (IAS). The information included herein does not represent a guarantee of any future actions that maybe
taken and it entails risks and uncertainty. The true results may be materially different from the ones stated in our estimates as a result of various factors.
Analysts and investors should not rely on these estimates, which only cover up to the date of this presentation. Ebro Foods does not assume any obligation
to publicly report the results of any review of these estimates that may be carried out to reflect events and circumstances occurring after the date of this
presentation - including but not limited to - changes in Ebro Foods business or its acquisitions strategy, or to reflect unforeseen events. We encourage
analysts and investors to consult the Company’s Annual Report, as well as the documents filed with the Authorities and more specifically with the Spanish
National Securities Markets Commission (CNMV).
The main risks and uncertainties affecting the Group’s business are the same as those included in Note 28 of the Consolidated Annual Accounts and the
Management Report for the year ending 31 December 2017, which is available at www.ebrofoods.es. We believe that there have been no significant
changes during this financial year. The Group still has some exposure to the raw materials markets and to passing on changes in prices to its customers.
Likewise, there is certain exposure to fluctuations in the exchange rate, especially the dollar, and changes in interest rates.
According to the guidelines set by the European Securities and Markets Authority (ESMA), the following is a list of the indicators used in this report. These
indicators are currently and consistently used by the Group to describe its business performance and their definitions have not been altered:
Ebitda. Earnings before interest, taxes, depreciation and amortization, excluding results considered as extraordinary or non-recurring (essentially
profit earned from transactions relating to the Group’s fixed assets, industrial restructuring costs, results from or provisions for lawsuits, etc.).
31/12/2016 31/12/2017 31/12/2018 2018 - 2017
EBITDA 344,141 359,000 310,763 (48,237)
Provision for amortisation (76,833) (79,686) (88,812) (9,126)
Non-recurring income 25,598 11,144 8,973 (2,171)
Non-recurring costs (28,298) (19,379) (12,796) 6,583
OPERATING PROFIT 264,608 271,079 218,128 (52,951)
Net debt. Financial liabilities with cost, the value of shares and put/call options qualified as such, and where applicable, dividends that have accrued
and are pending payment, minus cash and cash equivalents.
CAPEX. Capital expenditure - payments for investment in production related fixed assets.
ROCE. Return on capital employed – a measure on yield on assets calculated as income before tax and interest minus any income regarded as
extraordinary or non-recurring for the period considered, divided by Net Average Assets for the period, minus Financial Assets and Goodwill.
14You can also read