Investor Fact Book April 2021 - Alliant Energy
←
→
Page content transcription
If your browser does not render page correctly, please read the page content below

Investor Fact Book
April 2021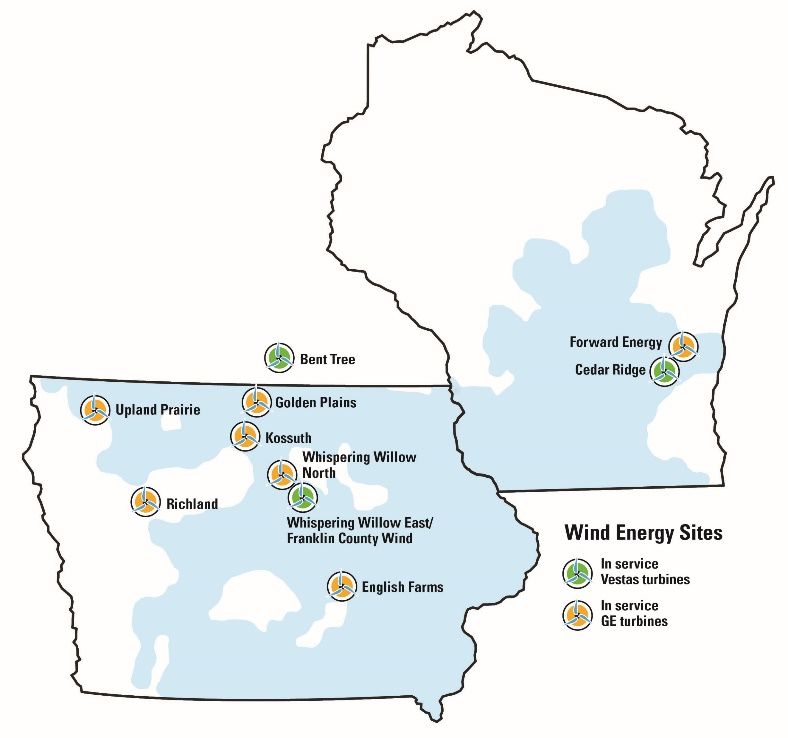
Safe harbor

This presentation contains statements that may be considered forward looking statements, such as
capital expenditures, earnings growth, rate base, and new generation plans. These statements speak
of the Company’s plans, goals, beliefs, or expectations, refer to estimates or use similar terms. Actual
results could differ materially, because the realization of those results is subject to many uncertainties
including regulatory approvals and results, unanticipated construction costs or delays, economic
conditions in our service territories, and other factors, some of which are discussed in more detail in
the Company’s Form 10-K for the year ended December 31, 2020. All forward looking statements
included in this presentation are based upon information presently available and the Company
assumes no obligation to update any forward-looking statements.

In addition, this presentation contains non-GAAP financial measures. The reconciliations between
the non-GAAP and GAAP measures are provided in this presentation.

                                                                                                1
Table of contents

•   Non-GAAP Temperature Normalized EPS 2017-2021
•   2020 GAAP Earnings to Midpoint of 2021 Earnings Guidance Walk
•   Wind Generation Investments
•   Solar Generation Investments
•   Projected Rate Base for 2020-2024 (IPL and WPL)
•   13-Month Average Forecasted CWIP Balances and projected AFUDC rates 2020-2024 (IPL and WPL)
•   Capital Expenditures 2021-2024
•   Regulatory Framework for IPL and WPL
•   IPL Retail Electric and Gas Rate Review Settlements 2020
•   DAEC PPA Amendment
•   WPL Retail Electric and Gas Stabilization Plan test year 2021
•   Rate Base, Common Equity and ROE in current rates
•   Credit Ratings
•   2020 Sales Mix and Sources of Energy Mix
•   American Transmission Company (ATC) Holdings
•   Non-Utility Operations

                                                                                                  2
Earnings per Share Growth

       $2.80
                                                                                                                                                  6% increase
                                                                                                                                                                                  $2.57
       $2.60                                                                                                   7% increase
                                                                                                                                              $2.42
       $2.40                                                              7% increase
                                                                                                          $2.26
       $2.20                         6% increase                      $2.11
                                  $1.99
       $2.00
       $1.80
       $1.60
       $1.40
                                2017 (a)                            2018 (b)                            2019 (c)                           2020 (d)                            2021 (e)
(a) 2017 GAAP EPS from continuing operations was $1.99. Non-GAAP EPS adjustments were ($0.06) for temperature impacts, $0.08 related to Federal Tax Reform and
    ($0.02) for net write-down of regulatory assets due to IPL electric rate review settlement.
(b) 2018 GAAP EPS from continuing operations was $2.19. Non-GAAP EPS adjustments were $0.06 for net temperature impacts and $0.02 related to Federal Tax Reform.
(c) 2019 GAAP EPS from continuing operations was $2.33. Non-GAAP EPS adjustments were $0.05 for net temperature impacts and $0.02 for American Transmission Company (ATC) Holdings return
     on equity reserve adjustments.
(d) 2020 GAAP EPS from continuing operations was $2.47. Non-GAAP EPS adjustments were $0.02 for tax valuation allowance adjustment, $0.02 for credit loss adjustments on guarantee for affiliate of Whiting
     Petroleum and $0.01 for net temperature impacts.
(e) 2021 midpoint of EPS guidance range

                                                                                                                                                                                   3
2020 GAAP Earnings to Midpoint of 2021
                        Earnings Guidance Walk

2020 GAAP EPS from continuing operations                                           $2.47
Net temperature impact on retail electric and gas sales                   (0.01)
Credit loss adjustments on guarantee for affiliate of Whiting Petroleum   (0.02)
Tax valuation allowance adjustment                                        (0.02)
2020 Non‐GAAP temperature normalized EPS from continuing operations                2.42
Higher revenue requirements primarily due to increasing rate base         0.31
Higher depreciation expense                                               (0.15)
Lower allowance for funds used during construction                        (0.08)
Other                                                                     0.07
2021 Forecasted EPS Midpoint                                                       $2.57

                                                                                   4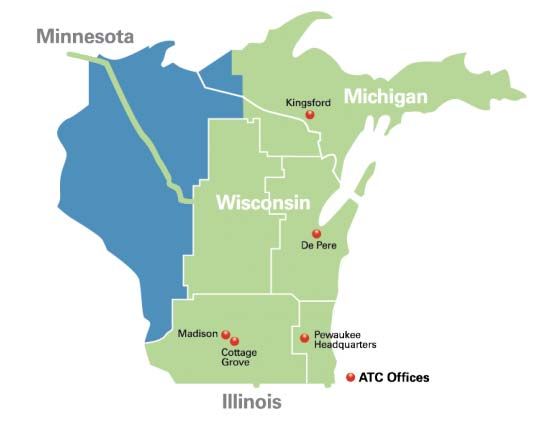
Wind generation investments
Third largest owner operator of regulated wind in the US
                                                                                                                            Over
                                                                                                                          1,700 MW

             2008           2009            2011            2012                2018         2019            2020
  Project*                                         Owner           Size (MW)              NCF **            In-service
  Cedar Ridge                                       WPL              68 MW                 32%                     2008

                                                                     59 MW
  Forward Energy                                    WPL                                    27%                     2008
                                                                     (of 129)

  Whispering Willow East                                                                                           2009
                                                    IPL             299 MW                 30%
  Franklin County                                                                                                  2012

  Bent Tree                                         WPL             201 MW                 31%                     2011

  Upland Prairie                                    IPL             299 MW                 40%                     2019

  English Farms                                     IPL             172 MW                 42%                     2019

  Whispering Willow North                           IPL             201 MW                 41%                     2020

  Golden Plains                                     IPL             200 MW             46% - 48%***                2020

  Richland                                          IPL             131 MW             44% - 46%***                2020

  Kossuth                                           WPL             152 MW             45% - 47%***                2020

  *All projects have received regulatory approval       **NCF = Net Capacity Factor for 2020 for developed sites
  ***Estimates. Placed in-service in 2020, thus do not have 12 months of data yet

                                                                                                                                     5
Growing solar generation investments
Adding approximately 1.5 GW of solar by end of 2023

                                                                IPL Solar                            WPL solar
                       Regulatory approval                  Expect to file advance      Decision expected Q2 2021 for 675 MW
                                                            ratemaking principles      certificate of authority (CA) (6680-CE-182).
                                                                 Q2 2021.               Decision expected 1H 2022 for 414 MW
                                                                                                    CA (6680-CE-183).
                       Investments in capital                   ~$540 million                        ~$1,260 million
                       expenditure plan
                       Forecasted tax equity proceeds           ~$205 million                         ~$485 million
                       Commercial operation timing            400 MW in 2023               425 MW in 2022, 664 MW in 2023

                       Investment tax credits (ITC)         26% ITC qualification                 30% ITC qualification

                       Tax equity accounting                      Partnership flip structure. Treated like regular rate base.

                       Initial accredited capacity factor          50% of the maximum alternating current (AC) capacity
                       Expected depreciable life                                          30 years

                                                                                                            6
Projected 13-month average IPL rate base for 2020-2024(a)
$9,000 $8.1B
$8,000 $7.3B $7.3B $7.5B
$6.8B
(in millions)
$7,000
$6,000
$5,000
$4,000
$3,000
$2,000
$1,000
$-
2020 2021 2022 2023 2024
Solar $- $- $- $40 $330
Renewable Energy Rider $1,317 $1,580 $1,590 $1,605 $1,620
Marshalltown $559 $520 $485 $475 $450
Whispering Willow East $163 $155 $150 $145 $135
Emery $165 $140 $125 $110 $90
SERVCO (b) $120 $130 $135 $135 $140
Electric Wholesale (c) $145 $170 $165 $170 $185
Gas $557 $555 $560 $565 $590
Electric Retail other $3,767 $4,040 $4,095 $4,225 $4,605
(a) CWIP is not included in rate base; 2020-2024 excess deferred taxes due to Federal Tax Reform receive equivalent of rate base treatment
(b) Alliant Energy Corporate Services (SERVCO) assets not reflected in rate base for IPL retail or wholesale rates, but rather return on and of SERVCO assets are reflected in revenue requirement
(c) Federal Energy Regulatory Commission (FERC) formula rates based on a two-point average (beginning and end of year)
7Projected 13-month average WPL rate base for 2020-2024(a)
$6,000 $5.8B(c)
$5.4B(c)
$5.1B
$5,000 $4.8B(b)
$4.3B(b)
(in millions)
$4,000
$3,000
$2,000
$1,000
$-
2020 2021 2022 2023 2024
SERVCO (d) $100 $110 $115 $115 $115
Gas $340 $461 $465 $480 $490
Electric Wholesale (e) $296 $320 $335 $360 $360
Electric Retail $3,555 $3,954 $4,160 $4,450 $4,795
a) CWIP is not included in rate base
b) 2020 and 2021 rate base amounts will not tie to rate base per PSCW rate decision. Excess deferred income taxes are included.
c) 2023 and 2024 rate base adjusted under the assumption that WPS and MGE exercise their options on West Riverside ownership
d) SERVCO assets not reflected in rate base, but rather return on and of SERVCO assets are reflected in revenue requirement
e) FERC formula rates based on a two-point average (beginning and end of year)
8Earning AFUDC on investments under construction
13-month average forecasted CWIP balances
Projected AFUDC rates for 2021 IPL ~7.5% WPL ~7.0%
$1,400
$1,265
$1,200
$955 $990
$1,000
(in millions)
$800
$645
$600
$455
$400
$200
$0
2020 2021 2022 2023 2024
WPL $595 $325 $725 $775 $375
IPL $360 $130 $265 $490 $270
CWIP balances include AFUDC eligible CWIP and, in the case of WPL, portions of CWIP that earn a current return in rate-making processes (typically 50% of CWIP).
For IPL, CWIP amounts are not included in rate base.
9Planned Capital Expenditures (excluding CWIP)
$1,625(b) $1,605(b)
$1,500
$1,370
$1,295(a)
$1,300
$1,100
$900
in millions
$700
$500
$300
$100
($100)
2021 2022 2023 2024
Renewables 485 750 635 320
Other Generation 90 180 175 90
Gas Distribution 70 75 70 70
Electric Distribution 470 435 535 695
Other 180 185 190 195
(a) We have received regulatory approval to earn a return on and of the $110 million DAEC PPA Termination payment beginning in 2021. This
payment is not part of the capital expenditure plan shown above.
(b) Anticipate receiving tax equity funding of approximately $210 million in 2022 and $480 million in 2023. This funding will be an offset to
capital expenditures and reduce rate base.
10IPL Planned Capital Expenditures (excluding CWIP)
$680 $735(a)
$700
$600 $535
$500
In Millions
$400 $375
$300
$200
$100
$0
2021 2022 2023 2024
Renewables $45 $270 $270 $50
Other Generation $45 $135 $135 $55
Gas Distribution $35 $40 $30 $30
Electric Distribution $240 $225 $290 $375
Other $10 $10 $10 $25
(a) Anticipate receiving tax equity funding of approximately $205 million in 2023. This funding will be an offset to capital expenditures and reduce rate base.
11WPL Planned Capital Expenditures (excluding CWIP)
$765 $780(a)
$800
$700(a) $675
$700
$600
In Millions
$500
$400
$300
$200
$100
$0
2021 2022 2023 2024
Renewables $440 $480 $365 $270
Other Generation $45 $45 $40 $35
Gas Distribution $35 $35 $40 $40
Electric Distribution $230 $210 $245 $320
Other $15 $10 $10 $10
(a) Anticipate receiving tax equity funding of approximately $210 million in 2022 and $275 million in 2023. This funding will be an
offset to capital expenditures and reduce rate base.
12Constructive regulatory framework
IPL WPL
Revenues and expenses recovered under “Riders”
Iowa retail Wisconsin retail
Renewable Energy Rider (RPU I and RPU II)(a)
Electric production fuel and energy purchases (WPL includes emission
allowances and chemicals to reduce emissions; IPL only includes emission allowances)
+ 2%
Transmission service(b)
Energy efficiency(b)
Cost of gas
Pension(b)
Bad debt(b)
% of 2020 utility operating expenses flowing through riders ~50% ~55%
Test year Optional for either a forward looking Two-year forward
or historical looking
Authorized ROEs ~10% 10%
Authorized Common Equity Ratio 51% 52% - 53%
Large construction projects Advance ratemaking for generation Pre-approval
(a) Includes forecasted return of and on (ROE 11%) for 1,000 MW of wind, return on production tax credit (PTC) carryforward balance (ROE 5%), PTC and capacity value benefits; excludes
operation and maintenance (O&M) expenses and energy margins. O&M will be recovered in base rates and energy margins will be recovered in the fuel cost rider.
(b) Escrow accounting for WPL
13IPL retail electric and gas rates for test period 2020
(RPU-2019-0001 and RPU-2019-0002)
• Retail electric revenue requirement increase of $127 million
• Billing credits for electric retail customers of approximately $35 million
• Approximately $27 million resulting from the use of the unprotected excess deferred income tax benefits
• Approximately $8 million in credits from a partial refund of interim rates implemented in 2019
• Renewable Energy Rider for wind facilities constructed as part of New Wind 1 (RPU-2016-0005) and New Wind II (RPU-2017-0002)
• Continuation of current depreciation rates
• Retail gas revenue requirement increase of $12 million
• Written gas and electric orders issued December 18, 2019 and January 8, 2020, respectively.
($ in millions) Electric Gas
Rate base(a) Return on equity Rate Base Return on equity
Emery $165 12.23% -- --
Whispering Willow East $163 11.70% -- --
Marshalltown Generating Station $559 11.00% -- --
Renewable Energy Rider $1,317 10.66%(a) -- --
Other retail rate base $3,767 9.50% $557 9.60%
Common equity component of regulatory capital structure 51.0% 51.0%
(a) Blended ROE for Renewable Rider eligible investments pursuant to settlement agreement filed with the Iowa Utilities Board in
Docket RPU-2019-0001
14DAEC PPA amendment (SPU-2018-0008)
• Replacing Iowa nuclear energy with additive Iowa wind energy.
• Significant customer cost reductions as a result of this agreement including nearly $300 million in
energy cost savings, or a 2% to 3% reduction in a customer’s bill, depending on customer class,
starting in Fall of 2020.
• IPL’s purchase power agreement (PPA) with NextEra Energy Duane Arnold, LLC for energy and
capacity from DAEC terminated October 1, 2020, five years earlier than initial expiration.
• One-time payment to buyout current PPA in the amount of $110 million in September 2020. The IUB
approved recovery of the buyout payment with IPL’s 2020 Test Period retail electric rate review, which
will be recovered from IPL’s retail customers over a 5-year period following the payment.
• Enter into 20-year wind repower PPAs ~340 MW commencing in 2020 and 2021.
15WPL retail electric and gas stabilization plan for test period 2021
(6680-UR-122)
• Maintain 2020 base rates through 2021 for Wisconsin customers
• Retail electric revenue requirement increase of $32 million, offset by $18 million excess deferred income tax benefits (EDIT) and $14
million lower fuel-related costs
• Retail gas revenue requirement increase of $15 million, offset by $6 million EDIT benefits and $9 million estimated deferral
• Written gas and electric order issued December 23, 2020
($ in millions) 2021
Electric Gas
Retail Rate Base $3,954(a) $461(a)
Return on common equity (ROE) 10.0%
Common equity component of regulatory capital structure 52.5%
ROE sharing mechanism
10.0% - 10.25% No sharing
10.25% - 10.75% 50/50 sharing
>10.75% 100% customer
Escrow treatment for bad debt expense and pension and other postretirement benefits expense
(a) Average rate base amounts are lower than those stated in the 2021 Test Year Stabilization Plan decision due to impacts of accounting and rate making
treatment of excess deferred tax balances authorized by the PSCW. The net impact on revenue requirements from the higher rate base amounts and lower
adjusted cost of capital amounts in the order versus this presentation is not material.
16Rate base, common equity percentage and return on equity
Rate base Common Authorized
$’s in millions equity % ROE Effective Date
IPL (Iowa)
Emery Generating Station $165 51.0% 12.23% 2/26/2020
Whispering Willow East(a) $163 51.0% 11.70% 2/26/2020
Marshalltown Generating Station $559 51.0% 11.00% 2/26/2020
Renewable energy rider $1,317 51.0% 10.66%(c) 2/26/2020
All Other Retail Electric Service $3,767 51.0% 9.50% 2/26/2020
Gas Service $557 51.0% 9.60% 1/10/2020
WPL (Wisconsin)
Retail Electric Service $3,954(b) 52.5% 10.00% 1/1/2021
Gas Service $461(b) 52.5% 10.00% 1/1/2021
FERC
WPL Wholesale $296 55.0% 10.90% 1/1/2020
IPL Wholesale $145 50.0% 10.97% 1/1/2020
(a) Excludes $18 million for Whispering Willow East that is not earning a return
(b) Average rate base amounts are lower than those stated in the 2021 Test Year Stabilization Plan decision due to impacts of accounting and rate making treatment of excess deferred
tax balances authorized by the PSCW. The net impact on revenue requirements from the higher rate base amounts and lower adjusted cost of capital amounts in the order versus
this presentation is not material.
(c) Blended ROE for Renewable Rider eligible investments pursuant to settlement agreement filed with the Iowa Utilities Board in Docket RPU-2019-0001
17Credit ratings
Credit ratings Moody’s S&P
AEC – Corporate/issuer Baa2 (Stable) A- (Stable)
AEC – Commercial Paper P-2 A-2
IPL – Unsecured long-term debt Baa1 (Stable) A- (Stable)
IPL – Commercial Paper P-2 A-2
WPL – Unsecured long-term debt A3 (Stable) A (Stable)
WPL – Commercial Paper P-2 A-1
18IPL operating information
(Calendar year 2020)
Bulk Power Sources of energy
16% Residential
21%
Wholesale Coal
4% 18% Gas
30%
Electric
sales Wind(a)
22%
Commercial PPA-Nuclear
22% 14%
Industrial PPA-Wind(a)
37% 14%
PPA-Other(a)
2%
(a) All or some of the renewable energy attributes associated with
generation from these sources may be used in future years to comply with
renewable energy standards or other regulatory requirements.
19WPL operating information
(Calendar year 2020)
Bulk Power and
Other
Sources of energy
6% Hydro 2%
Wholesale
13% Residential
28%
Coal
28% Gas
Electric 38%
sales
Wind(a) 7% Market
Commercial Purchases(a)
Industrial 17% 15%
36% PPA-Wind(a)
10%
(a) All or some of the renewable energy attributes associated with generation
from these sources may be used in future years to comply with renewable
energy standards or other regulatory requirements.
20ATC equity investment
ATC LLC’s Midwest Operations (16% equity ownership interest):
• 2020 equity income $47 million
• Projected capital expenditures of $2.9 to $3.5 billion over 10 years from 2020-2029
ATC Midwest Operations
Projected Capital Expenditures
(in millions)
$500
$400
$300
$200
$100
$-
2020 2021 2022 2023 2024
• Rate Base: 2020 13-month average rate base approx. $4.1 billion
• Authorized ROE 10.52%
‒ Base ROE decision of 10.02% in May 2020. Petitioners in the complaint proceedings
have filed a petition to the D.C. Circuit Court to review FERC’s MISO ROE orders.
• Capital structure: Hypothetical 50% equity component
• Annual true-up mechanism for revenue requirement
• Current return on CWIP
21Non-utility operations
Travero Sheboygan Falls
Great Western Wind
• CRANDIC (Cedar Rapids and Iowa City Railway)
• In eastern Iowa for over 110 years
• Serves the largest shippers • 347 MW gas peaking facility
• Supports economic development in Cedar Rapids
area
• Commissioned in June 2005
• Barge terminal and hauling services on the • 20 year lease, with option for two
Mississippi River
• 50% of a cash equity ownership interest lease renewal periods, with WPL
• Customized supply chain solution capabilities
• 225 MW Oklahoma wind project
• Freight and logistics brokering services
• 15-year PPA with Google
• Other transfer and storage services
• Commissioned in December 2016
22You can also read