Lupus Capital plc Interim Results Presentation Six months ended 30 June 2012 - Tyman plc
←
→
Page content transcription
If your browser does not render page correctly, please read the page content below
Lupus Capital plc Interim Results Presentation Six months ended 30 June 2012
Agenda
    > Overview

    > Corporate Activity – Transforming our UK Business

    > H1 2012 Financial Review

    > H1 2012 Operating Review

    > Outlook

    > Appendices

1
OVERVIEW

2
Overview
Operational                                     Corporate
> Continued growth in North America offset in   > Exit from loss-making Composite Doors
  part by weakness in Europe
                                                > £14m acquisition of Fab & Fix
> Continued focus on self help measures
                                                > Composite Doors exit and Fab & Fix together
  and business improvement
                                                  transform grouphomesafe
> Increase in capital investment to make full
                                                > Disposal of Gall Thomson
  use of improved balance sheet
                                                > US acquisition of Unique Balance
> Resumption of interim dividend payments
                                                > Exit from Peterlee properties

         Acquisition of Fab & Fix combined with exit from Composite Doors
                      transforms UK business and profitability

3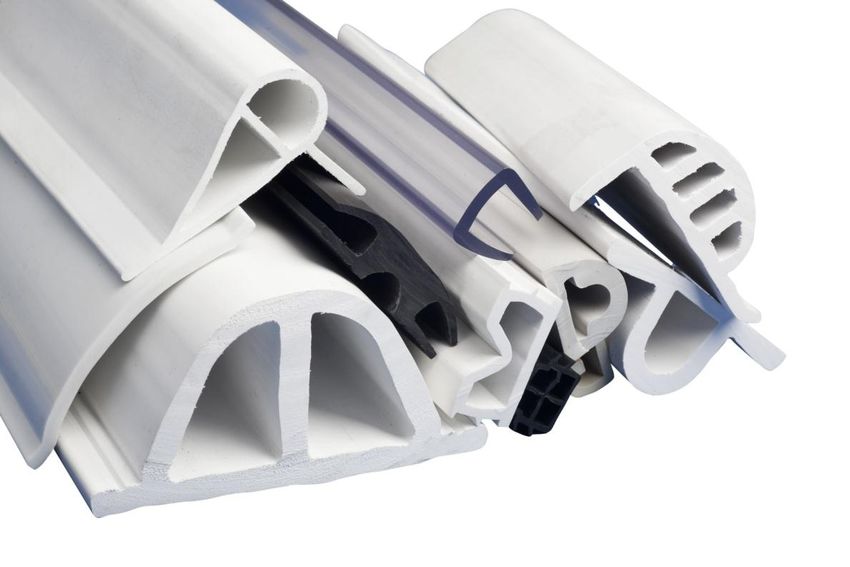
Corporate Activity

    TRANSFORMING OUR UK BUSINESS

4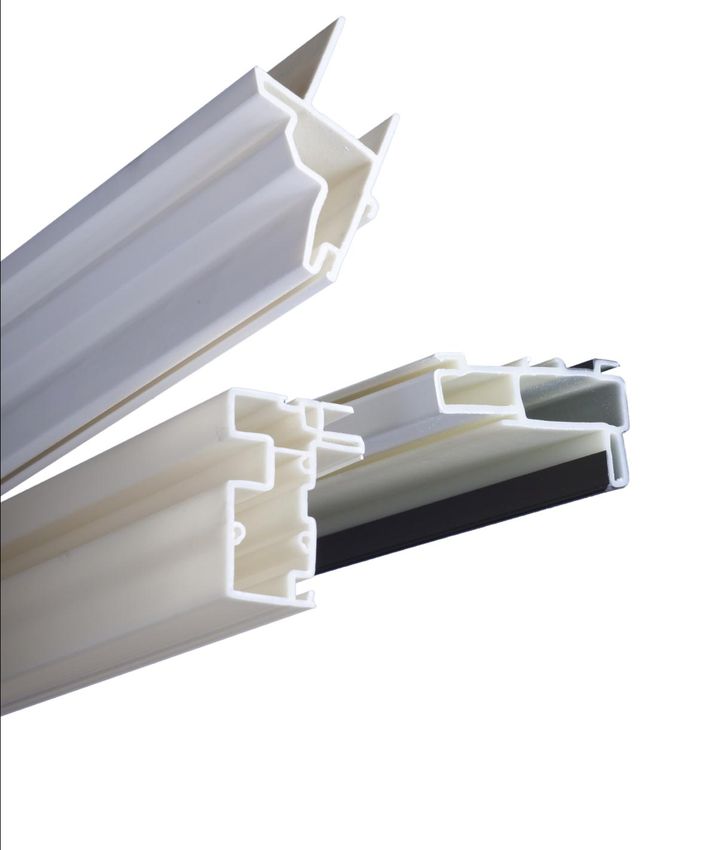
Corporate Activity Overview
               > Focused supplier of components to the door and window industry
    Strategy
               > Strengthened balance sheet provides flexibility for acquisitions

               > Disposal of Gall Thomson
    Mar ‘12
               > Sold to Phoenix Private Equity

               > Acquisition of Unique Balance International
    Apr ‘12
               > Exit Montreal site to US and UK facilities by end Q1 2013

               > c. £14 million acquisition of Fab & Fix
    Aug ‘12
               > Supplier of perfectly matching (“suited”) hardware to UK Market

               > Exit from loss making Composite Doors business
    Sep ‘12
               > Sold for c. £0.7 million to an industry turnaround specialist

5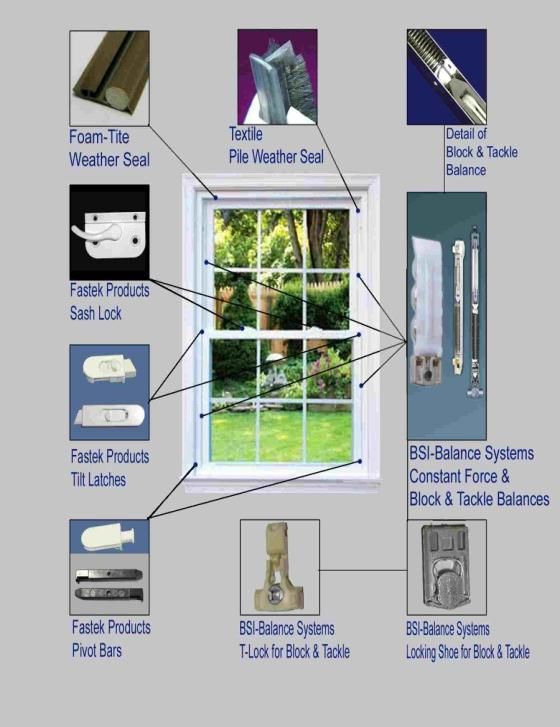
Corporate Activity – Fab & Fix
Overview
> Leading supplier of perfectly matching
  (“suited”) hardware to UK Door and Window
  Industry
> Design-led business with a focus on total
  quality and customer service
> Despite adverse market conditions, in recent
  years has grown share and increased
  profitability
> Diversifies the GHS supply chain and
  broadens our hardware offering
> Know the business well and an excellent fit
> Provides an enhanced platform for hardware
  growth
> www.fabnfix.co.uk
Financials
> y/e 31 March 2012 Revenues of £14.7 million
> Enterprise valuation of c. £14 million
6
Corporate Activity – Composite Doors
Overview                                          Key Terms and Conditions
> Consistently loss-making over past three        > Acquiror is an industry turnaround specialist
  financial years                                 > Backed by GE Capital and Centric
> Little prospect of generating an acceptable       Commercial Finance
  return to the Group in the near term            > Secured ongoing supply of component
> Perceived conflict of interest in the             products (including Fab&Fix) on normal
  marketplace                                       commercial terms post-completion
> Strategic review performed in H1 2012 which     > Ordinary course liabilities transfer at
  led to a targeted sales process                   completion to the purchaser
                                                  > Lupus retains obligations in respect of
                                                    historic warranty claims
Financials
> Consideration of c. £0.7 million
> 2012 tangible asset write down on disposal of
  c. £3.0 million

7
Transforming our UK business
2011 Pro forma impact on grouphomesafe
£’million FY 2011 Pro Forma Impact
Revenues 89.0 89.2 0.2%
Operating Profit 7.3 10.4 42.8%
Operating Margin 8.2% 11.7% 3.5 ppts
Notes:
Pro-forma assumes Fab & Fix acquisition and Composite Doors exit completed on 31 December 2010 and uses actual 2011 performance data for
grouphomesafe, Composite Doors and Fab & Fix together with an estimate for head office cost reallocation
This pro-forma analysis is not a forecast of future profitability for the UK business nor should it be interpreted to mean that earnings per share for
the current or future financial years for the Lupus Group, will necessarily match or exceed historical earnings per share
> Historically UK business has been lower margin than US and International businesses
> Exit from Composite Doors removes a long term drag on UK profitability
> Fab & Fix offers well sourced high quality hardware product that commands respect in
the market
8
H1 2012 FINANCIAL REVIEW

9
H1 2012 Financial Highlights

 Revenues                                Underlying            Underlying              Underlying
                                         Trading Profit *      Net Debt                Trading EPS *
 £118.4m                                 £9.8m                 £34.2m                  4.02p
 2011: £114.6m (+3.3%)                   2011: £9.6m (+2.0%)   2011: £94.6m (-63.8%)   2011: 3.48p (+15.5%)

 Underlying                              Operating Cash        Leverage                Interim Dividend
 Operating Profit                        Conversion *                                  per share
 £11.9m                                  3.9%                  1.10x                   1.00p
 2011: £9.6m (+23.0%)                    2011: 14.4%           2011: 2.52x             2011: Nil

Percentage movements on a constant currency basis
* Before Peterlee property provision releases

10
H1 2011–2012 Revenue Bridge
£m
120
3.1
115 0.5 0.2 0.0
110
118.4
114.6
105
100
H1 2011 Exchg Rate Sell Price Volume Acquisitions H1 2012
11H1 2011–2012 Trading EBITA Bridge
£m
12
10 0.3
0.2 (0.6)
(0.2) 0.3 (0.3) 0.5
8 9.8
9.6
6
H1 2011 Sell Price Mat Cost Oth Infl Volume Utilisation Other Acquisitions H1 2012
12Cash Conversion - continuing operations
£’million H1 2012 H1 2011 LTM 2012 FY 2011
Net Cash Inflow from Operating Activities (56) 2,176 18,710 20,942
Income Tax Paid 3,262 866 4,605 2,209
Net Tangible Asset Capital Expenditure (2,823) (1,653) (5,417) (4,247)
Operating Cashflow Post Capital Expenditure 383 1,389 17,898 18,904
Underlying Trading Profit 9,830 9,638 21,370 21,178
Trading Cash Conversion 3.9% 14.4% 83.8% 89.3%
Intangibles, Net Interest and Tax (6,234) (4,391) (11,232) (9,389)
Free Cashflow * (5,851) (3,002) 6,666 9,515
* before Acquisitions, Debt Repayments and Refinancing Costs
> Increased capital expenditure investment in the business starting to come through
> Tangible Asset Capex: Depreciation 1.09x
> Tangible + Intangible Asset Capex: Depreciation 1.40x
13Working Capital – continuing operations
£’million H1 2012 LTM 2012 FY 2011
Trade Working Capital Days 58.2 56.2 47.6
FY 2011: £30.0m
Trade Working Capital £37.3m £37.2m £30.0m
FY 2010: £31.6m
Working Trade Working Capital: Sales 15.9% 15.4% 13.0%
Capital Unwinds Full Year Inventory Build
Total Working Capital £27.0m £24.8m £20.0m
Total Working Capital: Sales 11.5% 10.2% 8.7%
> Trade working capital flat year on year
Half Year
Peak Trading Net Receivables despite acquisitions of Overland and Unique
Months Build
HY 2012: £37.3m > Improved inventory management performance
HY 2011: £37.2m in the US in 2012
> Working capital expansion in the first half and
1st Qtr 2nd Qtr Jul–Oct Nov–Dec overall metrics in line with expectations
14Debt, Interest and Taxation Debt > Gross debt at the half year £82.7 million (2011: £119.9 million) > Net debt at half year £34.2 million (2011: £94.6 million) > Leverage at half year 1.10x (2011: 2.52x) Interest Charge > Interest charge payable materially lower due to disposal of Gall Thomson and refinancing Taxation > Underlying tax rate of 30.0 per cent. (2011: 31.5 per cent.) > Full level of taxation payments made on account as available tax losses have reduced 15
2012 Financial Trends
Debt
> Net debt position will be impacted by Fab & Fix
> Year end net debt expected to be £35 - £40 million
> December 2012 debt repayment of c. £8m
Interest Charges
> Group’s blended cost of funds c. 100bp until March 2016
> Margin remains at 200bp provided leverage stays below 1.50x Net Debt: Adjusted EBITDA
Capex - Full year capital expenditure (tangible and intangible) now expected to be c. £6m
Taxation Rate – 30.0 per cent. for the year
Dividend
> 1p per share; c. £1.3 million - payable on 25 October 2012
> Final not less than 3p per share – payable post 2013 AGM
LTIP - purchases of up to £1.5 million
Second half weighting to Sales and Trading profitability
16
H1 2012 OPERATING REVIEW

17
H1 2012 Revenues – US led growth
 H1 2012 Revenues by Region                              H1 2011 and 2012 Revenues

                                                         £m

                                                                     58.5
                                                         60
                          15%
                                                              52.3
                                                                             44.8     42.6
                                                         40
                                              49%

                  36%                                    20                                        18.1   17.2

                                                          0
                                                                US BP            UK BP         International BP
                 US BP       UK BP    International BP                      H1 2011      H1 2012

Revenues at Constant Exchange Rates

18
H1 2012 Operating Profit – US led growth
H1 2012 Operating Profit by Region H1 2011 and 2012 Operating Profit
£m
7.5
13%
5.9
5.0 4.8
27% 3.2
60% 2.6
2.5
1.7
1.3
0.0
US BP UK BP International BP
US BP UK BP International BP H1 2011 H1 2012
Operating Profit at Constant Exchange Rates
19Optimising our Geographic Footprint
> New extrusion facility opened
in Atlanta, Georgia
> Fab & Fix distribution centre
acquired in Coventry Montreal
> Unique facility acquired in Coventry
Montreal
> Reviewing footprint of
European businesses
> Two sites at Bromyard and
Newent exited following disposal
of composite doors division
Opportunity to enhance performance through investment in key markets, and
ongoing site consolidation and rationalisation
20Amesbury
Revenues Markets
£m 60.0
> US New Build Starts c.8% in first six months
40.0 although skewed towards multi-family
52.3 58.5 > Relatively low price inflation in year to date
50.9
20.0
> Milder weather in Q1 helped industry off to a
0.0 good start
H1 2011 H1 2011 @ '12 FX H1 2012
Financials
> Revenues increased by 6.0%* and by 12.0% once
Operating Profit and Margins North American acquisitions are included
> Underlying margins improved to 10.1% from
£m 6.0 10.1% 12%
9.7% 9.2% 9.2%
4.0 8% > Underlying EBITA 13.2%* higher than H1 2011
4.8
5.9 Highlights
4.7
2.0 4%
> Overland Products now integrated
0.0 0% > Unique Montreal site move commenced
H1 2011 H1 2011 @ '12 FX H1 2012
* On a constant currency, like for like basis > Strong performance from sealing businesses
> Atlanta facility now fully operational
21Grouphomesafe
Revenues Markets
£m
40 > OEM sector remains difficult with consumers
reluctant to commit to large scale improvements
20 44.8 44.8 42.6 > Lower commodity cost pressures in H1 2012
> Social Housing contraction continues
0
H1 2011 H1 2011 @ '12FX H1 2012
Financials
> Revenues decreased by 4.8%
> Decline in Underlying Operating margins to 6.2%
Operating Profit and Margins > Underlying Operating Profit 17.0% lower than
2011 – Composite Doors loss c. £1.1 million
£m 4.0 7.1% 7.1% 8%
6.2% Highlights
3.0 6%
> New management team and structure in place
2.0 4%
3.2 3.2
2.6 > Portfolio businesses continue to perform well
1.0 2%
> Fab & Fix acquisition and Composite Doors exit
0.0 0% transforms UK business and profitability
H1 2011 H1 2011 @'12 FX H1 2012
22Schlegel International
Revenues
Markets
£m 20
> Southern European markets remain very depressed
15 and Scandinavian markets have contracted
10
> Eastern European markets holding up
18.9 18.1 17.2
> Australasian markets continue to be slow
5
Financials
0
H1 2011 H1 2011 @ '12 FX H1 2012 > Revenues decreased by 5%*
> Underlying margins decreased to 7.4%
Operating Profit and Margins > Underlying EBITA 25%* lower than 2011 due to
product mix and effects of operational gearing
£m3.0 12%
9.4% 9.4%
Highlights
7.4%
2.0 8% > New management team and structure in place
1.8
1.7 > New hires in Singapore and Brazil
1.0 1.3 4%
> Australasia businesses outperforming difficult
0.0 0% markets
H1 2011 H1 2011 @ '12 FX H1 2012
* On a constant currency, like for like basis > Fab & Fix offers particular hardware opportunities
for Schlegel International
23OUTLOOK 24
2012 Trading and Outlook
2012 Trading
> Trading environment in North America has been encouraging and we expect Amesbury will
  trade satisfactorily across the balance of the year
> Acquisition of Fab & Fix gives the Group a significant opportunity to enhance its UK hardware
  offering and to continue to take market share
> European markets will continue to remain difficult however other international businesses
  expect to demonstrate good growth and take share
2012 Outlook
> Trading to date has been in line with expectations and early H2 trading patterns remain
  consistent with H1
> Group will benefit from c. four months contribution from Fab&Fix and exit from composite
  doors which should more than offset any further deterioration in European markets
> Board confident in outlook for the year; performance remains in line with expectations
> Underpinned by interim dividend of 1.00p per share and commitment to a total full year
  dividend of not less than 4.00p

25
APPENDIX A
     LUPUS CAPITAL PLC BUSINESSES

26
H1 2012 Revenues by Product and Division
Total Lupus Group US UK
£2.1m
£8.9m £6.5m
£3.7m £12.5m
£6.5m
£30.7m £4.4m £0.3m £17.1m
£11.6m
£10.5m £14.7m £10.5m
£18.0m
£2.6m
£1.8m
£1.7m
£13.4m
£22.3m
£19.7m
International
£1.5m £1.1m
0
£2.4m
£5.0m
Hardware Foam Sealing Balances
Pile Sealing Reinforcer Extrusions
0
Composite Other
£7.2m
Doors
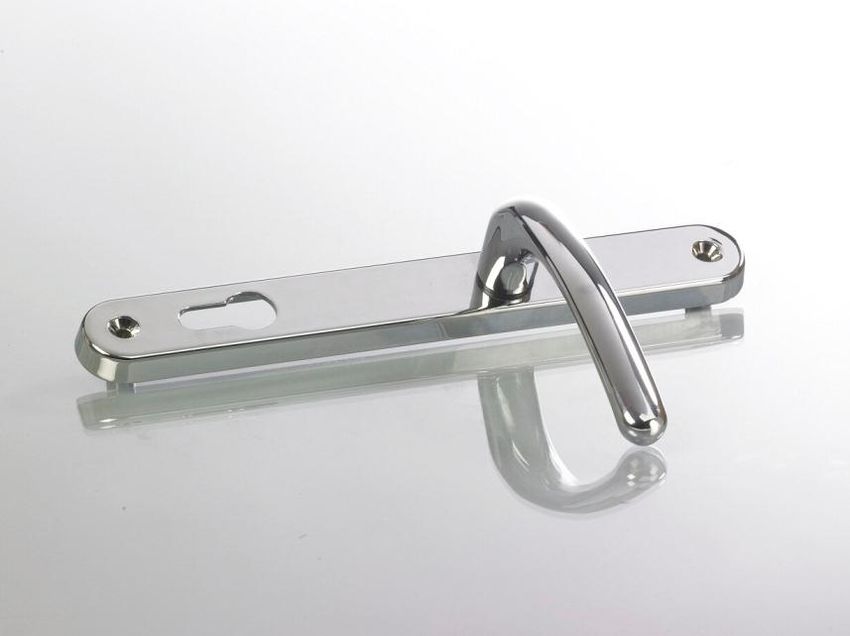
27Building Products Division – Product Range
Seals and Hardware and Components
Window and Door Hardware Extruded Products
Copier Brush
28APPENDIX B
OTHER FINANCIAL INFORMATION
29Summary Profit and Loss Account £'000 H1 2012 H1 2011 FY 2011 Revenue 118,377 114,571 230,372 Underlying Trading Profit 9,830 9,638 21,178 Property provision release 2,021 - 1,221 Underlying Operating Profit 11,851 9,638 22,399 Exceptional items (420) (603) (830) Amortisation of intangible assets (5,197) (5,737) (10,565) Operating profit 6,234 3,298 11,004 Net finance costs (2,751) (4,379) (9,695) Profit/(loss) before taxation 3,483 (1,081) 1,309 Income tax (expense)/credit (541) 534 6,775 Profit/(loss) for the period from continuing operations 2,942 (547) 8,084 Profit for the period from discontinued operations 54,972 4,348 7,399 Profit for the period 57,914 3,801 15,483 30
Balance Sheet
£'000                           H1 2012 H1 2011 FY 2011         £'000                            H1 2012 H1 2011 FY 2011
Non-current assets                                              Current liabilities
Goodwill                          212,356   219,782   213,866   Current tax payable                   (83)     (5,288)     (1,976)
Intangible assets                  93,794    96,925    99,047   Trade and other payables          (34,700)    (40,082)    (34,632)
Property, plant and equipment      30,717    29,919    30,461   Provisions                         (2,491)     (3,302)     (1,510)
Deferred tax assets                 8,857     7,289     9,618   Fin. instruments & borrowings      (7,448)     (6,630)    (13,707)
                                 345,724    353,915   352,992                                     (44,722)   (55,302)    (51,825)
Current assets                                                  Discontinued operations                  -           -     (3,271)
Inventories                        28,426    29,831    26,427                                     (44,722)   (55,302)    (55,096)
Trade and other receivables        33,297    39,455    28,200   Non-current liabilities
Cash and cash equivalents          48,510    25,302    20,426   Deferred tax liabilities          (17,324)    (20,966)    (18,941)
                                 110,233     94,588    75,053   Fin. instruments & borrowings     (73,215)   (112,832)   (100,235)
Discontinued operations                 -         -    21,114   Employee benefit liability         (9,420)     (6,753)     (9,732)
                                 110,233     94,588    96,167   Provisions and other creditors    (10,934)    (16,202)    (15,937)
Total assets                     455,957    448,503   449,159                                    (110,893) (156,753) (144,845)
Net assets                       300,342    236,448   249,218   Total liabilities                (155,615) (212,055) (199,941)

31
Covenant Performance
Interest
Covenant Leverage DSCR
Cover
Covenant Measure Less Than More Than More Than
Covenant 3.00x 4.50x 1.00x
Measure at 30 June 2012 1.10x 7.10x 3.97x
Headroom at 30 June 2012 63.3% 36.6% 74.8%
Covenant Definitions
Leverage Total net debt to Adjusted1 EBITDA
Interest Cover EBITDA to Net Finance Charges
Debt Service Cover Cashflow available for Debt Service to Debt Service
1 “Adjusted EBITDA” defined as “Underlying EBITDA of the Group plus pre-acquisition EBITDA of acquisitions during the period”
> All covenants tested on the basis of average exchange rates across the period and on frozen GAAP as at
2 September 2011
32You can also read