Textainer Group Holdings Ltd. Investor Presentation - August 2018
←
→
Page content transcription
If your browser does not render page correctly, please read the page content below
Textainer Group Holdings Ltd.
Investor Presentation
August 2018

                                1
Forward Looking Statements

Certain information included in this presentation and other statements or materials published or to be published by the Company are
not historical facts but are forward‐looking statements relating to such matters as anticipated financial performance, business
prospects, technological developments, new and existing products, expectations for market segment and growth, and similar matters.
In connection with the “safe harbor” provisions of the Private Securities Litigation Reform Act of 1995, the Company provides the
following cautionary remarks regarding important factors which, among others, could cause the Company’s actual results and
experience to differ materially from the anticipated results or other expectations expressed in the Company’s forward‐looking
statements. The risks and uncertainties that may affect the operations, performance, development, results of the Company’s business,
and the other matters referred to above include, but are not limited to: (i) changes in the business environment in which the Company
operates, including global GDP changes, the level of international trade, inflation and interest rates; (ii) changes in taxes, governmental
laws, and regulations; (iii) competitive product and pricing activity; (iv) difficulties of managing growth profitably; and (v) the loss of
one or more members of the Company’s management team.

 As required by SEC rules, we have provided a reconciliation of the non‐GAAP financial measures included in this presentation to the
 most directly comparable GAAP measures in materials on our website at www.textainer.com.

                                                                                                                                              2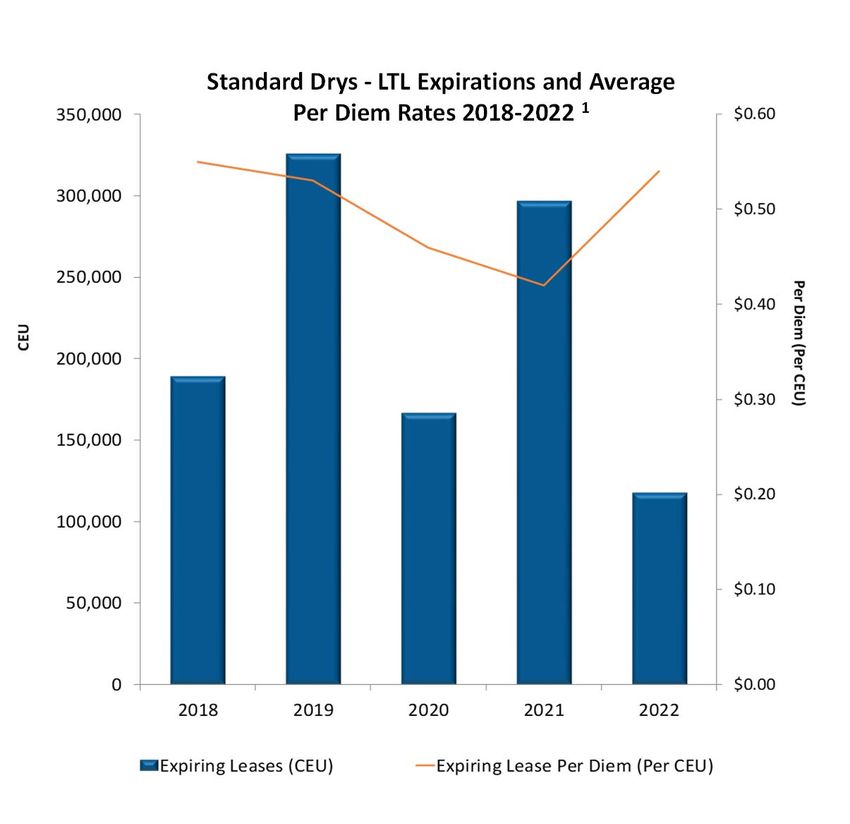
Fleet Overview
                                         Container Lessors 1                                                                                                         Fleet breakdown 2
             Triton                                                                                        5,650                                              4%
            Florens                                                             3,700
         Textainer                                                         3,354                                                                                                                               20' Standard
                                                                                                                                                              18%
             SeaCo                                           2,400                                                                                                                   30%                       40' Standard

           Beacon                             1,320                                                                                                                                                            40' High Cube
                 CAI                        1,220                                                                                                                                                              Refrigerated
                                                                                                                                                                                          6%
          SeaCube                          1,140                                                                                                                                                               Specialized
                                                                                                                                                                       43%
              Other                                     2,020

                        0          1,000          2,000         3,000         4,000         5,000         6,000
                                                         TEU (000’s)

        Lease Container Portfolio 3                                                 Owned vs Managed 3                                  100%                  Average Fleet Utilization 2
      100%                                                                100%                                                           99%
                                                                                                                                         98%
      80%                                                                   80%
                                                                                                                                         97%
      60%                                                                   60%                                                          96%
                                                                                                                                         95%
      40%                                             84%                   40%                                                          94%
                                                  Long Term                                                                              93%
      20%                                          + Finance                20%
                                                                                                                                         92%
       0%                                                                    0%

             Long Term          Finance        Short Term                                  Owned
                                                                                                Textainer
                                                                                                      Managed                                             Quarter average                  Average (periods presented)

                    Diversified fleet with high utilization and predominantly long‐term leases
(1)   Competitor data from World Cargo News Container Industry February 2018; Textainer fleet data updated as of most recent quarter end
(2)   Calculated based on CEU, as of June 2018. CEU refers to a Cost Equivalent Unit, a unit of measurement based on the approximate cost of a container relative to the cost of a standard 20’ dry freight container
(3)   Calculated based on TEU, as of June 2018. TEU refers to Twenty‐Foot Equivalent Unit, a unit of measurement based on the length of a container relative to a standard 20’ dry freight container                           3
Diversified Revenue Streams
“Go To” manager for third party owners
Manage 20% of our fleet for 12 third‐party owners
Taken over management of fleets totaling over
1,623,000 TEU since 1998
Tank container partnership with Trifleet
Investing in new tank containers managed by Trifleet
Leverages both companies’ experience and expertise
Trifleet is the world’s fourth largest tank lessor with
25 years of experience and a fleet of approximately Dedicated international container resale team
14,000 containers One of the largest sellers, averaging over 130,000
annual sales over the past 5 years
Industry grew more than 8% in 2017 (a)
Optimizes the residual value in multiple markets,
including locations with low lease‐out demand,
Sole provider of containers to US Military since 2003 selling used containers to a wide variety of buyers
Recipient of the National Defense Transportation Purchases and resells containers from shipping line
Association (NDTA) Quality Award in 2008 customers, container traders and other sellers of
Contract has been re‐bid and re‐awarded twice to containers
Textainer
Management income, military, tanks, and resale provide growth and diversification
(a) Source: ITC’s Global Tank Container Survey dated February 2018
4
Current Market Environment
Strong lease‐out Current container price Positive container trade
market continues around $2,200/CEU growth
Current new container rental rates High stable prices are supported 2018 GDP growth forecast at 3.9%
above our fleet average lease rate by increased component and Container trade expected to grow at a
Average lease terms 6 to 7 years manufacturing costs and balanced multiple of GDP
Return schedules focused on China demand Throughput volumes steadily rising in leading
Shipping lines favoring lease vs. ports worldwide
purchase Increases in vessel capacity also stimulate
container demand
No impact to date from current trade actions
Containers are in short High used container prices Containers are being sold
supply worldwide and supported by low inventory significantly above book
utilization at high levels and high stable new value
container prices
Positive market trends continue to create tailwinds
5
Current Industry Conditions vs Prior Quarter

Container Lessors        Container Manufacturers       Shipping Lines

Access to financing      New build prices              Freight Rates

                                                       Idle Vessel
Rental rates             Factory Inventory
                                                       Inventory

                         Production
Cash yields                                            Container Trade
                         Lead Time

                         Lessor/Shipping
Sale prices                                  60%/40%
                         Line Split

     Lessors continue to benefit from the sustained strong environment
                                                                         6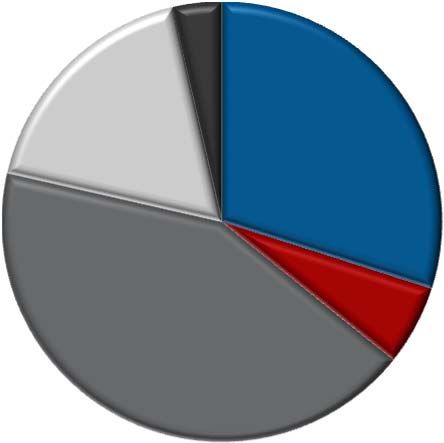
Summary of 2Q 2018 Results
         $ in millions                                                                     2Q18                       2Q17                  Change
         Revenue                                                                           $141                        $119                    18%
         Adjusted EBITDA1                                                                  $109                         $91                    20%
         Adjusted net income (loss)                                                         $18                        ($1)                  1584%
         Adjusted net income (loss) per share                                              $0.31                     $(0.02)                 1650%
         Average Utilization                                                              97.9%                       96.3%                 160 bps

        Revenue and Adjusted Net Income(Loss)1                                 Adjusted EBITDA1 and EBITDA Margin                            Average Fleet Utilization

$200                                                                   $150                                                       100%
                                            $141                                                                            80%   99%
         $122 $120 $117 $119 $126 $129 $133
                                                                       $130
                                                                                                                                  98%
$100                                                                                                                        70%
                                                                       $110                                                       97%
                                     $19    ‐$1    $17    $18                                                                     96%
                 ‐$13 ‐$9     ‐$1                                                                                           60%
                                                                        $90                                                       95%
   $0
         ‐$53                                                                                                                     94%
                                                                        $70                                                 50%
                                                                                $67 $86 $82 $91 $101 $101 $105 $109               93%
‐$100                                                                   $50                                                 40%   92%
        3Q16 4Q16 1Q17 2Q17 3Q17 4Q17 1Q18 2Q18                                3Q16 4Q16 1Q17 2Q17 3Q17 4Q17 1Q18 2Q18                   3Q16 4Q16 1Q17 2Q17 3Q17 4Q17 1Q18 2Q18
                                                                                         EBITDA             EBITDA Margin
                Revenue             Adjusted Net Income (Loss)                           Cash flows before Capex

                                         Continued improvement in financial performance
  Note: Figures $ in millions.
  (1) Excluding unrealized gains/losses on interest rate swaps and write‐off of unamortized financing fees
                                                                                                                                                                               7
Drivers of Improved Financial Performance
New Container Price Index (CEU) Avg Fleet Lease Rate Index (CEU) Avg Fleet Sales Price Index (CEU)
180% 180%
180%
160% 160% 160%
140% 140% 140%
120% 120% 120%
100% 100% 100%
80% 80% 80%
60% 60% 60%
Projected upside from improvements Key indicators remain positive
Estimated Annual Pre‐Tax Income Impact of Key Metrics $700M containers ordered and/or received in
2018 YTD
1% increase in utilization $9M
Utilization as of end of 2Q18 at 97.9%
$0.01 increase in average per diem rate $9M
Significant upside from high utilization, lease
$100 increase in used container sales price $6M repricing, new capex and increase in used
container prices
Fundamentals have remained stable at attractive levels
8
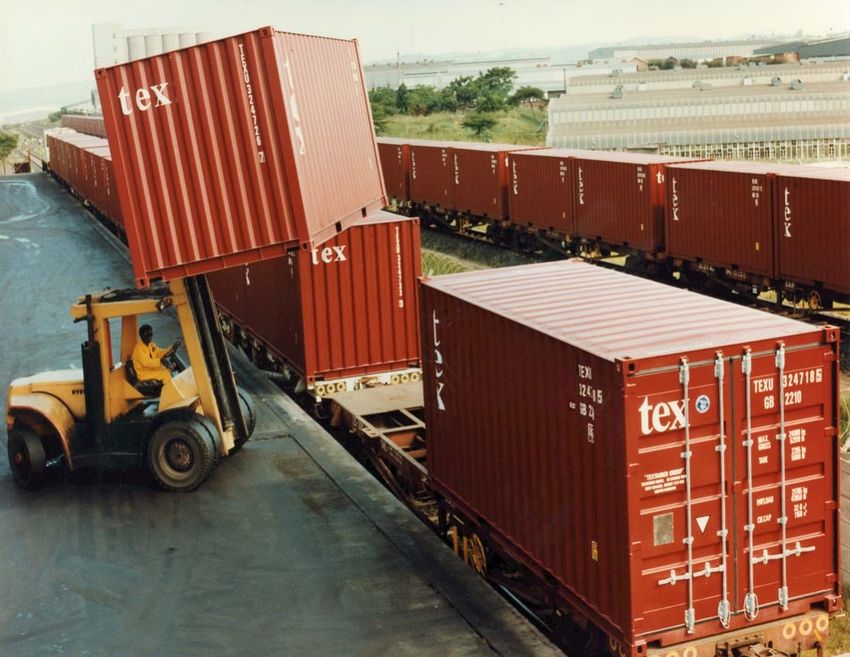
Lease Expirations Create Tailwind
Standard Drys ‐ LTL Expirations and Average
Per Diem Rates 2018‐2022 1
Current and future expiring lease
per diem rates are below current
market rates for both new and
depot containers, providing a
significant revenue upside
Lower cost units from 2015 and
2016 should experience significant
increases in rental rates upon
renewal
Textainer's well‐structured leases
and return provisions support
higher renewal rates and lower
repositioning costs
Significant incremental revenue opportunity
(1) As of June 30, 2018
9
Inventory Supply and Lease‐Outs
Container fleet lease‐outs and turn‐ins
75,000
55,000
35,000
Turn‐ins Strong trend of positive
TEU
Lease‐outs
15,000 net lease‐out
‐5,000 Net
‐25,000 Net Avg 260 thousand TEU leased
during 1H 2018; a
Textainer 6 month record
Factory inventory Lease‐out to return ratio
has averaged 2.1 for 2018
140,000
120,000
Large scale and reliable
100,000 inventory supply to meet
80,000 the immediate needs of
TEU
60,000
40,000
our customers
20,000
‐
We manage our inventory to maximize supply opportunities to our customers
10Container Operating Fleet in CEU
Operating Fleet by Manufacture Year1
400,000 Fully Depreciated % = 15%
Average Age = 7.0 years
5yr CAGR2 (CEU) = 4%
350,000
300,000
Fleet Growth
250,000 4,000,000
3,500,000
200,000
3,000,000
150,000 2,500,000
2,000,000
100,000
1,500,000
50,000 1,000,000
500,000
0
0
2005
2006
2007
2008
2009
2010
2011
2012
2013
2014
2015
2016
2017
2018
< 2004
2013
2014
2015
2016
2017
2018
Specials Refrigerated Standard Managed Owned
Figures as of June 30, 2018
(1) Excludes Finance Lease, Trading and Subleased containers. 11
(2) Includes estimate for 2018Fleet Data 2008–June2018
2008 2009 2010 2011 2012 2013 2014 2015 2016 2017 1H18
New Containers Purchased (CEU) 130,330 33,418 219,922 295,684 377,382 229,046 327,026 231,036 248,452 258,123 194,259
Containers Added Through
Acquisitions 325,000 66,593
of Former Competitors (CEU)
Containers Purchased by
Textainer 405 100,655 33,978 157,357 137,165 552 39,434 ‐ ‐ 3,106 29,602
from the Managed Fleet (CEU)
Retired 1 (CEU) 84,940 125,238 98,328 61,167 77,776 113,734 148,621 188,623 249,620 182,638 74,336
New Container Average
Purchase $2,400 $1,900 $2,470 $2,688 $2,354 $2,109 $2,027 $1,945 $1,532 $2,185 $2,175
Price per CEU
Average Residual Value
$1,151 $817 $1,112 $1,697 $1,444 $1,209 $961 $764 $582 $934 $1,124
per CEU 2
Average Residual Value/
48% 43% 45% 63% 61% 57% 47% 39% 38% 40% 48%
Average Purchase Price
Average Bad Debt Expense
2.7% 1.7% 0.6% 0.1% 0.7% 1.5% ‐0.04% 1.0% 4.3% 0.1% 0.0%
as % of Revenue
(1) In depot retirements only (excludes lost on lease)
(2) Includes cash proceeds and repair bills
12Balance Sheet Summary
($ i n mi l l i ons )
June 30 December 31,
2018 2017 2016 2015 2014
Cash And Cash Equivalents $153 $138 $84 $116 $107
Containers, Net $3,992 $3,791 $3,718 $3,696 $3,630
Total Assets $4,600 $4,380 $4,294 $4,365 $4,359
Growth 5% 3% ‐2% 0% 12%
Long‐Term Debt (Incl. Current Portion)1 $3,236 $2,990 $3,038 $3,024 $2,996
Total Liabilities $3,350
$ $3,170
$ $3,109 $3,099 $3,107
Non‐controlling Interest $58
, $58
, $59 $64 $60
Total Shareholders’ Equity $1,250 $1,153 $1,126 $1,202 $1,193
Total Equity & Liabilities $4,600 $4,380 $4,294 $4,365 $4,359
Debt / Equity plus Non‐controlling Interest 2.6x 2.5x 2.6x 2.4x 2.4x
Strong balance sheet driving momentum with asset growth
(1) Net of debt issuance costs for periods ended December 31, 2015, December 31, 2016, December 31, 2017 , and June 30, 2018
13Textainer Capital Structure
Diversified funding sources Debt principal repayments
Institutional 27% $1,000M
Notes $836M $900M
$800M
Term Loan 20% $700M
$624M
$600M
$500M
Revolving 24%
Credit Facilities
$847M $400M
$300M
$200M
Secured 29%
$952M $100M
Warehouse
$0M
3 4
2019 2020 2021 2022 2023
$3,259M
Avg.
Percentage of Remaining Interest Rate at
Hedging provides
June 30, 2018 2
Total Debt Term (Mos) June 30, 2018 protection during a
Fixed Rate Debt $ 1,387 43% 59 3.94% rising rate environment,
Hedged Floating Rate Debt $ 1,083 33% 18 3.51% limiting the impact of
Total Fixed/Hedged $ 2,470 76% 41 3.73% rate increases
Unhedged Floating Rate Debt $ 789 24% 4.06%
Impact of Fees and Other Charges 0.28%
Total Debt and Effective Interest Rate $ 3,259 100% 4.12%
Long‐term and finance leases as % of total financed container fleet1 77%
Remaining Lease Term 46
Properly hedged debt from diversified sources and with staggered maturities
Debt figures are net of debt issuance costs
1) Includes all containers in our fleet, including off‐hire depot inventory and held for resale 3) Includes Term Loan balance of $312M maturing April 2019 that will be refinanced prior to maturity
2) Pro‐forma for $259M fixed‐rate ABS issued in August 2018 4) Includes Revolving Credit balance of $644M maturing June 2020 that will be refinanced prior to 14
maturityConclusion
Positive trends in market conditions continue:
utilization, lease rates, and used/new container
prices holding at very high levels
Forecasted global trade growth and increased
vessel capacity expected to stimulate container
demand. No impact to date from current trade
actions
New dry freight lease terms enjoying strong
returns, long terms, and tight Asia return provisions
$700 million of containers ordered and/or received
in 2018 provides earning momentum into the
upcoming quarters
A record of over 260 thousand TEU leased out
during 1H 2018
Significant projected built‐in upside as existing
leases mature and re‐price
Textainer has significant upside
15Appendix
(this section contains information for the company’s combined owned and managed fleet)
16Reconciliation of GAAP to Non‐GAAP Items
Three months Six months Fiscal Year Ended December 31
Ended Ended
Amounts in millions Jun-18 Jun-18 2017 2016 2015 2014
Reconciliation of EBITDA
Net income (loss) $18 $37 $19 ($51) $107 $189
Interest income ― ― (1) ― ― ―
Interest expense 35 66 117 85 77 86
Write-off of unamortized deferred debt issuance
costs and bond discounts ― ― 7 ― ― ―
Realized (gains) losses on
interest rate swaps and caps, net (2) (3) 2 9 13 10
Unrealized (gains) losses on
interest rate swaps, net ― (2) (4) (6) 2 (2)
Income tax (benefit) expense 1 1 2 (3) 7 (18)
Net income (loss) attributable to noncontrolling interest 1 3 2 (5) 6 6
Depreciation expense and container impairment 58 114 239 330 227 177
Amortization expense 1 3 4 5 5 4
Impact of reconciling items on net income (loss)
attributable to noncontrolling interest (3) (5) (12) (17) (12) (10)
EBITDA $109 $214 $375 $347 $430 $442
Reconciliation of Adjusted Net Income (Loss):
Net income (loss) $18 $36 $19 ($51) $107 $189
Unrealized (gains) losses on
interest rate swaps, net ― (2) (4) (6) 2 (1)
Write off of unamortized debt issuance costs ― ― 8 ― ― 7
Impact of reconciling items on net income (loss)
attributable to noncontrolling interest ― 1 ― 1 ― (1)
Adjusted Net Income (Loss) $18 $35 $23 ($56) $109 $194
1718
You can also read