Effect of a diffuse polyethylene covering film on greenhouse and crop light environment and on tomato crop pro-duction
←
→
Page content transcription
If your browser does not render page correctly, please read the page content below
Ref: C0692

Effect of a diffuse polyethylene covering film on green-
house and crop light environment and on tomato crop pro-
duction

C. Kittas, O. Merkouris, V. Arcadio, C. Nardiello and N. Katsoulas. University Of Thessaly,
Dept. Of Agriculture Crop Production and Rural Environment, Fytokou Str, 38446, Volos,
Greece
Th. Bartzanas, Centre for Research and Technology Hellas, Institute for Research and
Technology-Thessaly, Dimitriados 95 & P. Mela St., 38333, Volos, Greece

Abstract

High solar radiation levels occurring during summer in Mediterranean regions force green-
house growers to apply shading usually from May to September. If no shading is applied the
direct light entering the greenhouse may cause sunburn problems to the crop. Diffusing
cover materials improve the uniformity of vertical light distribution in a crop; therefore de-
crease the energy load on the uppermost crop layer to the advantage of the underlying
leaves avoiding light saturation in the upper leaves. These properties my lead to production
increases of up to 10%. Diffusion, however, usually implies a loss of overall transmission.
Thus, aim of this work was to study the effect of a diffuse polyethylene (PE) film on green-
house light and crop microclimate and on leaf photosynthesis and crop production and the
results where compared with those found in a greenhouse covered by a common PE film
with no diffusion characteristics. The films were evaluated in the laboratory and experimen-
tally in two similar arched roof greenhouses, one covered with a diffuse (D-PE) of a common
PE film (C-PE). The greenhouse and outside microclimate parameters along with crop pho-
tosynthesis, growth and production were recorded. Experimental results show that the D-PE
covering material reduces about 20% the solar radiation entering the greenhouse compared
to the C-PE film. However, it results in a more homogeneous light distribution along the dif-
ferent levels of the crop. The photosynthesis rate measured at three different heights of the
crop (bottom, middle, top) where found similar for the case of the crop grown under the D-PE
film while under the C-PE film the crop had high photosynthesis rate for the top leaves and
much lower photosynthesis rate in the bottom leaves. The different light distribution at the
three crop levels affected also the quality of the fruit produced, since the fruit grown at the
top of the plant during May and June under the C-PE greenhouse where affected by sunburn
and blossom end rot, something that resulted in lower crop production under the C-PE
greenhouse during the spring –summer experimental period.

Keywords: light transmission, light intensity, light quality, diffuse light, plant photo-
synthesis, crop development

1    Introduction

It is known that diffuse light is able to penetrate deeper into a plant canopy in comparison
to direct light and that photosynthesis it may be increased by diffuse light. There are also
indications that plants have developed mechanisms to use diffuse light more efficiently
(DeLucia et al., 1996; Vogelmann, 1996). Light is not always evenly distributed in green-
houses. Fruit vegetables like tomato and cucumber have a high leaf area index and in-

Proceedings International Conference of Agricultural Engineering, Zurich, 06-10.07.2014 – www.eurageng.eu   1/6
tercept a large quantity of light with the upper levels of the crop, while the middle and
lower leaves receive less light and contribute less to photosynthesis. As the uppermost
leaves may often be light-saturated, it can be argued that a more uniform light distribu-
tion would result in higher overall assimilation. Thus, the crop would benefit if the light
was more evenly distributed along the different levels of the crop (Brodersen et al., 2008;
Markvart et al., 2010; Elings et al. 2012). This can be achieved by diffuse light. Light can
be made diffuse by modern covering materials (Hemming et al., 2005). Such materials
contain pigments, macro- or microstructures, which are able to transform all incoming
direct light into diffuse light. Efficient materials make the light diffuse without a significant
reduction in light transmission. However, in several cases increase of diffuse light de-
creases cover total light transmission.
Dueck et al. (2012) studied the influence of diffuse glass with a haze factor of 45, 62 and
71% and light transmission equal to or greater than that of standard glass. They found
that compared to clear glass, under diffuse light conditions, light penetrated deeper into
the crop resulting in a higher photosynthetic capacity in the lower canopy, but only in win-
ter.
On the other hand, in case of Mediterranean greenhouses, summer crops are often
shaded (Baille et al., 2001), as high (sun) light intensities in combination with high crop
temperatures and VPD, can also negatively affect photosynthesis. However, the main
reason for shading is to avoid burning damage of leafs and fruit (Katsoulas and Kittas
2008).
In this work the effect of a diffuse polyethylene covering material on greenhouse light
transmission, light quality and crop photosynthesis and production was studied in a to-
mato crop grown under Mediterranean summer conditions in Central Greece.

2     Materials and methods

2.1    Greenhouses and plant material

The experiments have been performed in two similar arched roof greenhouses, N-S oriented,
located at the University of Thessaly near Volos, (Velestino: Latitude 39º 22΄, longitude 22º
44΄, altitude 85 m), Eastern Greece, between February and June 2009. The geometrical
characteristics of the greenhouses were as follows: eaves height of 2.4 m; ridge height of 4.1
m; total width of 8 m; total length of 20 m; ground area of 160 m2, and volume of 572 m3. The
soil of each greenhouse was totally covered by double-side coloured plastic mulch. The
greenhouses were equipped with two side roll-up vents controlled automatically and ventila-
tion set point temperature was set at 21ºC.
A standard greenhouse PE film covered one of the three greenhouses (C-PE). The other
greenhouse was covered by a PE film with high light diffusion. PE film’s thickness was 180
μm and were supplied by Plastika Kritis S.A. (Heraclion, Crete, Greece).
The tomato crop (Lycopersicon esculentum, var. Lorelay) was planted at the beggining of
February 2013, in slabs (1 m long, 0.3 m wide) filled with perlite. Plant density was 2.1
plants∙m-2. Irrigation was automatically controlled by a fertigation computer with electrical
conductivity and pH set points of 2.5 dS m-1 and 5.5, respectively.

2.2    Measurements

The following climatic data were recorded outside and inside each greenhouse: air tempera-
ture and air relative humidity and total solar radiation. Furthermore, diffuse solar radiation
was measured by means of a shadow ring and a pyranometer. All the above-mentioned
measurements were recorded in a data logger system every 10 minutes.
Measurements of the spectral transmittance of the three cover materials were made in the
greenhouse using a LI-COR portable spectroradiometer (LI-1800). Measurements were car-
ried out under clear sky during the solar noon.

Proceedings International Conference of Agricultural Engineering, Zurich, 06-10.07.2014 – www.eurageng.eu   2/6
A series of non-destructive measurements was made in 8 randomly selected plants per
greenhouse, 8 times during the experimental period and measurements of plant height,
number of nodes and length and width of the leaves were carried out. Harvesting took place
two times per week and started at 4 of May and the number of collected fruits per green-
house was recorded.
Leaf net CO2 assimilation (An), leaf transpiration rate (E) and stomatal conductance (gs) were
determined by means of a portable photosynthesis system (LCpro+, ADC BioScientific Ltd.,
England) equipped with a chamber using a constant leaf area (5.2 cm2). All measurements
were made under ambient conditions on clear sunny days. Three layers of the crop were
considered (Layer 1: old leaves of the bottom layer, Layer 2: adult leaves of the middle layer,
and Layer 3: young leaves of the uppermost layer). The PPFD value prevailing in the middle
of each leaf layer was measured by a silicon cell sensor fixed to the support of the chamber.
The statistical package SPSS (SPSS-14.0 for Windows standard version, 2005, SPSS BI
Greece S.A.) was used for statistical analysis of the data. Data were analysed using ANOVA
(p ≤ 0.05) and Duncan's multiple range post hoc tests.

3                                           Results and Discussion

3.1                                              Screenhouse transmittance

The mean 15 days value of solar radiation measured outside and inside the two green-
houses is presented in Fig. 1. It will have to be noted that after the 20th of May, a shading
net was attached in the external side of the PE cover in both greenhouses. The mean value
of greenhouse transmission coefficient, calculated as the ratio of incoming to outside solar
radiation, before the application of shading was found to be 73% and 61% for the C-PE and
D-PE greenhouses, respectively, while it was reduced to 61% and 49% for the C-PE and D-
PE greenhouses, respectively, after shading application.
                                          600
Average daytime solar radiation (W m-2)

                                          500

                                          400

                                          300

                                          200

                                                                                                       C-PE
                                          100                                                          D-PE
                                                                                                       Out
                                           0
                                                1-3   16-3   31-3   15-4   30-4 15-5   30-5   14-6   29-6     14-7
                                                                              Time

Figure 1. Evolution of the mean daily values of solar radiation during the period of measurements. The
vertical line indicated application of an external shading screen after that date.

Measurements of diffuse solar radiation by means of the shading ring allowed to estimate the
percentage of direct and diffuse part of solar radiation incoming in each greenhouse. The
measurements performed during the period without the shading screen on the greenhouses
showed that the diffuse part of radiation was 36% and 72% for the C-PE and D-PE green-
houses, respectively.

3.2                                              Light quality parameters

Calculated values of several parameters obtained using the LI-COR portable spectroradi-
ometer in situ are presented in Table 1. The PAR radiation transmission of the D-PE film was

Proceedings International Conference of Agricultural Engineering, Zurich, 06-10.07.2014 – www.eurageng.eu            3/6
about 25% less than the C-PE film, with a similar reduction also observed for the other wave
bunds except for the Blue light were a 29% reduction was observed under the D-PE com-
pared to C-PE greenhouse.
Table 1. In situ calculated coefficients for the two greenhouses.
coefficient C-PE D-PE
τ PAR 0.72 0.54
τB 0.69 0.49
τ NIR 0.82 0.62
τT 0.74 0.56
B:R 0.91 0.84
B:FR 0.86 0.80
PAR:NIR 0.93 0.47
τ: radiation transmission to several wavelength bands, B= radiation for blue spectrum 400 nm
to 500 nm, R: radiation for red spectrum 600 nm to 700 nm, FR= radiation for far red spec-
trum 700 nm to 800 nm, PAR= radiation for photosyntheticaly active radiation spectrum 400
nm to 700 nm, T= radiation for spectrum 400 nm to 1100 nm, NIR= radiation for near infrared
spectrum 700 nm to 1100 nm.
3.3 Air temperature and vapour pressure deficit
As shown in Table 1, the D-PE film had about 24% lower transmission to total solar radiation,
and accordingly, since less energy was entering the greenhouses, a reduction in air tempera-
ture would be expected. Indeed, the daytime greenhouse air temperature in the D-PE green-
house was slightly lower compared to C-PE greenhouse (Fig. 2a), especially before the ap-
plication of shading screen. A similar reduction was also observed in the air vapour pressure
deficit values observed during the daytime period in the D-PE greenhouse compared to the
C-PE greenhouse (Fig. 2b). No significant differences of air temperature were found between
the two greenhouses during the night period.
35 3
Clear
2.5
Average daytime air VPD (kPa)
30
Average daytime air temperature (oC)
Diffuse
2
25
1.5
20
1
C-PE
15
D-PE 0.5
Out
10 0
1-3 16-3 31-3 15-4 30-4 15-5 30-5 14-6 29-6 14-7 1-3 16-3 31-3 15-4 30-4 15-5 30-5 14-6 29-6 14-7
Time Time
Fig. 2. Evolution of the mean daytime (a) air temperature and (b) vapour pressure deficit (VPD) values
during the period of measurements in the two greenhouses.
3.4 Effect of diffuse light on photosynthesis and fruit yield
The mean value of PAR measured in three different crop height levels during the photosyn-
thesis rate measurements performed in 7 days of the period, are shown in Figs 3 (a) and (b),
for the C-PE and D-PE greenhouses, respectively. The mean value of PAR in the C-PE and
D-PE greenhouses was 274 µmol m-2 s-1 and 244 µmol m-2 s-1 for the lower crop layer (Layer
Proceedings International Conference of Agricultural Engineering, Zurich, 06-10.07.2014 – www.eurageng.eu 4/63), 371 µmol m-2 s-1 and 366 µmol m-2 s-1 for the middle crop layer (Layer 2) and 589 µmol m-
2 -1
s and 514 µmol m-2 s-1 for the top crop layer (Layer 1), respectively. It can be seen that the
PAR measured in the D-PE greenhouse in layers 1, 2 and 3 was 11%, 1% and 13% lower
than that measured in the C-PE greenhouse.
The mean value of the photosynthesis rate measured in three different crop height levels
during 7 days of the period, are shown in Figs 3 (c) and (d), for the C-PE and D-PE green-
houses, respectively. The mean value of leaf photosynthesis rate in the C-PE and D-PE
greenhouses was 5.2 µmol m-2 s-1 and 5.4 µmol m-2 s-1 for the lower crop layer (Layer 3), 7.9
µmol m-2 s-1 and 8.1 µmol m-2 s-1 for the middle crop layer (Layer 2) and 11 µmol m-2 s-1 and
10.9 µmol m-2 s-1 for the top crop layer (Layer 1), respectively. Thus, it can be seen that al-
though the PAR levels where lower under the D-PE greenhouse, the photosynthesis rate
measured was higher (about 3.5%, in layers 1 and 2) in the D-PE greenhouse or similar
(layer 3) to that measured in the C-PE greenhouse.
The light-use efficiency (LUE, in mole CO2 fixed per mole of incident PAR) was lower in the
top layer of the C-PE crop compared to the other two layers, with an average value of 0.02
for the three crop layers. The LUE observed in the D-PE crop was the same on all three lay-
ers with an average value of 0.022.
The mean (three crop layers) intrinsic leaf water-use efficiency (WUEi = photosynthesis rate
to stomatal conductance in μmol mol-1) observed was 35 and 43 for the C-PE and D-PE crop,
respectively.
900 900
Layer 1 Layer 1
800 800
Layer 2 Layer 2
700 Layer 3 700
Layer 3
PAR (µmol m-2 s-1)
600
PAR (μmol m-2 s-1)
600
500 500
400 400
300 300
200 200
100 100
0 0
1-4 16-4 1-5 16-5 31-5 15-6 30-6 15-7 27-3 16-4 6-5 26-5 15-6 5-7 25-7
Date Date
(a) (b)
16 16
Layer 1 Layer 1
Photosynthesis rate (μmol m-2 s-1)
14 Layer 2 14
Layer 2
Layer 3
12 12 Layer 3
Photosyntheis rate (µmol m-2 s-1)
10 10
8 8
6 6
4 4
2 2
0 0
1-4 16-4 1-5 16-5 31-5 15-6 30-6 15-7 27-3 16-4 6-5 26-5 15-6 5-7 25-7
Date Date
(c) (d)
Figure 3. Photosynthetical active radiation (PAR) measured in the (a) C-PE and (b) D-PE greenhouse
at three crop height levels and photosynthesis rate measured in the respective crop layers in the (c) C-
PE and (d) D-PE greenhouses.
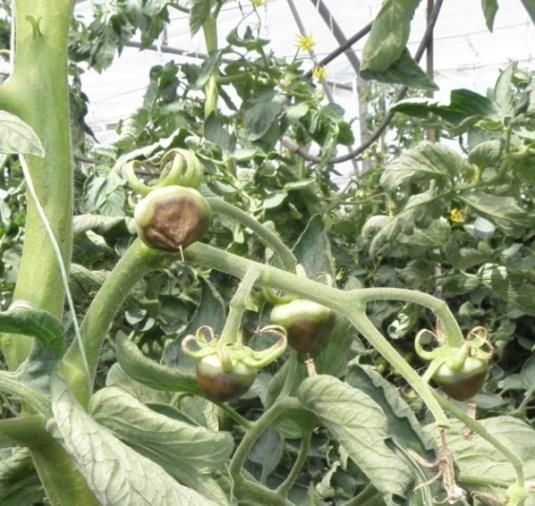
However, the marketable fruit yield observed was almost double in the D-PE greenhouse
than in the C-PE greenhouse due to high occurrence of blossom end rot in the C-PE green-
house (Fig. 4). This was attributed to the high levels of direct solar radiation observed in the
C-PE greenhouse before shading.
Proceedings International Conference of Agricultural Engineering, Zurich, 06-10.07.2014 – www.eurageng.eu 5/6Figure 4. BER observed in the C-PE greenhouse during beginning of May. 4 Concluding remarks The new diffuse film (D-PE) evaluated experimentally was compared to a clear polyethylene film (C-PE). The D-PE covering material reduced about 20% the solar radiation entering the greenhouse compared to the C-PE film. However, it resulted in a more homogeneous light distribution along the different levels of the crop. The photosynthesis rate measured at three different heights of the crop (bottom, middle, top) where found similar for the case of the crop grown under the D-PE film while under the C-PE film the crop had high photosynthesis rate for the top leaves and lower photosynthesis rate in the bottom leaves. The different light dis- tribution at the three crop levels affected also the quality of the fruit produced, since the fruit grown at the top of the plant during May and June under the C-PE greenhouse where af- fected by sunburn and blossom end rot, something that resulted in lower crop production under the C-PE greenhouse during the spring –summer experimental period. 5 References Baille, A., Kittas, C., Katsoulas, N., 2001. Influence of whitening on greenhouse microclimate and crop energy partitioning. Agricultural and Forest Meteorology, 107(4): 293-306. Brodersen, C.R., Vogelmann, T.C., Williams, W.E. and Gorton, H.L. 2008. New paradigm in leaf - level photosynthesis: direct and diffuse lights are not equal. Plant, Cell and Environment 31:159-164. DeLucia, E.H., Nelson, K., Vogelmann, T.C. and Smith, W.K. 1996. Contribution of intercellular reflectance to photosynthesis in shade leaves. Plan, Cell and Environment 19: 159-170. Dueck, T., Janse, J., Tao Li, Kempkes, F. and Eveleens, B. 2012. Influence of diffuse glass on the growth and production of tomato. Acta Hort. 956:75-82. Elings, A., Dueck, T., Meinen, E., and Kempkes, F ., 2012. Analysis of the effects of diffuse light on photosynthesis and crop production. Acta Hort. 957:45-52. Hemming, S., van der Braak, N., Dueck, T., Elings, A. and Marissen, N. 2005. Filtering natural light by the greenhouse covering – More production and better plant quality by diffuse light? Acta Hort. 711: 105-110. Katsoulas N., Kittas C., 2008. Impact of greenhouse microclimate on plant growth and development with special reference to the Solanaceae. In: Passam H. (Ed) The fruiting species of the Solanaceae. The European Journal of Plant Science and Biotechnology, 2 (Special Issue 1), 31-44. Markvart, J., Rosenqvist, E., Aaslyng, J.M. and Ottosen, C.O. 2010. How is canopy photosynthesis and growth of Chrysanthemums affected by diffuse and direct light? Eur. J. Hort. Sci. 75:253-258. Vogelmann, T.C., Bornman, J.F. and Yates, D.J. 1996. Physiologia Plantarum 98, 43-56. Proceedings International Conference of Agricultural Engineering, Zurich, 06-10.07.2014 – www.eurageng.eu 6/6
You can also read