Educational App for Traffic Noise Mapping - AcusticaUACh
←
→
Page content transcription
If your browser does not render page correctly, please read the page content below
Educational App for Traffic Noise Mapping

Enrique Suárez a)
Jorge P. Arenasb)
Institute of Acoustics, University Austral of Chile, PO Box 567, Valdivia, Chile

Guillermo Rey-Gozaloc)
Universidad Autónoma de Chile, 5 Poniente 1670, Talca, Chile
Universidad de Extremadura, Av. Universidad, s/n, 10003 Cáceres, Spain

 ABSTRACT

It is well known that traffic is the dominant source of environmental noise in modern cities.
Traffic noise predicting models have been commonly used for developing noise maps using
commercial software. From the results obtained in large-scale studies carried out in Santiago
of Chile, a simplified traffic noise model was developed for assessing the noise levels
produced close to roads. This model has been validated against on-site measurements and it
has reported good reliability. The input variables of the model can easily be obtained from
the features of traffic flows and roads. Based on this model, a user-friendly software
application for Android mobile phones and a website to report the results were both
implemented. This app, which was originally conceived for instructive purposes, allows the
users to produce a map showing the estimated levels of traffic noise at several points on an
interactive georeferenced map. Thus, the app and the website are a very interesting learning
support tool for teaching environmental noise in schools. The app has also been applied
successfully in a smaller city (Valdivia, Chile).

1 INTRODUCTION

 Traffic is the main source of urban noise in modern cities. Authorities require to inform about
the noise levels and their negative effects on people’s health1. Therefore, environmental noise
maps are very important to make a public health problem noticeable which otherwise becomes
hidden2. However, noise maps are expensive to elaborate, and it is desirable to have other means
to deliver relevant and simple environmental information to the public.

a)
 email: enriquesuarez@uach.cl
b)
 email: jparenas@uach.cl
c)
 email: guille@unex.es
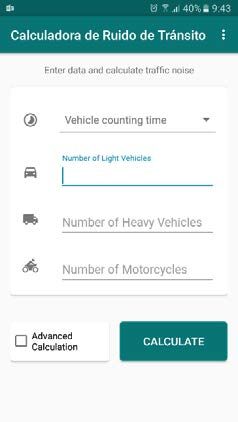
The Ministry of Environment and the National Commission for Scientific and Technological
Research of the Chilean Government have funded several projects to elaborate noise maps using
different methodologies3-10. In 2011, the Institute of Acoustics of the Univ. Austral of Chile
developed the noise map of Santiago5,11, which was updated in 2016 by the same institution7.
 Using field verification measurements that were carried out during the noise map studies, a
simplified traffic noise model was developed for being used at schools for educational purposes.
Then, a first Android application was presented in 2012. This app includes both the simplified
traffic noise model and a more advanced method of calculation which is based on the German
model RLS-90 (http://www.acusticauach.cl/?p=2661).
 In 2016, the app was modernized using the new data obtained from the project of updating of
the noise map of Santiago7, and a web-based platform was included which allows one to publish
the results obtained with the app (www.calculadora.acusticauach.cl). The app has been
successfully applied in didactic school activities and as a complementary learning activity at the
university level. Currently, the Android app is available in both Spanish and English languages
(https://play.google.com/store/apps/details?id=cl.emendare.noise&hl=es).
 It is important to note that this application has an educational purpose and it has not been
designed to replace standard traffic noise modeling. The calculated results using the app provide
approximate results that allow the user to dimension the environmental traffic noise problem. The
results obtained from the app have also been compared with real noise measurements.

2 METHODOLOGY

2.1 Study area and noise measurement

 The app, which was named “Calculadora de Ruido de Tránsito” (Traffic Noise Calculator),
gives noise level estimations from simple parameters such as vehicle traffic flow (light and heavy
vehicles and motorcycles) and allows one to publish the georeferenced results in a web site (see
Figs. 1 and 2). With this type of tools, the street noise levels can easily be estimated and, for
instance, the need to considering professional design of building facade isolations can be assessed.

Fig. 1 – Screenshots of the app “Calculadora de Ruido de Tránsito”, which is available from
 www.calculadora.acusticauach.cl
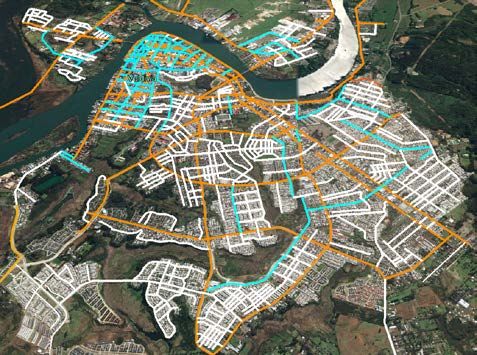
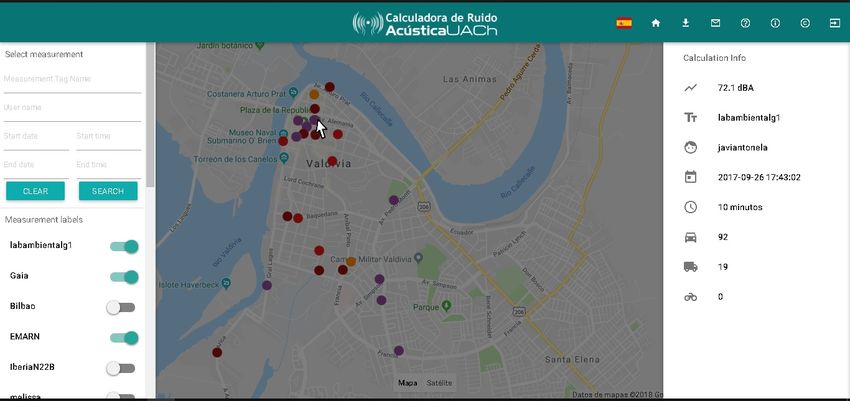
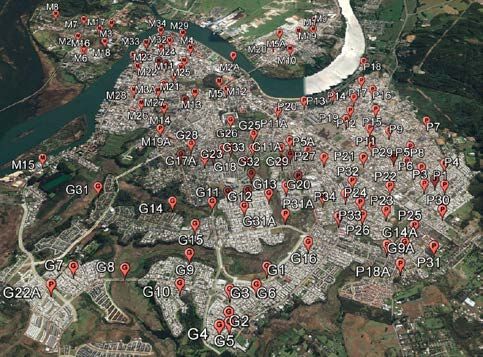
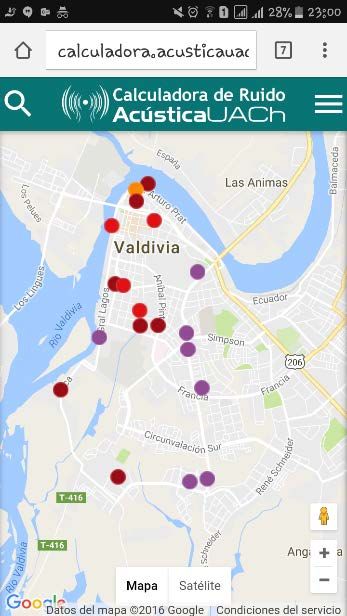
The app has been successfully applied in educational projects. An interesting experience was
carried out in 2015 during its application in an Explora project (a government national program to
disseminate and regard science and technology) at the Felipe Barteaux School in the small rural
town of Lanco (http://www.acusticauach.cl/?p=5866) where the students developed the noise map
of the town. This activity was carried out by 10−14 years old students. Additional outreach
initiatives have included the development of Univ. Austral funded school guides for educational
purposes. http://www.universodelsonido.cl/guias-de-estudio/contaminacion-acustica/

Fig. 2 – Screenshot of the website “Calculadora de Ruido” (Noise Calculator), available at
 www.calculadora.acusticauach.cl

 To compare the estimated values using the app with real noise measurements, an analysis was
performed with the 2013 and 2014 data available at the city of Valdivia6. A total of 201 noise
measurements were carried out at different types of roads, that were classified according to the
official classification scheme of the Ministry of Housing and Urbanism12: 26 noise measurements
at collector (orange), 64 at service (blue) and 111 at local (white) roads (see Fig. 3).

Fig. 3 – Administrative road types and noise measurement locations in Valdivia (Chile): Collector
roads (orange), Service roads (blue), Local roads (white).
Measurements were performed on a study area comprising the whole city, by selecting measurement points closed to the roads. Sound measurements followed ISO 1996–2 standardized guidelines13,14: type of equipment, microphone height and distance, weather conditions, etc. Traffic was the only noise source measured. Measurements were conducted during 15 min and all the acoustic parameters of interest were obtained (Leq, Lmax, Lmin, etc.). In addition, the site characteristics and composition and distribution of the traffic flow were also registered. 2.2 Noise prediction methods The app uses an algorithm which is based on 318 15-min measurements, where the traffic flow and its composition were simultaneously recorded. These measurements were part of the validation process of the noise map performed in Santiago in 20115. Several curve-fitting analysis were tried to estimate the noise levels from flow measurement data. The best results were obtained for a log-X model to describe the relationship between Leq in dBA and Veh Eq/h, which is given by: = 41.7314 + 4.05464 × ln(Veh Eq/h) (1) The correlation coefficient of the fitted curve is 0.877263 (p-value < 0.05) with a standard error of 2.14889 dBA. Thus, this high value of R2 shows the high correlation between both variables. The model given by Eq. (1) was the first to be implemented in the app. Later, the model was updated in 2016, using the same methodology and analysis. For the updating, 500 additional 15- min measurements of noise levels and traffic flow characterizations were considered. These data came from the information collected to validate the updated noise map of Santiago7 and the measurements points were distributed all over the city. In addition, some urbanistic details were recorded, such as types of roads, traffic flow characterization, presence of public transportation, etc. From the data, an update of Eq. (1) was obtained with a precision of 86.765% and an estimation standard error of 1.879 dBA. The new equation is: = 40.5312 + 4.378477 × ln (Veh Eq/h) (2) Veh Eq = Vl + (Vp × 7) + (Mo × 2) (3) Veh Eq/h = Veh Eq × 6 (4) where: Leq: overall equivalent sound level in dBA ln: natural logarithm Veh Eq: equivalent number of vehicles (from counting 10-min periods) Veh Eq /h: equivalent vehicles in an hour Vl: total number of light vehicles counted (cars, small trucks) Vp: total number of heavy vehicles counted (buses, trucks) Mo: total number of motorcycles counted In addition, the app includes a simplified model which is based on the German predictive model RLS-90 as an advanced option, where the distance to the center of the road, the average traffic velocity, and road surface characteristics must be given by the app user.
3 RESULTS AND DISCUSSION

 A total of 201 noise measurements and simultaneous traffic flow characteristics performed at
different types of roads have been considered for testing the app in the city of Valdivia (see Table
1). These measurements were made for validating the noise map developed in the city for the
Ministry of Environment in 20156. In the following, those values estimated from the app will be
denoted as “Calculator” and those from the advanced option in the app will be called “RLS-90”.

Table 1 – Average values of traffic flow and noise levels measured for different types of road in
the city of Valdivia.

 Type of
 QL hour QH hour QM hour Leq (dBA)
 road
 Collector 706 49 9.2 69.5
 Service 359 28 3.7 66.4
 Local 95 13 1.1 60.6

 It can be observed the differences between traffic flows (light, heavy and motorcycles) by
hour which generates differences between the noise levels recorded at these roads. Therefore, in
addition to analyze the predictions globally (Calculator and RLS-90), an analysis considering the
type of road was also performed. Figure 4 shows the results of the estimation error (difference
between measured and estimated values) using both methodologies.

 25
 Calculator
 20 RLS-90
 % Error

 15

 10

 5

 0

Fig. 4 – Distribution of the errors in the estimation of noise levels using Calculator and RLS-90
 considering the total of measurements carried out in the city of Valdivia.

 It can be observed in the error distribution by intervals that Calculator has a Gauss-like
distribution (similar positive and negative error percentage). However, RLS-90 seems to
underestimate the noise levels. Considering the percentage of measurements having an error less
than 1 dBA, 2 dBA, 3 dBA, and 5 dBA, Calculator has 34%, 60%, 73%, and 94%, respectively.
RLS-90 has the corresponding values: 16%, 40%, 62%, and 84% for the same cases.
 In addition to the descriptive analysis of the error distribution, an analysis of the mean errors
and their statistical comparison was performed. The results are presented in Table 2.
 Considering the total of roads, the mean error of the Calculator is close to zero. That is why
comparison of this mean value with zero do not report significative differences (Wilcoxon signed-
rank test). This does not happen for the mean error of RLS-90 whose average value is 1.89. The
average absolute errors of Calculator are less than 1 dB with respect to RLS-90. Thus, comparison
of the relative and absolute average errors for both methods, shows that they are significantly less
in the case of Calculator (p-value < 0.001). It is also important to notice that the absolute average
error of the Calculator is less than 2 dBA.

Table 2 – Mean errors. a) Mann-Whitney test, n.s. non-significance difference (Wilcoxon signed-
rank test), * significant at p < 0.05 (Wilcoxon signed-rank test), *** significant at p < 0.001
(Wilcoxon signed-rank test).

 Comparison Comparison
 Average
 Absolute of average of average
 error ±
 Type of average errors errors
 Method standard
 road error between between
 deviation
 ± SD methods methods
 (SD)
 (Sig)a (Sig)a
 Calculator -0.14±2.30n.s. 1.80±1.44
 All < 0.001 < 0.001
 RLS-90 1.89±2.84*** 2.85±1.86
 Calculator -0.85±2.07* 1.73±1.39
 Collector < 0.001 < 0.01
 RLS-90 2.46±2.66*** 3.13±1.79
 Calculator 0.12±1.93n.s. 1.49±1.22
 Service < 0.001 < 0.001
 RLS-90 1.96±2.62*** 2.76±1.75
 Calculator -0.12±2.52n.s 1.99±1.55
 Local < 0.001 < 0.01
 RLS-90 1.71±3.00*** 2.84±1.95

 An analysis of the error distribution and their average values by type of road was also
performed. The results are presented in Figs. 5−7.

35
 Calculator
 30
 RLS-90
 25
 % Error
 20

 15

 10

 5

 0

Fig. 5 – Distribution of the estimation errors of Calculator and RLS-90 at collector roads.

 30
 Calculator
 25
 RLS-90
 20
 % Error

 15

 10

 5

 0

Fig. 6 – Distribution of the estimation errors of Calculator and RLS-90 at service roads.
20
 Calculator

 15
 RLS-90
 % Error
 10

 5

 0

Fig. 7 – Distribution of the estimation errors of Calculator and RLS-90 at local roads.

 Figures 5−7 show that Calculator also reports less prediction error that those of RLS-90 for
every single type of road. The percentage of measurements using Calculator with an error less than
3 dBA are 81%, 88%, and 73% for Collector, Service, and Local roads, respectively. Using RLS-
90 these values are 54%, 59%, and 62%.
 These previous results of error distribution can be verified from the differences shown in
Table 2 for mean values at each type of road. Thus, the absolute average errors of the Calculator
are less than 2 dBA while those for RLS-90 are near 3 dBA. This implies that between both mean
values there are significant differences for each type of road.

4 CONCLUSIONS

 The experience and use of the Android application in schools show that this app is a useful
tool, user friendly, fast for obtaining results, and simple to publishing the results in an associated
web site. Analysis of the noise data estimated by the Noise Calculator app compared with real
noise measurements show very good results, with an average of 34% of values with errors less
than 1 dBA, 60% of errors less than 2 dBA and 73 % less than 3 dBA. In addition, 94% of the
estimates have errors under 5 dBA.
 Comparative analysis of noise level estimates of the calculator and actual measurements
reported differences by the type of road classification. The amount of data with an error lower than
3 dBA was 81% for collector roads, 88% for service roads and 73% for local roads. The amount
of data with an error less than 5 dBA was 100% for both collector and service roads, and 94% for
local roads. Comparing field measurements with data estimated with the application, it is
concluded that the model implemented in Calculator produces better results than the simplified
RLS-90 based model.

5 ACKNOWLEDGEMENTS

 This work was supported by the Chilean National Commission for Scientific and
Technological Research (CONICYT) through the project FONDECYT No. 1180547. G. Rey
Gozalo was supported by Juan de la Cierva – Incorporation contract from the Spanish Ministry of
Economy, Industry and Competitiveness (IJCI-2016-28923).

6 REFERENCES

1. European Commission, “Directive 2002/49/EC of the European Parliament and of the Council
 of 25 June 2002 relating to the assessment and management of environmental noise (END)”,
 Official Journal L 189 12–26, European Parliament and the Council of the European Union,
 Brussels, Belgium, (2002).

2. World Health Organization (WHO), “Guidelines for Community Noise”, Geneva, Switzerland,
 (1999).

3. Comisión Nacional del Medio Ambiente, “Elaboración de Mapas de Ruido mediante Software
 de Modelación, para Caso Piloto (Comunas de Antofagasta y Providencia)”, Contrato N° 01-
 059/09, Proyecto Ejecutado por el Instituto de Acústica, Universidad Austral de Chile, (2010).

4. Ministerio del Medio Ambiente, “Elaboración de Mapa de Ruido Comuna De Santiago
 Mediante Software de Modelación”, Ficha de Licitación Nº 1588-67-LE10, Proyecto Ejecutado
 por el Instituto de Acústica, Universidad Austral de Chile, (2010).

5. Ministerio del Medio Ambiente, “Elaboración de Mapa de Ruido del Gran Santiago Mediante
 Software de Modelación”, Ficha de Licitación Nº 608897-12-LE11, Proyecto Ejecutado por el
 Instituto de Acústica, Universidad Austral de Chile, (2011).

6. Ministerio del Medio Ambiente, “Elaboración y Análisis de Mapas de Ruido de Tres
 Conurbaciones Mediante Software de Modelación”, Ficha de Licitación Nº 608897-50-LP13,
 Proyecto Ejecutado por el Instituto de Acústica, Universidad Austral de Chile, (2015).

7. Ministerio del Medio Ambiente, “Actualización del Mapa de Ruido del Gran Santiago”, Ficha
 de Licitación Nº 608897-160-LP15, Proyecto Ejecutado por el Instituto de Acústica,
 Universidad Austral de Chile, (2016).

8. N. Bastián-Monarca, E. Suárez and J. P. Arenas, “Assessment of methods for simplified traffic
 noise mapping of small cities: Casework of the city of Valdivia, Chile”, Sci. Total Environ.,
 550, 439-448, (2016).

9. C. Prieto Gajardo, J. M. Barrigón Morillas, G. Rey Gozalo and R. Vílchez-Gómez, “Can weekly
 noise levels of urban road traffic, as predominant noise source, estimate annual ones?”, J.
 Acoust. Soc. Am., 140 (5), 3702-3709, (2016).

10. G. Rey Gozalo and J. M. Barrigón Morillas, “Analysis of sampling methodologies for noise
 pollution assessment and the impact on the population,” Int. J. Environ. Res. Public Health,
 13(5), 490 (2016).

11. E. Suárez and J. L. Barros, “Traffic noise mapping of the city of Santiago de Chile”, Sci. Total
 Environ., 466–467 (1), 539-546, (2014).
12. Ministerio de Vivienda y Urbanismo (MINVU), “Manual de Vialidad Urbana.
 Recomendaciones para el Diseño de Elementos de Infraestructura Vial Urbana (REDEVU)
 2009”, available online: http://www.minvu.cl/opensite_20070404110715.aspx, (2009).

13. ISO 1996-2, “Description, measurement and assessment of environmental noise. Part 2:
 Determination of environmental noise levels”, International Organization for Standardization,
 Geneva, (2017).

14. J. M. Barrigón Morillas, D. Montes González and G. Rey Gozalo, “A review of the
 measurement procedure of the ISO 1996 standard. Relationship with the European Noise
 Directive”, Sci. Total Environ., 565, 595-606, (2016).
You can also read