Carnoustie, Monifieth & Sidlaw Inequalities of Outcomes - Produced for Angus Community Planning Partnership January 2017
←
→
Page content transcription
If your browser does not render page correctly, please read the page content below
PROTECT

Carnoustie, Monifieth & Sidlaw
  Inequalities of Outcomes

 Produced for Angus Community Planning Partnership
                   January 2017
                                Alan McKay – Partnership Intelligence Analyst
                                                                January 2017

                      PROTECT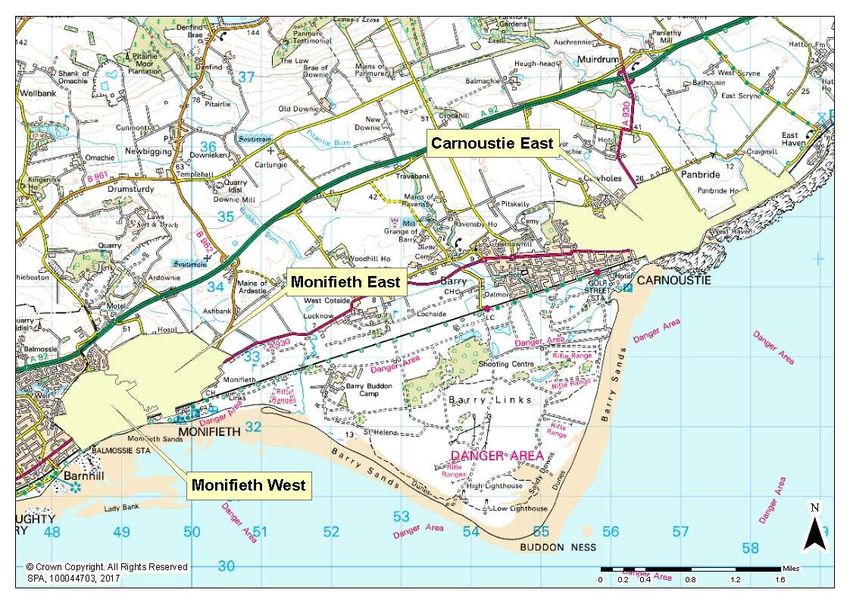
PROTECT

Contents
  1. Introduction & Background                       Page 3

  2. Carnoustie & Monifieth Demographics             Page 4

  3. Outcomes – People                               Page 5

  4. Outcomes – Place                                Page 8

  5. Outcomes – Economy                              Page 10

  6. Appendix 1 – SIMD                               Page 11

  7. Appendix 2 – ScotPHO                            Page 13

  8. Appendix 3 – CPOP                               Page 14

                                       PROTECT                2
PROTECT

1. Introduction
Under the terms of the Community Empowerment (Scotland) Act 2015, Community Planning
Partnerships are required to produce locality plans to identify communities experiencing significant
inequalities of outcome across a wide range of indicators. The plans are required to determine how
outcomes can be improved within these communities so to reduce these inequalities. An important
aspect in the preparation of these plans is appropriate engagement with community bodies. In order to
inform this process, reports have been prepared for each locality. These reports point out some of the
inequalities of outcomes to be considered within locality plans. This will assist to inform future decisions
around how locality plans can improve outcomes for those living in our communities.

Themes

This briefing tackles issues around inequality of outcome based on three key themes – People, Place and
Economy.

Methodology

The guidance issued to Community Planning Partnerships prior to the preparation of locality plans
recommends that data is gathered from as wide a range of sources as possible. For this briefing, a
number of available resources have been interrogated to produce the information and analysis shown
below. These resources include valuable comparison data at the locality level and have been signposted
within the report to allow stakeholders the opportunity to examine the information and analysis
contained within. This includes a number of nationally published datasets and analysis tools.

Scottish Index of Multiple Deprivation (SIMD)

The Scottish Index of Multiple Deprivation (SIMD) is the Scottish Government’s official tool to identify
areas of multiple deprivation across Scotland. It brings together indicators across seven ‘domains’ –
Income, Employment, Education, Health, Access to Services, Crime and Housing. By dividing Scotland
into small pockets of population (known as datazones – 6976 in total) it allows for the relative
comparison of any community with other communities. By focussing on small areas, it is easier to show
the different issues there are in any given neighbourhood.

Scottish Public Health Observatory Online Profiles Tool (ScotPHO)

The ScotPHO Online profiles Tool provides access to various public health related indicators to facilitate
comparisons of areas against local and national norms and comparisons between areas. While not a
performance measuring tool, these profiles are designed to increase the understanding of local
differences in health related outcomes and encourage further discussion.

Community Planning Outcomes Profile (CPOP)

This tool has been developed by the Improvement Service and is designed to ‘provide an overarching,
high-level tool for you to assess if the lives of your communities are improving over time’. It utilises a
suite of core indicators to measure outcomes and inequalities of outcomes. This allows the overall
pattern of outcomes in any community to be assessed and compared against other communities within
Angus, or against comparable communities across Scotland.

                                                PROTECT                                                   3
PROTECT

2. Carnoustie & Monifieth Demographics 1
The latest population projections estimate that there are a total of 30,187 persons living in Carnoustie &
District (13,697) and Monifieth & Sidlaw (16,490) Multi Member Wards (MMW). The gender split is
14525 (48.1%) male to 15662 (51.9%) female.

Figure 1 opposite presents                             Figure 1: Age distribution of Carnoustie / Monifieth MMWs
the age distribution of the                    6000
two combined MMWs. This
shows there are 5,119
children (0-15), 719 young        Population   4000
people aged 16 and 17,
16,868 working aged adults
(18-64) and 7,481 aged over                    2000
65 – including over 1,000
aged over 85. Of the adult
population, the 45-54 age                        0
group is the most populous                            0-15 16-17 18-24 25-34 35-44 45-54 55-64 65-74 75-84 85+
with 4,606 individuals.                                                      Age Bands

The Carnoustie/Monifieth locality is a mix of a more rural geography with most of the population
concentrated in the more urban centres of the two towns. The locality returns a total of seven councillor
members to Angus Council – three in Carnoustie and four in Monifieth. Carnoustie is a dormitory town
for Dundee which is some 11 miles to the west. It is estimated that half of all working adults living in
Carnoustie travel out of the town to work. Monifieth shares a border with Dundee and again supplies
many workers to the city on a daily basis. Both localities can be seen as depending on both Angus and
Dundee for employment and economic prosperity. In addition, tourism is important to both localities –
particularly the strong golfing links typified by the world famous Carnoustie Links.

1
    National Records of Scotland – Population and Household Projections 2016
                                                PROTECT                                                            4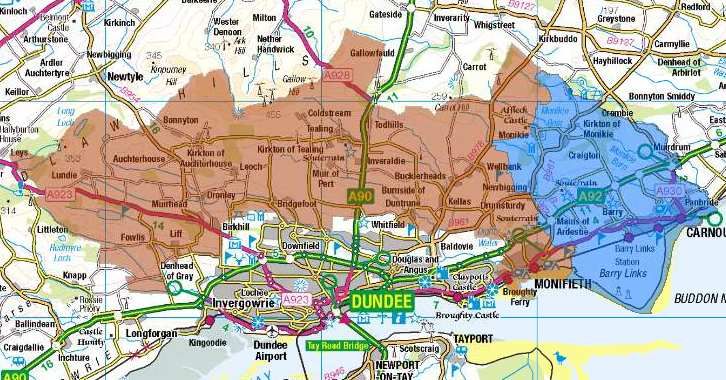
PROTECT
3. People
S4 Tariff Score (CPOP)
This indicator considers the attainment of pupils attending publicly funded secondary schools – it
therefore excludes pupils living within the Carnoustie & Monifieth locality but attending school at an
independent school or being schooled at home. The figures are based on result data from the Scottish
Qualifications Authority (SQA) and include the result of any appeals.
230 S4 Tariff Score 290 S4 Tariff Score
210
190 240
170
190
150
130 140
110
90 90
04/05 14/15 20/21 04/05 14/15 20/21
Figure: Carnoustie West S4 Tariff Score Figure: Carnoustie East S4 Tariff Score
250
S4 Tariff Score
230
210
190
170
150
130
110
90
04/05 14/15 20/21
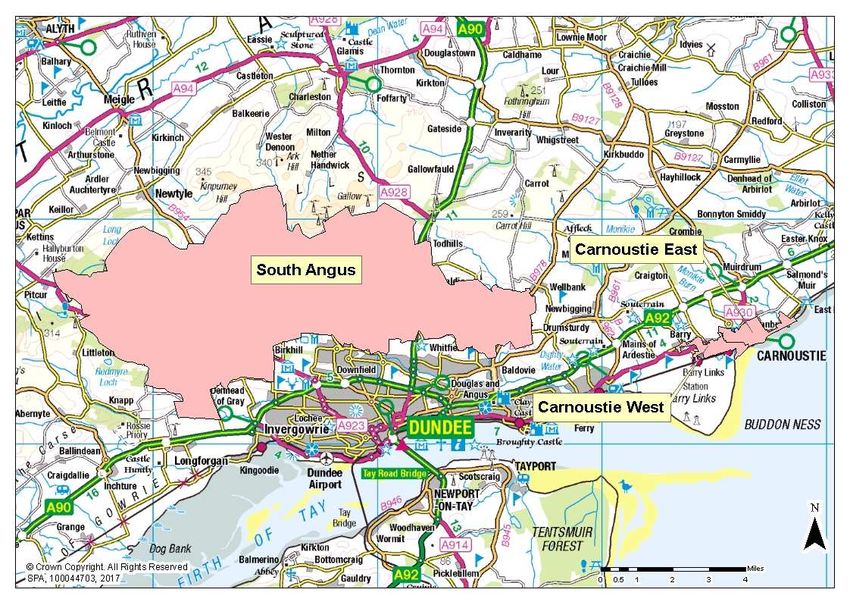
Figure: South Angus S4 Tariff Score Map: S4 Tariff Scores Geographies of Concern
The charts and map above show the results and location for three communities within the locality with
negative indicators for this outcome. In the case of Carnoustie West, attainment is shown to have
declined in recent years with a prediction of a slight upturn in results going towards 2020/21 (red line).
In addition, results are currently well below the Angus baseline (green line) and results from comparable
communities across Scotland (purple line). In Carnoustie East, results are currently in line with the Angus
baseline but are predicted to decline by 2020/21 while Angus results overall are predicted to improve. In
addition, current and predicted attainment is well below similar communities in Scotland. Finally, in
South Angus, the position is similar to Carnoustie East with attainment predicted to decline to below the
Angus baseline and remain well below comparable communities across Scotland.
PROTECT 5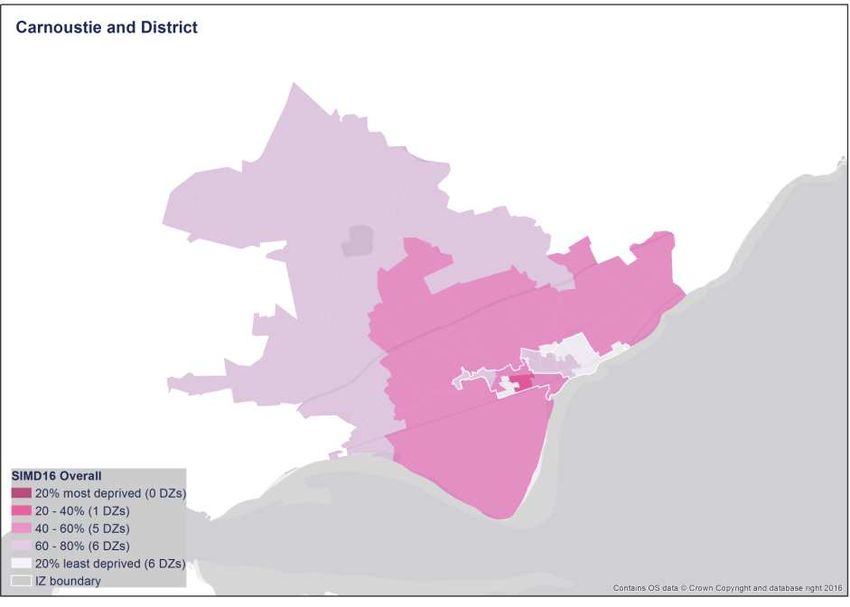
PROTECT
Positive Destinations (CPOP)

Positive Destinations for school leavers are defined as higher education, further education,
employment, training or voluntary work. The data is derived from follow up studies undertaken on
school leavers nine months after the end of the school year.

100               Positive Destinations                  The chart opposite illustrates the one community
                                                         in Angus with a negative outcome for this
 90                                                      indicator. In Carnoustie West, positive destination
 80                                                      results are in decline (red line) and are lagging
                                                         well behind both Angus (green line) and
 70
                                                         comparable communities across Scotland (purple
 60                                                      line).   Furthermore, while this indicator is
 50                                                      predicted to improve in Angus and in similar
                                                         communities, the data predicts a decline in
 40
                                                         performance in Carnoustie West in the years
      04/05                    14/15            20/21    leading up to 2020/21.
Figure: Carnoustie West Positive Destinations

Emergency Admissions (CPOP)

This indicator considers those members of communities aged 65 and over and looks at the levels of
continuous periods of care as an emergency admission in hospital. It utilises data provided through the
Scottish Mortality Records and combines it with the latest population estimates to produce comparable
rates across communities.

Figure : Monifieth East Emergency Admissions            Figure : Monikie Emergency Admissions
                                                        The charts above and the map opposite illustrate
                                                        communities in Angus with a negative outcome for
                                                        this indicator. In Monifieth East, levels of
                                                        emergency admissions are on the rise and are
                                                        predicted to continue this upward path (red line).
                                                        This is in contrast to Angus as a whole (green line)
                                                        and comparable communities across Scotland
                                                        (purple line) – both of which show stable levels of
                                                        emergency hospital admissions. The position is
                                                        similar in Monikie where admissions levels have
                                                        also increased in recent years.
Map: Emergency      Admissions    Geographies     of
Concern
                                                PROTECT                                                   6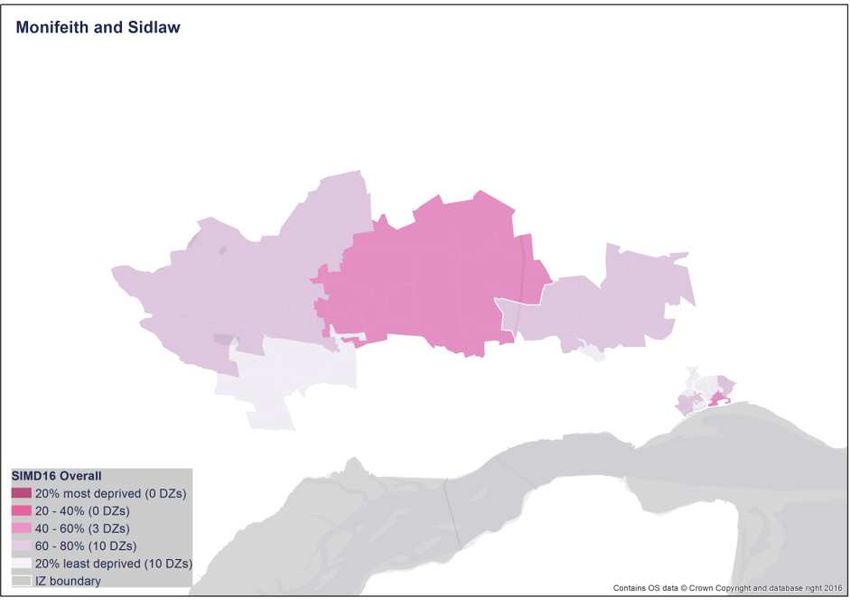
PROTECT
Early Mortality (CPOP)

This indicator considers premature death occurring before the age of 75. It utilises an agreed weighting
model to compare populations of varying demographic profiles and across time.

                                                       Only one community in Carnoustie & Monifieth
                                                       locality compares unfavourable against this
                                                       outcome. In Monifieth East, early mortality rates
                                                       (red line) have historically been lower than in
                                                       Angus as a whole (green line) and comparable
                                                       communities across Scotland (purple line). More
                                                       recently, however, this gap has narrowed and
                                                       future predictions show early mortality rates in
                                                       Monifieth East overtaking Angus and similar
                                                       communities by 2020/21.

Figure : Monifieth East Early Mortality

Health & Wellbeing Indicators (ScotPHO)

Carnoustie West

Across the range of Health & Wellbeing indicators, Carnoustie West performs well compared to Scottish
averages. On two indicators, however, the latest available data shows outcomes statistically poorer than
the national figures. During 2014/15, 19.3% of the population were being prescribed drugs for anxiety,
depression or psychosis against a national average of 17.4% and an Angus baseline of 17.3%. In addition,
over three quarters (78.6%) live within 500 metres of a derelict site against a Scottish average of 29.7%
and an Angus baseline of 18.9%.

Monifieth East

In a similar scenario to Carnoustie West, during 2014/15, 18.9% of the population of Monifieth East
were being drugs for anxiety, depression or psychosis against the national average of 17.4% and an
Angus baseline of 17.3%.

                                             PROTECT                                                   7
PROTECT

4. Place
Depopulation (CPOP)

This measures the level of population growth or fall in a particular area over time. A score of over 100
indicates a fall in population. A rising index therefore indicates a fall in population in that area or
community over time – a possible cause for concern.

Figure : Carnoustie East Depopulation                 Figure : Monifieth East Depopulation

Figure : Monifieth West Depopulation                    Map: Depopulation Geographies of Concern
The charts and the map above illustrate communities in Angus with a rising index over 100 for this
indicator. In Carnoustie East, it is shown how the population has been falling steadily over the last ten
years (red line) and is expected to continue to fall as we move forward to 2020/21. This is in contrast to
Angus as a whole (green line) and comparable communities across Scotland (purple line) – both of which
show a rising population. The position is similar in Monifieth East and Monifeith West.

                                              PROTECT                                                   8
PROTECT
Housing Deprivation (SIMD)
The housing domain of the SIMD considers the percentage of people in households that are
overcrowded or have no central heating.
Table : The ten most housing deprived DZs The table opposite illustrates the ten most
deprived datazones in Angus based on the
Data zone Data zone name Rank Vigintile Housing domain. There is only one datazone
S01007194 Arbroath Cliffburn - 05 872 10-15% within the Carnoustie and Monifieth Multi
S01007191 Arbroath Cliffburn - 02 1034 10-15%
S01007192 Arbroath Cliffburn - 03 1038 10-15% Member Wards in this list – an area of
S01007198 Arbroath Warddykes - 02 1041 10-15% Carnoustie West. While this datazone is
S01007199 Arbroath Warddykes - 03 1202 15-20% amongst the ten most housing deprived in
S01007210 Montrose South - 03 1249 15-20% Angus, the overall Scottish ranking (1367 of
S01007187 Arbroath Harbour - 04 1291 15-20% 6976) places it only within the bottom 20% of
S01007159 Carnoustie West - 04 1367 15-20%
S01007257 Forfar Central - 04 1408 20-25% Scotland as whole.
S01007231 Brechin East - 02 1479 20-25%
Access to Services (SIMD)
The Access domain includes a number of indicators including the average drive time to GP surgery, Post
Office, retail centre, petrol station, primary and secondary school and the public transport travel time
for a GP, Post Office and retail centre.
Table : The ten most access deprived DZs The table opposite illustrates the ten most
deprived datazones in Angus based on the
Data zone Data zone name Rank Vigintile Access domain. Areas of South Angus and
S01007279 Angus Glens - 01 13 ≤ 5% Monikie are within this list. In addition, much of
S01007280 Angus Glens - 02 24 ≤ 5% the rural areas of both MMWs – together with
S01007282 Angus Glens - 04 35 ≤ 5%
one datazone in Carnoustie East – are within
S01007240 Letham and Glamis - 01 60 ≤ 5%
S01007281 Angus Glens - 03 62 ≤ 5%
the most deprived 20% nationally on this
S01007267 Kirriemuir Landward - 02 79 ≤ 5% domain. This reflects the rural nature of much
S01007228 Friockheim - 03 96 ≤ 5% of particularly the Monikie & Sidlaw ward. In
S01007170 Arbroath Landward - 01 124 ≤ 5% total, over 9,000 people live in these datazones.
S01007135 South Angus - 07 156 ≤ 5%
S01007140 Monikie - 04 201 ≤ 5%
PROTECT 9PROTECT
3. Economy
Child Poverty (CPOP)
Child Poverty is measured by looking at the number of children living in families in receipt of Child Tax
Credit, Income Support or Job Seekers Allowance whose income is less than 60% of the median UK
income – before housing costs.
Figure : Monifieth East Child Poverty Figure : Monifieth West Child Poverty
The charts above and the map opposite illustrate
communities in Carnoustie and Monifieth with a
rising measure for the Child Poverty indicator. In
Monifieth East, levels are set to rise further as we
move towards 2020/21 (red line) and will
eventually catch up with levels in comparable
communities across Scotland (purple line).
Current levels remain below the Angus baseline
(green line). In Monifieth West, levels of Child
Poverty are already above that of comparable
communities across Scotland and are catching
Map: Child Poverty Geographies of Concern up with the Angus baseline.
Out of Work Benefits (CPOP)
This indicator measures the number of people of working age (16-64) who are claiming one or more key
Department of Work & pensions benefits – bereavement benefit, carers allowance, disability living
allowance, incapacity benefit, severe disablement allowance, income support, jobseekers allowance or
widows benefit.
Only one community in the Carnoustie &
Monifieth locality is showing cause for concern
on this indicator. In Monifieth East, levels of Out
of Work Benefits are on the rise and are
predicted to approach the levels of comparable
communities across Scotland in future years
(purple line). While still well below the Angus
baseline levels (green line), the rising levels are of
concern.
Figure : Monifieth East Out of Work benefits
PROTECT 10PROTECT
Appendix 1 – SIMD Local Maps & Summary
http://www.gov.scot/Topics/Statistics/SIMD/analysis/maps
PROTECT 11PROTECT PROTECT
at 2.17)
South Angus
Monifieth East
Monikie (none)
the national average;
Carnoustie West
Monifieth West (none)
Intermediate Geography (2001)
Carnoustie East (none)
o = statistically significantly different)
profile by Intermediate Geography (as
Based on Scotpho Health & Well being
(x = statistically significantly worse than
Male life expectancy
Female life expectancy
Population prescribed drugs for
x
x
anxiety/depression/psychosis
Patients with a psychiatric
hospitalisation
Adults claiming incapacity
benefit/severe disability
allowance/employment and
support allowance
Population income deprived
Working age population
employment deprived
PROTECT
Working age population claiming
PROTECT
out of work benefits
Children living in poverty
People claiming Pension credits
(aged 60+)
Crime rate
Appendix 2 – ScotPHO Locality Summaries
Population within 500 metres of
x
a derelict site
https://scotpho.nhsnss.scot.nhs.uk/scotpho/homeAction.do
People living in 15% most
x
'access deprived' areas
Teenage pregnancies
Babies exclusively breastfed at
6-8 weeks
Child dental health in primary 1
Child dental health in primary 7
Child obesity in primary 1
Bowel screening uptake
13PROTECT
Appendix 3 – CPOP Outcomes & Improvement Summary
PROTECT 14You can also read