Measurement, localization and monitoring of partial discharges on a power transformer - Omicron
←
→
Page content transcription
If your browser does not render page correctly, please read the page content below
Technical Paper

Measurement, localization and monitoring of
partial discharges on a power transformer

Power transformers, a key element of the electrical grid,                    Fig. 1 shows the 300 MVA transformer with the horizontal
are subjected to different levels of electrical, thermal,                    220 kV and 110 kV bushings and a small step-up
mechanical, and chemical stress during service. To                           transformer with 24/0.4 kV for exciting the 300 MVA
ensure reliable and safe operation, it is key to assess                      transformer with a diesel-powered generator.
the continuously aging insulation of the system
during a transformer’s life cycle. Partial discharge (PD)
measurements are a non-destructive tool which allows
for measurement, assessment, and localization of weak
spots in complex insulation systems. PD measurements
on power transformers are typically carried out during
the manufacturing process as part of quality assurance,
after onsite installation, and are used as a tool for
condition-based maintenance for matured assets.

PD is a local electrical breakdown of a weak region
within the electrical insulation system, resulting in
                                                                            Figure 1
fast current impulses. These electrical signals are                         View of the 300 MVA Transformer
often accompanied by other physical effects, such as
pressure waves, electromagnetic signals, chemical
effects or optical effects. [1] PD measurements of the
different effects using conventional and unconventional
tools and combining the findings will lead to a more
meaningful assessment.

Case study – PD measurement on a 300 MVA oil-filled
transformer

The high-voltage (HV) bushings of the 220 kV and the 110
kV windings had to be disassembled for the transportation
of a 300 MVA transformer. After mounting the bushings at
the new substation, the bushing domes had to be refilled
with oil. Due to the horizontal-oriented bushings this had
to be done very carefully to avoid gas bubbles. To ensure
                                                                             Figure 2
a proper filling, partial discharge (PD) measurements have                   Setup for PD measurements on phases 1U and 1V
been performed.

This article was first published in the January 2021 issue of Transformers Magazine.

© OMICRON electronics GmbH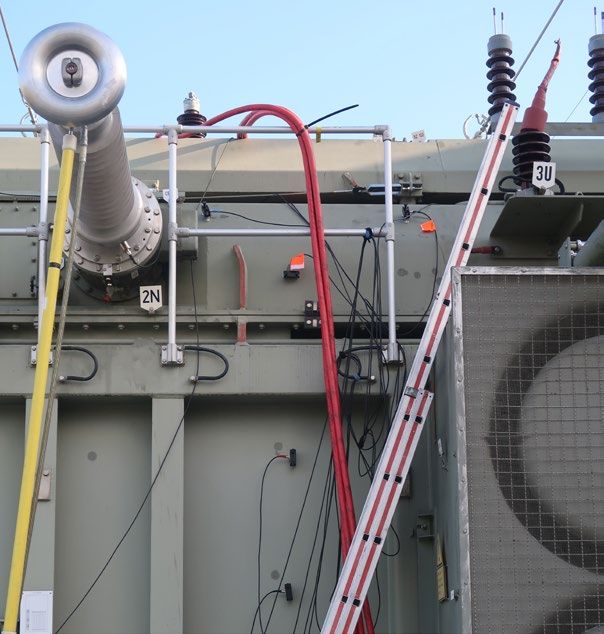
Electrical PD measurement
The test setup was performed in accordance with IEC 60270
[2], simultaneously decoupling the PD and AC signals at the
measuring taps of all 220 kV and 110 kV bushings. Fig. 2
shows the setup of the MPD 800 PD detection instrument at
the 220 kV bushings 1U and 1V. The signals of both bushing
taps can be directly connected to one MPD 800 detector
without using an additional coupling device. Fig. 3 shows
the overall PD test setup.
1W 220 kV Transformer
1U
3U 3V 3W
Piezo-Sensors MPD 800
MPD 800
1N
1U
SVL
2W 2V 2U 2N
MPD 800 MPD 800
Step-up Transformer
0.4 / 24 kV
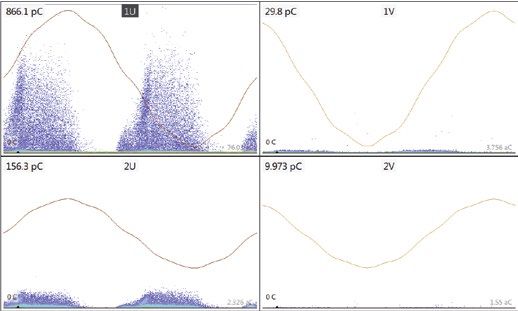
MPD Suite Software Figure 5
400 V / 1155 A
PDL 650 Software Phase Resolved PD (PRPD) pattern obtained at all measuring points at
Diesel-operated Generator
0.8 x Un, linear view
Figure 3
Setup for the PD measurements
Comparing the charge values of the calibration cross
coupling matrix with the cross coupling of the real PD
activity indicated that the origin of the PD event is physically
close to the measuring point 1U.
The MPD Suite software allowed the test engineers to draw
a trigger window in the PRPD pattern. Only PD impulses
occurring in the selected phase and amplitude area will
trigger the scope and FFT view. This tool allows an easy
comparison of the unfiltered high-frequency signals.
Comparing the time signal and frequency spectrum of the
signal directly injected at the bushing tap with the actual
PD signal showed high similarities of their rise time and
oscillation as well as resonances in the frequency spectrum.
The frequency spectrum of the conventional calibration,
where long cables had to be used, did not match.
Figure 4
Artificial impulse injected directly at the bushing tap
A calibration signal was injected into all bushings, enabling
the determination of a cross coupling matrix. In addition
to the conventional PD calibration from HV to ground, a
recording was also performed while injecting the calibrating
signal into the measuring tap of the bushing to simulate a
fault directly at the bushing tap. [1].
The ambient noise level was less than 10 pC at 0.5xUn using Figure 6
MPD Suite software; logarithmic-bipolar view of the PRPD pattern at
a center frequency of 400 kHz and measuring bandwidth of
1U, the trigger window and corresponding time and frequency signal
600 kHz. Even below the nominal voltage, partial discharges
up to 2 nC could be detected at the measuring point 1U.
© OMICRON electronics GmbH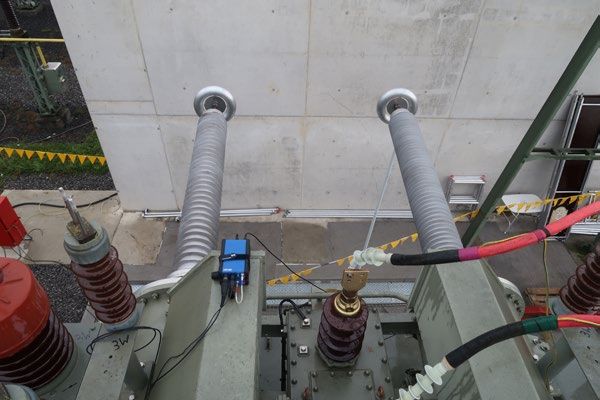
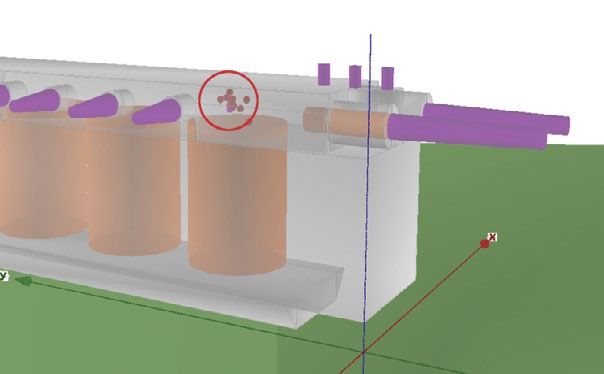
Acoustic PD measurement and localization                             The triangulated fault position as well as the acoustic signal
                                                                     of the internal partial discharges is shown in Fig. 9 and Fig.
The localization of PD sources is performed by means of              10. The location is close to the high-voltage exit lead of the
differences in the runtime of the acoustic signal between            220 kV winding of phase 1U.
the fault location and multiple acoustic emission (AE)
sensors. Possible fault locations are calculated from the
signal runtimes, using the speed of sound and the known
geometrical positions of the sensors on the tank wall.

The MPD 800 PRPD window trigger also provides an
electrical or optical output signal which can trigger an
acoustical localization system. With this method the
delay time to the different Piezo sensors can be measured
absolutely referred to the electrical triggered PD impulse.
This enables the use of averaging functions, which can
result in a significantly improved signal-to-noise ratio. Fig.
7 shows the measured acoustic signals of the piezo sensors
and the impact of averaging. The acoustic localization               Figure 9
was performed with 8 piezo sensors installed in the area of          Acoustic signals of piezo sensors
phase 1U.

                                                                     Figure 10
Figure 7                                                             Location of PD at the high-voltage exit of phase 1U
Acoustic signals without averaging (left) and the averaging of 100
events (right) using the electrical signal as trigger
                                                                     Electrical PD Trending and Monitoring

                                                                     Findings of the off-line PD measurement and localization
                                                                     were discussed with the transformer manufacturer. The
                                                                     fault location, PD behavior and the fact that it cannot be
                                                                     repaired on site led to the decision that the unit could be
                                                                     reenergized while carefully trending the PD activity as well
                                                                     as monitoring the gases dissolved in the insulation oil of the
                                                                     transformer.

                                                                     The transformer was then therefore equipped with bushing
                                                                     adapters at the bushing taps of all 220 kV bushings. The
                                                                     MONTESTO 200 PD monitoring and trending device used
                                                                     can be remotely controlled and communicates with the
                                                                     control center in case PD warning levels are exceeded.

Figure 8
Installation of piezo sensors

© OMICRON electronics GmbH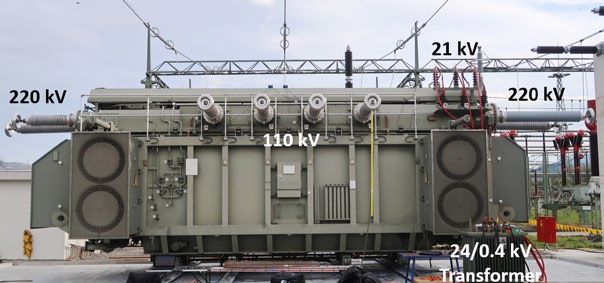
PD alert          Control center
                 UMTS
                                          MONTESTO 200

               Terminalbox
1W
              BTA + CPL 844
                                           3U 3V 3W          V1

                220 kV Transformer
  1N                                                         1U
                                                      SVL
                     2V       2U     2N

Figure 11
Complete setup of the PD monitoring and trending system

Audible corona discharge was active in the substation
thus the measuring frequency was tuned to 2.2 MHz – a
frequency range where the internal discharges dominated             Figure 14
and external disturbances were minimized. The discharge             3PARD filtered PRPD pattern and development of the pattern obtained
level of the internal PD activity at Phase 1U was stable            a Phase 1V
for the first weeks of operation, but then started to
                                                                    Dissolved Gas Analysis (DGA)
continuously increase over a period of one month. Fig.
12 shows the increasing trend of the apparent charge
                                                                    The DGA results before and after transportation did not
measured on Phase 1U.
                                                                    indicate any failure nor PD activity. Hydrogen slightly
                                                                    increased during operation, but the overall amount of
                                                                    dissolved gases are below typical values, thus no reliable
                                                                    assessment can be performed [4]. A local defect inside a
                                                                    solid insulation part does not necessarily lead to an increase
                                                                    of dissolved gases.

Figure 12
Increasing PD trend on Phase 1U

In addition to the known PD activity at Phase 1U a
second pattern developed over 3 months, which started
with approximately 100 pC and stabilized at 2 nC. The
discharge pattern can be assigned to Phase 1V and shows
high similarities to the phenomena obtained at 1U. The
development of the PRPD pattern as well as the 3PARD
diagram is shown in Fig. 13. Fig. 14 shows the development          Figure 15
of the 3PARD filtered PRPD pattern obtained at Phase 1V.            DGA trend over 3 months

                                                                    Conclusion

                                                                    In this article, the importance of electrical PD measurement,
                                                                    localization, monitoring and trending is discussed. On-
                                                                    site PD measurements on liquid-filled transformers are
                                                                    often only triggered by DGA results. The case study on
                                                                    the 300 MVA transformer highlights that an electrical PD
                                                                    measurement and trending can be more sensitive and
                                                                    instantaneous compared to the analysis of dissolved gases
                                                                    in oil. Analyzing the unfiltered signals in time and frequency
Figure 13
Development of PD activity over a period of 5 months, logarithmic   domain as well as performing acoustical PD localization
view                                                                with three or more piezo sensors can provide valuable
                                                                    information when it comes to localization, interpretation
                                                                    and risk assessment. The transformer, with active but stable
                                                                    discharges in two phases remains online and will be further
                                                                    monitored.

© OMICRON electronics GmbH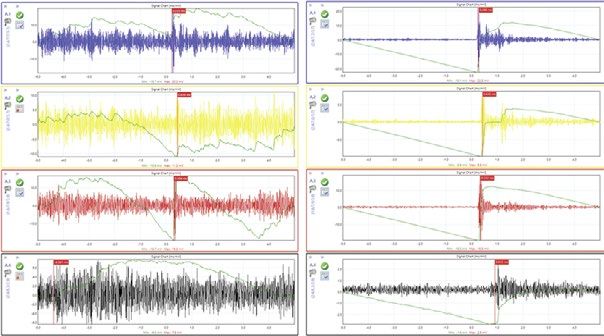
References
1.   CIGRÉ WG D1.29, Technical Brochure 676: Partial            3.   C57.127 (2007), IEEE Guide for the Detection and
     Discharges in Transformers                                      Location of Acoustic Emissions from Partial Discharges
                                                                     in Oil-Immersed Power Transformers and Reactors, The
2.   IEC 60270: Edition 3.1, 2015, High-voltage test                 Institute of Electrical and Electronics Engineers, Inc.
     techniques - Partial discharge measurements,                    New York, USA, 2007
     International Electrotechnical Commission, Geneva,
     Switzerland                                                4.   IEC 60599: Edition 3.0, 2015, Mineral oil-filled electrical
                                                                     equipment in service – Guidance on the interpretation
                                                                     of dissolved and free gases analysis

The authors
Udo Ranninger started working for OMICRON electronics
in 2007. He is currently working as an application engineer
focusing on partial discharge measurements after having
had several different positions in the company. He
graduated from the Institute of Higher Technical Education
in Rankweil (Austria) in 2006, where he specialized in
telecommunications and high-frequency technology.

udo.ranninger@omicronenergy.com

Michael Krüger works with OMICRON Energy in Klaus,
Austria since 1999. After working as product manager and
head of engineering services, he is now consulting engineer
for “Testing and Diagnosis of Electric Power Equipment”.
He studied electrical engineering at the Technical University
of Aachen (RWTH), the Technical University of Kaiserslautern
(Germany) and graduated in 1976 (Dipl.-Ing.). In 1990 he
received his PhD in electrical engineering from the Technical
University of Vienna.

Michael Krüger has more than 40 years of experience in
high-voltage engineering and testing and diagnosis on
power and instrument transformers, rotating electrical
machines, Gas-Insulated Switchgear (GIS) and power cables.

He has published more than 50 technical papers about
electrical measurement on power and instrument
transformers, rotating electrical machines, GIS and cables,
and holds 15 patents. He is member of VDE for 40 years,
Cigre and is a Senior Member of IEEE. He also works in
several working groups of OEVE, IEC and Cigre.

michael.krueger@omicronenergy.com

© OMICRON electronics GmbH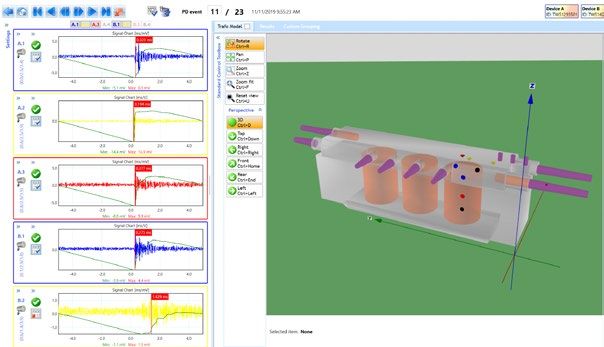
OMICRON is an international company serving the electrical power industry with
innovative testing and diagnostic solutions. The application of OMICRON products
allows users to assess the condition of the primary and secondary equipment on
their systems with complete confidence. Services offered in the area of consulting,
commissioning, testing, diagnosis and training make the product range complete.

Customers in more than 160 countries rely on the company’s ability to supply leading-
edge technology of excellent quality. Service centers on all continents provide a broad
base of knowledge and extraordinary customer support. All of this together with our
strong network of sales partners is what has made our company a market leader in the
electrical power industry.

For more information, additional literature,
and detailed contact information of our
worldwide offices please visit our website.

                                                                                            Published in April 2021
www.omicronenergy.com                                                            Subject to change without notice.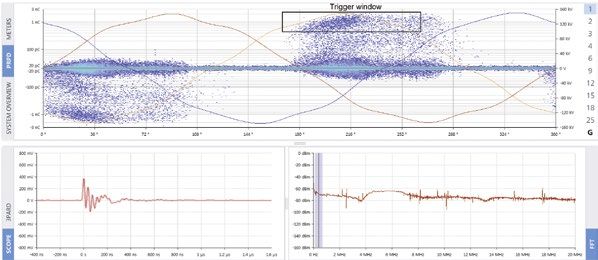

You can also read