SITI Networks Limited - Q3FY19 Investor Presentation - SITI Cable

Page created by Everett Gross
 
CONTINUE READING
SITI Networks Limited - Q3FY19 Investor Presentation - SITI Cable
SITI Networks Limited
                                                      Q3FY19 Investor Presentation

Formerly known as SITI Cable Network Limited
BSE : 532795 | NSE : SITINET | Bloomberg : SCNL:IN | Reuters : SITI.NS
www.sitinetworks.com                                                     SITI Networks Limited – Confidential   1
SITI Networks Limited - Q3FY19 Investor Presentation - SITI Cable
Disclaimer

Some of the statements made in this presentation are forward-looking statements and are based on the current beliefs,
assumptions ,expectations, estimates, objectives and projections of the directors and management of SITI Networks Limited
(SITI Networks) about its business and the industry and markets in which it operates. These forward-looking statements
include, without limitation, statements relating to revenues and earnings. The words “believe”, “anticipate”, “expect”,
“estimate”, “intend”, “project” and similar expressions are also intended to identify forward looking statements. These
statements are not guarantees of future performance and are subject to risks, uncertainties and other factors, some of which
are beyond the control of the Company and are difficult to predict. Consequently, actual results could differ materially from
those expressed or forecast in the forward-looking statements as a result of, among other factors, changes in economic and
market conditions, changes in the regulatory environment and other business and operational risks. SITI Networks does not
undertake to update these forward-looking statements to reflect events or circumstances that may arise after publication.

                                                                                                 2
SITI Networks Limited - Q3FY19 Investor Presentation - SITI Cable
SITI Networks Declares Strong Q3FY19 Results

                                  3
SITI Networks Limited - Q3FY19 Investor Presentation - SITI Cable
SITI Networks Declares Robust Q3FY19 Results
           •       Operating EBITDA leaps 1.9x y-o-y & 1.4x q-o-q to Rs.930 Mn

           •       Operating EBITDA Margin jumps 1.7x y-o-y & 1.3x q-o-q to 24.5%

           •       Subscription Revenue surges 21% y-o-y to Rs.2571 Mn

           •       Total Revenue1 rises 12% y-o-y to Rs.3790 Mn

           •       Digital Subscriber ARPU leaps 19%

           •       SNL Subscription Collection Efficiency @ 94%

1. Excluding Activation                                                             4
SITI Networks Limited - Q3FY19 Investor Presentation - SITI Cable
9M Performance: Growth momentum continues
          •       Operating EBITDA leaps 2.2x to Rs.2,161 Mn

          •       Operating EBITDA Margin jumps 937 bps to 20%

          •       9M EBITDA surpassed FY18 performance: Driven by strong subscription growth

          •       Subscription Revenue surges ~24% to Rs.7,268 Mn

          •       Total Revenue1 rises 16% to Rs.10,820 Mn

1. Excluding Activation                                                5
SITI Networks Limited - Q3FY19 Investor Presentation - SITI Cable
Industry Overview

                    6
SITI Networks Limited - Q3FY19 Investor Presentation - SITI Cable
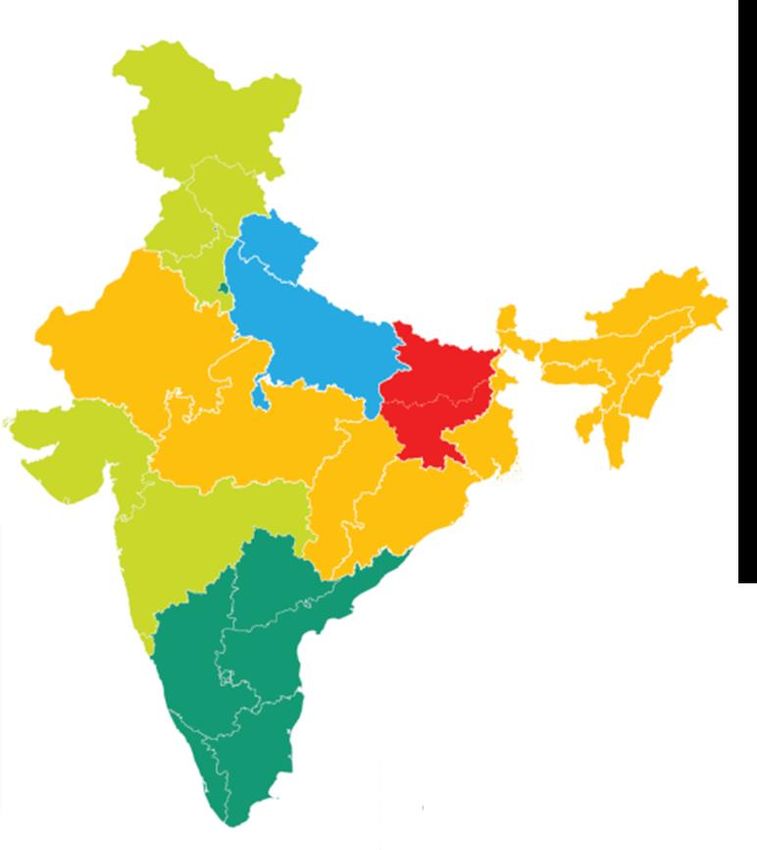
India C &S Market Overview
             TV Households are Growing Faster than the Universe

                           2016                        2018                                                1%
                                                                                                      Terrestrial
                                                                    10%
                                                               Analog Cable
                                                                                                                    44%
                                                                                                                    Digital Cable

    Total HH            286 Mn                      297 Mn        13%
                                                               Free Dish

                                                                                      197 Mn TV
                                                                                      Households
      TV HH             183 Mn                      197 Mn         31%
                                                                 Paid DTH

                            Penetration of TV HH has gone up               Cable (Digital + Analog) controls
                            from 64% in 2016 to 66% in 2018                54% of India’s TV market

Universe Update BARC India July 2018                                                        7
SITI Networks Limited - Q3FY19 Investor Presentation - SITI Cable
TV Homes Penetration
               Maximum Growth in East & South India | Small Towns & Rural are key drivers of Growth

                                 # Growth in TV Penetration
                                                                                           # TV Owning HH (Millions)
                                 – Major Contributors

                                                                         21%
                                                                      North East
                                              24%
                                     Bihar / Jharkhand

                                                         12%
                                                         Odisha

                                            11%
                                     AP/Telangana
        9%
   Karnataka

                                                                                   Most Growth in TV Penetration in
                                                                                   DAS Phase 3 & 4 areas
Universe Update BARC India July 2018 | Growth has been measured over 2016 report                            8
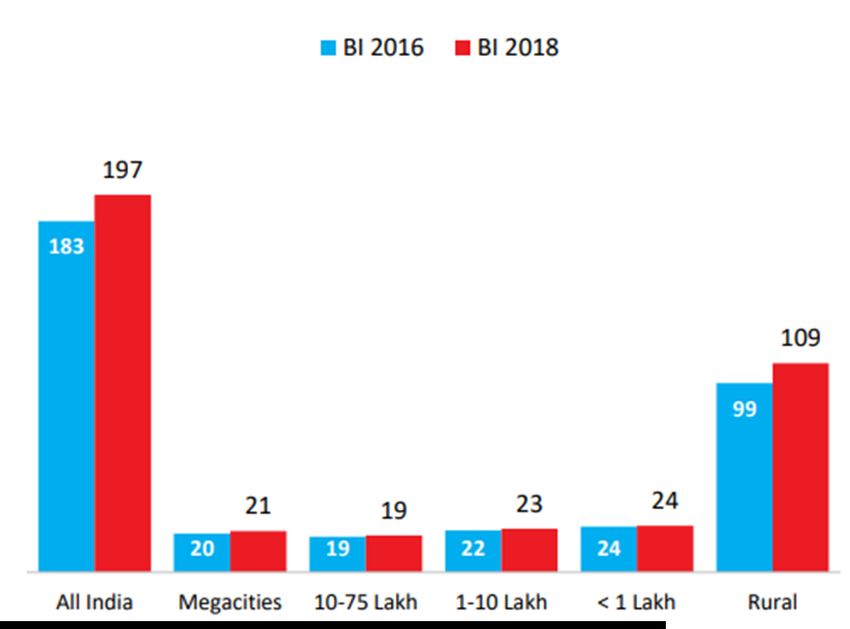
SITI Networks Limited - Q3FY19 Investor Presentation - SITI Cable
SITI Networks                                                       06                                                 01
               Well Positioned to Benefit from Tariff Order
                                                                                           Increase                   Consumer
                                                                                         dependence                  ARPU’s to rise
                • Subscribers pay Phase neutral Minimum Rental of                        on systems /
                                                                                          processes
                  INR130 for 100 FTA SD channels; Can take additional
                  FTA channels in bundles of 25 channels for INR20
                  each
Subscription

                • True A-La-Carte: Discounts on Bouquets restricted to    05                                                                   02
                  15% of A-La-Carte price of Pay channels                         Increase
                                                                                                        New                   Content Cost
                • HD Channels priced at =5% to =10% to =15% to =20% - No Carriage Fee to be charged                   Implementation of the network distribution model will
                                                                               shift the balance of power in favour of DPOs
                                                                                                                 9
Company Overview

                   10
• India’s Leading Digital TV Network
• Present in 22+ States & UT across India
• Footprint across 580+ locations
• Delivering content to 55 Mn+ consumers 24/7
                                                11
SITI Networks
          India’s Leading Digital TV Network

                                                      11.55 Mn                     580+                 4.24 Lakh                  1.7 Mn
                                                    Active Digital               Locations           High Definition             Broadband
                                                     Customers                   Footprint             Customers                Home Passes

                                                                      55 Mn+                  ~7%                   1.61 Lakh
                                                                     Consumers           TV Households             Broadband
                                                                      Reached               in India               Customers

                              1st MSO launched in        1st MSO to give CRM         1st MSO listed on Stock   1st MSO to launch local         Nation-wide
                                     India                   tool to Partners              Exchange                  channels                  Distribution

                                                                                                                                                   24,000+ strong

                         01      Launched in
                                 1994                02      OYC tool customer
                                                             offered to LCOs          03     SITINET listed
                                                                                             on NSE            04      Bouquet of Local
                                                                                                                       Channels               05   Distribution Network

All metrics as of 31st Dec. 2018 | Does not include Analog
SITI Networks
            11.55 Mn Happy Households across the country

                                                               DAS Phase 1
                                                           1   1.6 Mn

                                                               DAS Phase 2
                                                           2   1.5 Mn

                                                               DAS Phase 3
                                                           3   3.8 Mn

                                                               DAS Phase 4
                                                           4   4.7 Mn

All metrics as of 31st Dec 2018| Does not include Analog
SITI Networks
Present across 580+ locations

               Punjab           Uttaranchal

             Haryana            Uttar Pradesh

                                Bihar
                Delhi
                                Assam
                                Nagaland
            Rajasthan
                                Meghalaya
              Gujarat
                                Jharkhand

       Madhya Pradesh           West Bengal

         Maharashtra            Odisha

                                Chhattisgarh

           Karnataka            Telangana

                                Andhra Pradesh

              Kerala
SITI Networks
        Competitive Advantage

01                    02                     03                   04                       05
India’s largest MSO   Using latest MPEG4     OYC Subscriber       In discussion with       Robust corporate
                      STBs                   Management System    various service          governance &
Presence across 580                                               providers for creating   compliance
locations             Broadband through      Conax CAS            value adds for SITI
                      Hybrid (DOCSIS 2/3 &                        base                     Professional
                      GPON) Network          SAP Based systems                             Management

                                             Uniform commercial                            Lean and Agile
                                             policies                                      Organizational
                                                                                           Structure

                                                                                           Value unlocking:
                                                                                           Consolidating MSOs

Country-wide          Superior               Systems and          Strategic                Efficient
Access                Technology             Processes            Alliances                Execution
Promoter Group
          Corporate Structure

      •     Launched in 1926, the Parent Group (“Essel Group”) completed 90 years recently; One of India's leading business
            houses, with a dominant vertically integrated presence in Media and entertainment
      •     Leading producer, aggregator and distributor of Indian programming across the world; 222,000+ hours of original Content
      •     Group Market Cap (Listed entities under the Parent Group): ~USD7.3 Bn
                                                                                                                             Essel Infrastructure
      •     Present in 171 countries, a reach of ~1bn+ viewers; Compelling bouquet of 75 Channels
                                                                                                                             Education: Zee
                                                                                                                             Learn Limited

                                                                                                                             Packaging : Essel
                                                                                                                             Propack

                                                               Dish                       SITI              DNA              Theme Parks: Essel
             ZEE                        ZEE                      TV                      Networks        Newspaper           World and Waterpark

       Entertainment               Media Corp Ltd.                                                                           Precious Metals:
                                                                                                                             Shirpur Gold
          India's Leading                                                                                                    Refinery
            General TV             Strong presence in     Asia’s largest DTH         One of India’s    English broadsheet
           Entertainment           National & Regional   provider after merger      leading National   daily with presence   Healthy Lifestyle &
              Network                 News Genre          with Videocon D2H              MSOs            in major cities     Wellness

                            Content                                       Distribution                       Print           Other Business’
Exchange rate used USD1=INR71.00
Market cap as of 14th Feb. 2019
SITI Networks
             Sizeable Free Float & Institutional Ownership

                                                         1.1%
              3.9%
        Mutual Funds
                                                           Others
                                                                                                 Key Investors
              4.9%                                                  72.2%
                                                                    Promoters
           Individuals

      12.2%                                                                     Foreign
            FII’s                                                               Institutions

         5.6%                 Shareholding Pattern
Indian Companies                872 Mn Shares
                                                                                Domestic
                                                                                Institutions

                                                                                There has been fund infusion of INR6800 Mn by Promoters
                                                                                through OFCDs & Convertible Warrants in Last 2.5 years

     As of 28th Dec 2018
     Others include HUF, Clearing Members, banks, trusts and NRIs
Technology Infrastructure
    Video & Broadband

•   11 Digital Headends; Intra-city OFC and Coax Network of ~33,000 Kms covering ~ 580 locations

•   Transport of Digital CATV signals on 1.2 Gbps links across the country; ~350 IP Points

•   Hybrid (DOCSIS+ GPON) Technology to offer Cable Broadband services

     Digital           Modems              STB’s           Chipsets          Servers         CAS, SMS,   Connectivity
    Headends                                                                                   EPG
Strategy

           19
•   Improve operational efficiencies and
        SITI Networks                           •
                                                    harness inbuilt leverage
                                                    Fungible teams for Cable and
         Video Strategy                             Broadband

                                                               03
                                                                                                     •    Improve extraction from low
                                                                                                          utilized IP based locations and

                                                                                           04
                                                                                                          exiting non-profitable ones
                                                                      Cost
    •   Increase Collection efficiency by
        further implementing Prepaid
        model
                                            02                    Optimization             Improve
                                                                                           Margins
                                            Migrate to
                                             Prepaid
                                                                                                          05
                                      01
                                                                                                         Range of
                                                                                                           STB
                                        Revenue
                                      Enhancement
                                                                                                          •    Moving from SD / HD STB to
•       ARPU enhancement through                                                                               Smart STB (Linux & Android)
        suggestive packs
•       Increase HD Subscriber base
•       TRAI Order Implementation
•       Up-sell HD, OTT Video to
        customers

                                                                                                          20
Financials & Operating Metrics

                                 21
The growth momentum continues in Q3FY19

            Key Performance Indicators                      Vs Q3 FY18

       Subscription revenue for Q3 FY19 at Rs      21% increase in Q3 FY19
       2,571 mn                                    (2,571mn vs 2,118mn)

       Operational expenses for Q3 FY19 at         Expenses Flat in Q3 FY19 (2,860 mn
       Rs 2,860 mn                                 vs 2,873 mn)

       Operating EBITDA Margin improved @          Q3 FY19 margin Up by 1.7x
       24.5%                                       (24.5 % vs 14.8%)

       SNL Subscription Collection Efficiency at   Maintained Collection efficiency
       94% for Q3 FY19                             (94% vs 95% for Q3 FY18 )

       Blended ARPU at Rs 88                       ~19% increase in ARPU

       Operating EBITDA for Q3 FY19 at Rs 930      1.9 x increase in Q3 FY19 EBITDA
       mn                                          (930 mn vs 498 mn)
                                                           22                           22
Q3 FY19
                Robust Performance
                # 1.9x Jump in Operating EBITDA                                            # 1.7x leap in Operating EBITDA Margins
                                                                       2,161                                                 24.5%
                                                                                                                                            20.0%
                                                                                            14.8%
                                  992                    930                                               10.6%
                  498

                         FY18                                   FY19
                                                                                                    FY18                             FY19
                                            Q3     9M
                                                                                                                   Q3   9M
                # 12% Jump in Total Revenue1

                                                                        10,820
                                 9,355

                                                                                            •       Q3FY19 Consolidated Revenues at Rs.
                                                        3,790                                       3,790 Mn
                3,371

                                                                                            •       9M Operating EBITDA Margins expanded
                         FY18                                   FY19                                1.9x
                                            Q3     9M

All Numbers in Rs. Mn unless mentioned other-wise. 1. Total Revenue excluding Activation                                     23
Q3 FY19 : Video Business
               Surging Ahead
              # 21% Growth in Video Subscription (INR Mn)                                        # Customer base stable
                                                                               7,268
                                                                                                         11.7      11.8           11.6
                                         5,873

                                                                2,571
                          2,118

                                  FY18                                  FY19
                                                      Q3   9M
                                                                                                        Q1FY19   Q2FY19        Q3FY19

              # Phase-wise ARPU (Rs.) Increase
                                                            142
                   124                                                                      •   9M Subscription revenue grew 24%
                            100                                      103
                                                                               83           •   ARPU increased strongly by 19% YoY
                                      67                                               68
                                                 51
                                                                                            •   Phase 3&4 ARPUs (73% of subscriber base)
                                                                                                have increased 23% and 35% YoY
                              Q3FY18                                    Q3FY19              •   SNL Subscription collection efficiency at 94%
                                  Phase 1    Phase 2       Phase 3      Phase 4

All Numbers in Rs. Mn unless mentioned other-wise                                                                         24
Q3 FY19 : Broadband Business
   Stable performance
   # ARPU has been relatively stable                                         # Average Speed per Customer is steady

         606                                                                       27           27            27
                                        576                        568

                                      DOCSIS
                                                                                 Q1FY19       Q2FY19        Q3FY19
                          Q1FY19       Q2FY19        Q3FY19

 # Average Data Consumption continues to be high
                                                                         •     Net Broadband base at 1.61 Lakhs
                                      118
                                                                 108
          102
                                                                         •     Blended Broadband ARPU was steady at
                                                                               Rs.460

                                                                         •     ~30% of the DOCSIS base converted to
                                                                               long-term lock-in plans
       Q1FY19                       Q2FY19                      Q3FY19
Note: All metrics are for DOCSIS base unless otherwise stated
                                                                                                       25
Thank You

Investor Relations, SITI Networks Limited
           +91-120-452-6754
    Ankit.Saint@siti.esselgroup.com
You can also read