SCANSHIP HOLDING ASA 2H2018 Financial Presentation - Henrik Badin CEO Erik Magelssen CFO
←
→
Page content transcription
If your browser does not render page correctly, please read the page content below
SCANSHIP HOLDING ASA

2H2018 Financial Presentation

         Henrik Badin CEO
        Erik Magelssen CFO
strong growth with all-time high 2H2018

                  183                                 22,9                     656

            147                                                          513
      130                                      16,3                469
117                                     14,6
                                                             360

                                 10,5

      REVENUE                           EBITDA               ORDER BACKLOG

                                                                                     Numbers in NOK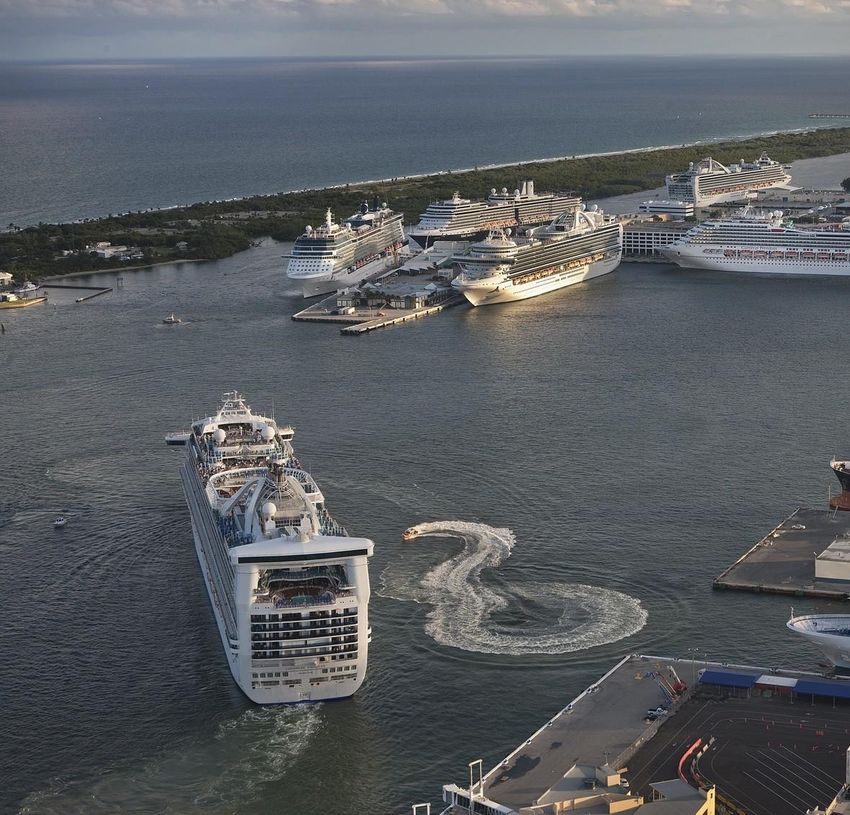
about us

•   technology provider for cleaner oceans in cruise and
    aquaculture industries enhancing UN SDG

•   listed on Oslo Stock Exchange with ticker SSHIP

•   headquartered in Norway with subsidiaries in US
    and Poland

•   well positioned in cruise with environmental
    technologies on more than 100 ships in operation
    and backlog for additionally 36 newbuilds
•   revenues from sale of systems, turnkey retrofits and
    life cycle services
•   waste to energy carbon capture technology in
    pipeline to enable growth in multiple markets

                                                           3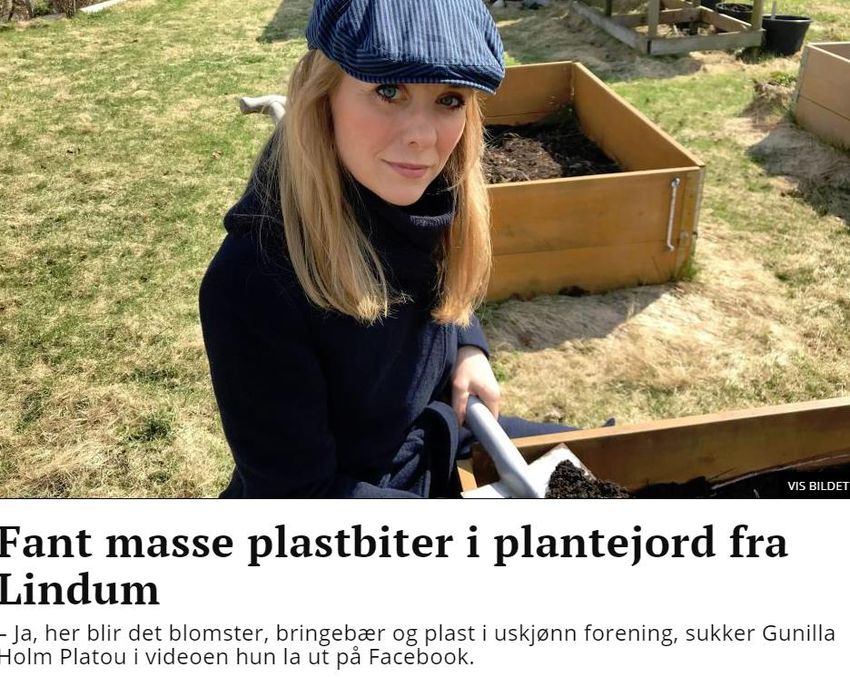
large clients base driven by environmental megatrends

                                                        4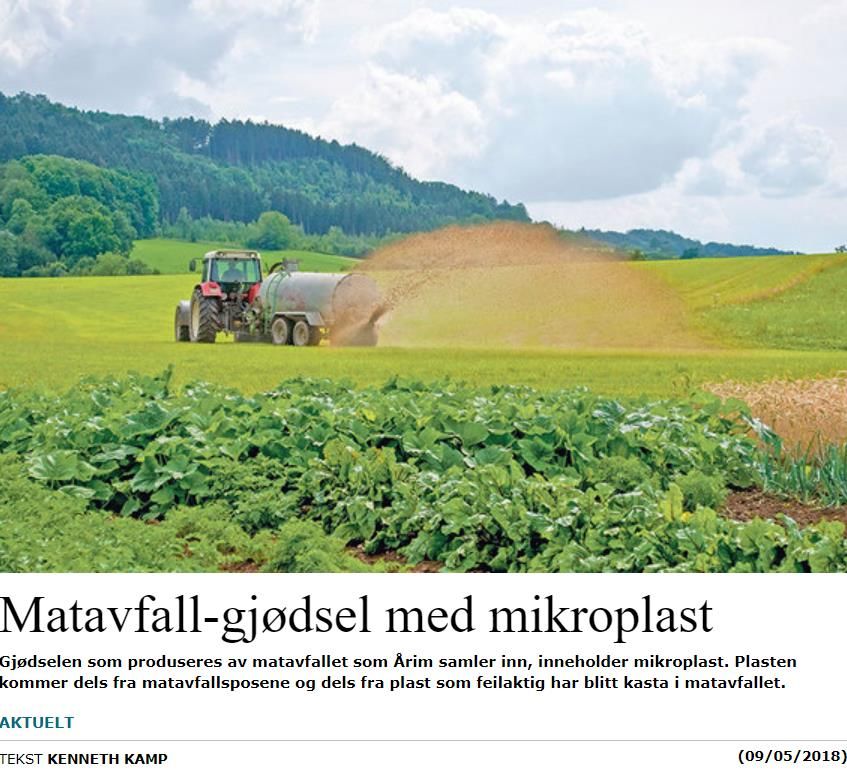
we help our clients meet
  their environmental
 sustainability targets
order backlog
                                                                                                          656
                                                                       700

•   all time high orderbook at 656 MNOK yearend
                                                                       600

                                                                                                   513
    2018 with additional 200 MNOK of options                           500

                                                                                            469

•   strong growth in order buildup, 82% year on year                   400

                                                                                     360

•   order backlog includes equipment deliveries to 36                  300

                                                                              250
    cruise newbuilds on contracts with shipyards, 3                    200

    AWP retrofit turnkey projects with shipowners and
    4 aquaculture projects
                                                                       100

•   provides good forward visibility
                                                                         0

                                                                             2H2016 1H2017 2H2017 1H2018 2H2018

            1) 2018 numbers are presented in accordance with IFRS 15

                                                                                                                Numbers in NOK
financial development 2H yoy
                                                                                           183,1

                                                                      129,8
•   revenues in 2H2018 is MNOK 183.1 representing
    an increase of 41% yoy
                                                                                                   EBITDA
•   EBITDA in 2H2018 at MNOK 22.9 representing                                                      12.5%

    an increase of 57% yoy
                                                                          EBITDA
•   EBITDA margin for the period at 12.5% and                              11.2%

    improvement from 11.2% same period last year
                                                                                                        22,9
                                                                                   14,6

                                                                         2H2017               2H2018

                                                                       Revenue (MNOK)     EBITDA (MNOK)
           1) 2018 numbers are presented in accordance with IFRS 15
financial development FY yoy
                                                                                             329,6

•   revenues for FY2018 is MNOK 329.6                                  247
    representing an increase of 33% yoy
•   EBITDA for FY2018 at MNOK 39.2 representing
                                                                                                  EBITDA
    an increase of 56% yoy                                                                         11.9%

•   EBITDA margin in 2018 was 11.9%, and
                                                                             EBITDA
    improvement from 10.2% reported for 2017                                  10.2%

•   generates healthy profits from existing market
    supporting self-financed growth                                                                    39,2
                                                                                      25,1

                                                                         FY2017                  FY2018

                                                                       Revenue (MNOK)        EBITDA (MNOK)
            1) 2018 numbers are presented in accordance with IFRS 15
2H2018 P&L
                                                                                                       Unaudited      Unaudited
                                                                       (MNOK)                            2H 18          2H 17

•   strong second half year with significant                           Revenue
                                                                       Total operating revenue
                                                                                                              183.1
                                                                                                              183.1
                                                                                                                            129.8
                                                                                                                            129.8
    improvements
                                                                       Cost of goods sold                    -128.5         -88.5
•   revenue increasing 41 % from 2H 2017, all-time high                Gross Profit                            54.6           41.3

•   mix of projects and aftersales between the periods
                                                                       - Gross Margin                       29.8 %         31.8 %

    giving variance in GM%, however in line on yearly                  Employee expenses                     -19.6          -15.7
    average                                                            Other operating expenses              -12.0           -11.0
                                                                       EBITDA                                 22.9           14.6
•   operating expenses increasing according to plan                    - EBITDA margin                      12.5 %         11.2 %

•   improved EBITDA margin                                             Depreciation and amortisation
                                                                       Operating result (EBIT)
                                                                                                              -2.2
                                                                                                              20.7
                                                                                                                             -2.0
                                                                                                                             12.6

                                                                       Net Financial items                    -3.0           -2.9

                                                                       Result before tax                       17.7           9.7

            1) 2018 numbers are presented in accordance with IFRS 15
FY2018 P&L
                                                                                                       Unaudited     Audited
                                                                       (MNOK)                           FY 2018      FY 2017

•   continuing strong growth path
                                                                       Revenue
                                                                       Total operating revenue
                                                                                                             329.6
                                                                                                             329.6
                                                                                                                          247.0
                                                                                                                          247.0

•   revenue increasing 33 % from FY 2017, driven by                    Cost of goods sold                   -229.8        -171.2
    growth both within Projects and Aftersales                         Gross Profit                           99.8         75.9

•   significant improvement in operational efficiency
                                                                       - Gross Margin                       30.3 %       30.7 %

    increasing the EBITDA margin to 11.9 %                             Employee expenses                     -37.3        -29.0
                                                                       Other operating expenses              -23.3        -21.8
•   EBITDA at MNOK 39.2 representing an increase                       EBITDA                                 39.2         25.1
    of 56 % from 2017                                                  - EBITDA margin                      11.9 %       10.1 %

•   lower net financial cost in 2018 contributing to an                Depreciation and amortisation
                                                                       Operating result (EBIT)
                                                                                                              -3.4
                                                                                                              35.8
                                                                                                                               -3.2
                                                                                                                               21.9
    increase in result before tax of 87 %
                                                                       Net Financial items                    -2.3         -4.0

                                                                       Result before tax                      33.4             17.9

            1) 2018 numbers are presented in accordance with IFRS 15
Unaudited Audited
(MNOK) 31.12.18 31.12.17
balance sheet ASSETS:
Total non-current assets 41.6 33.7
Current assets:
• non-current assets includes MNOK 38.3 in Inventories
Trade receivables
4.5
62.6
3.9
58.8
intangible assets, in which the MAP system is the Contracts in progress 62.5 43.3
most significant Other Receivables 15.9 10.1
Cash and cash equivalents 7.0 5.6
• non-current liabilities primarily consist of deferred
Total current assets 152.4 121.6
tax liability of MNOK 14.0 Total assets 194.0 155.3
• improved cash flow from operations has reduced EQUITY AND LIABILITIES
Total equity 93.3 57.9
the drawn amount on the short-term credit
facilities. Total non-current liabilities 14.9 8.3
• net cash position per 31.12.18 Current liabilities
Trade creditors 44.0 47.6
• significantly improved equity level, equity ratio at Contract accruals
Financial instruments
25.7
3.4
10.6
1.5
48 % per 31 December 2018 Income tax payable -0.3 1.4
Bank overdraft / Credit facility 2.1 20.8
Other Current liabilities 10.9 7.1
Total Current Liabilities 85.8 89.0
Total liabilities 100.7 97.4
Total equity and liabilities 194.0 155.3cash flow statement
• strong cash flow from operations
Unaudited Audited
• significant improvements in the net working (MNOK) 2018 2017
capital in the group, and increased EBITDA level Result before tax 33.4 17.9
• higher investment level on the MAP system in Net cash flow from operating activities 31.1 10.1
2018 Net cash flow from investing activities -11.4 -4.8
• cash flow from financing activities includes the
Net cash flow from financing activities
Net change in cash and cash equivalents
-18.5
1.2
-3.3
2.0
reduction in the bank overdraft Effect of exchange rate changes on cash 0.2 -0.2
• BOD recommends dividend payment
Cash and cash equivalents at start of period
Cash and cash equivalents at end of period
5.6
7.0
3.8
5.6
1) 2018 numbers are presented in accordance with IFRS 15NUMBER OF SHARES % OF TOTAL TYPE COUNTRY
INGERØ REITEN INV. COMPANY AS 31,500,000 32.94% Comp. NOR
largest shareholders BADIN INVEST LIMITED 10,500,000 10.98% Comp. NOR
DALER INN LIMITED 10,500,000 10.98% Comp. NOR
EXPROCO LIMITED 10,500,000 10.98% Comp. NOR
TRETHOM AS 4,211,111 4.40% Comp. NOR
GOLDMAN SACHS INTERNATIONAL 2,408,246 2.52% Nom. GBR
VICAMA AS 1,812,500 1.90% Comp. NOR
• management and board invested in Scanship FONDSAVANSE AS 1,562,500 1.63% Comp. NOR
BERGEN KOMMUNALE PENSJONSKASSE 1,500,000 1.57% Comp. NOR
• management with CEO, COO and CDO holds total DZ PRIVATBANK S.A. 1,150,000 1.20% Nom. LUX
MP PENSJON PK 1,028,225 1.08% Comp. NOR
31.500.000 shares
CITIBANK, N.A. 905,904 0.95% Nom. USA
• chairman and board member holds total 31.500.000
THOM EIGEL INGVAR
TRAPESA AS
841,111
713,000
0.88%
0.75%
Priv.
Comp.
NOR
NOR
shares PUNTE HOLDING AS 550,000 0.58% Comp. NOR
BIRKELAND ODD KNUT 500,000 0.52% Priv. NOR
SKANDINAVISKA ENSKILDA BANKEN AB 500,000 0.52% Nom. FIN
TOR H BJØRNSTAD AS 457,706 0.48% Comp. NOR
SWENSEN HARALD 415,000 0.43% Priv. NOR
BAUMANN INVEST AS 400,000 0.42% Comp. NOR
OTHERS 13,685,222 14.31%
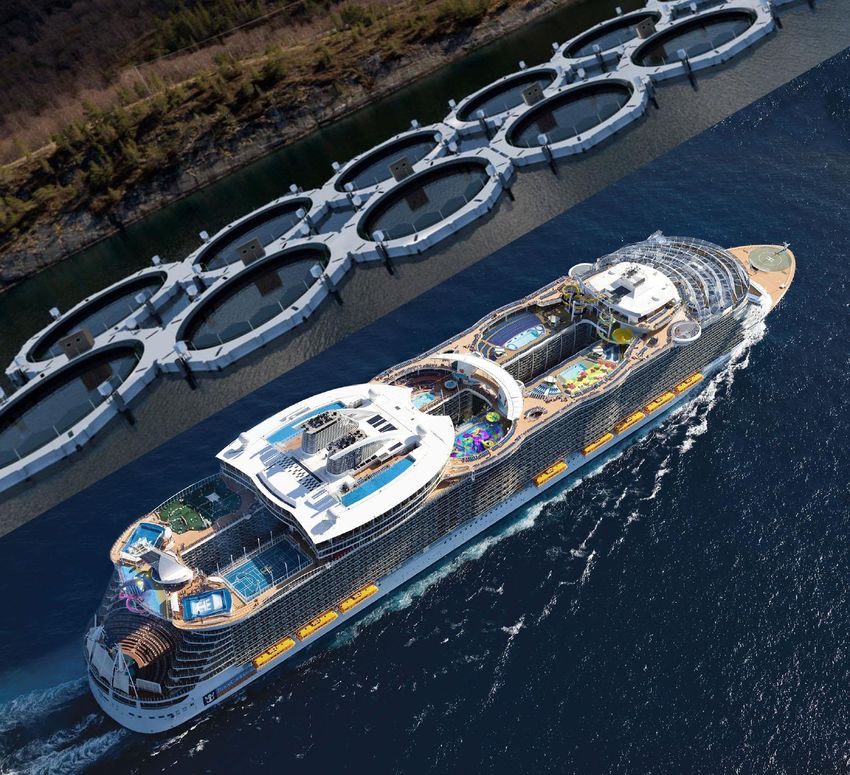
TOTAL NUMBERS OF SHARES 95,640,525 100%growth in cruise
• tripled in size last twenty years reaching 27 million
going cruising in 2018 (CAGR 5.7%) translated into
industry orderbook of 125 newbuilds for delivery
until 2027
• Scanship firm orders on 36 newbuilds, options for 8
vessels and are tendering for additionally 22
newbuilds
• industry under scrutiny many places around the
world and environmental sustainability has become
major growth barrier
• CLIA reports (2018) 53% of global fleet (386 vessels)
equipped with AWP and 7% in compliance with the
new Baltic standard
• shipowners sustainability goals, changes in
regulatory environments combined with overall
industry growth drives markets both in newbuild
and retrofits
14growth in aquaculture
• Norway was farming 1.2 million tons (50%) of global
salmon production in 2018, aiming for 4 million tons
in 2030
• environmental sustainability major fwd growth
barrier
• industry trend towards seabased closed cage farms
and moving production onshore
• the world is running out of mineral phosphorous
and 9000 tons of phosphorous is lost to sea in
Norwegian aquaculture industry (10 times discharge
from municipal wastewater) drives Scanship
technology deployment
• Scanship is on worlds largest smolt facility (Sjotroll)
and to be world largest landbased fishfarm (Atlantic
Sapphire)MAP = w2e + ccs + eow
• proprietary MAP microwave assisted pyrolysis …..waste reduction…..90% reduction of mass….25-130€/wt disposal cost
energy recovery……70% energy recovery…….offset fossil fuel....carbon
technology provides opportunities in multiple markets capture…….30% of biomass captured as biochar……
• pyrolytic process converts garbage, foodwaste,
…1 kg Biochar capture 2-3kg CO2....biochar 250-500€/wt…..
….biochar valorisation……soil improver……
wastewater sludge to energy and bio-char fertilizer….absorbent for soil remediation……..
water cleaning…….gas cleaning
• end-of-waste solution by degrading micropollutants ……….replacing fossil coal in metal production………
and plastics to carbon
• relevant solution to meet maritime industry targets of
50% CO2 reduction
• solution to eliminate the plastic problem on sewage
and foodwaste biogas plants (~40% of 17.400 plants in
Europe are faced with this challenge)
• bio-char acts as sorbent and soil enrichment with
multiple reuse opportunities, provides income along
with carbon offsetsccs carbon capture storage
removing carbon from the carbon cycle – climate change impact
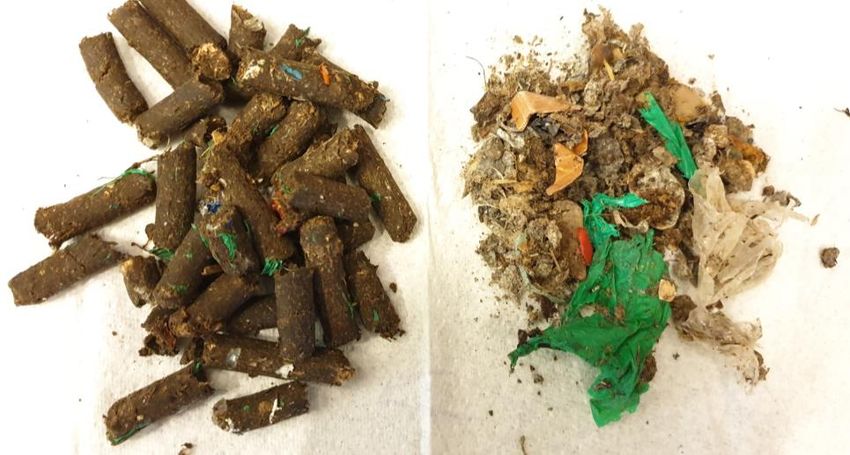
17plastic residues in biofertilizer – the new plastic whale?
Hullet i gjødselvareforskrifta
Gjødselprodusentene er i dag pliktige til å følge gjødselvareforskrifta. Den sier at gjødselen skal inneholde maksimalt
0,5 prosent plast-, glass-, og metallbiter med en størrelse på mer enn fire millimeter. Når det gjelder mindre biter
enn dette, sier ikke forskrifta noe som helst. Mikroplast er definert som plast som er mindre enn fem millimeter, så
de største mikroplastbitene dekkes av forskrifta, men ikke de som er under fire millimeter. I teorien kan altså
organisk gjødsel selges fullt lovlig selv om den er proppfull av mikroplast.
end-of waste solutionexecutive management team
Henrik Badin Erik Magelssen Jonny Hansen Bjørn Abraham Bache Asgeir Wien Henning Mohn
Chief Executive Officer CEO Chief Financial Officer CFO Chief Operating Officer COO Chief Commercial Officer CCO Chief Development Officer CDO Chief Technical Officer CTO
After joining Scanship in 2001 Before joining Scanship in 2017, Mr. Hansen joined Scanship in Mr. Bache joined Scanship Mr. Wien has held technical and Before being appointed as CTO
and serving various Mr. Magelssen has more than 15 2006 and became COO in 2007 February 2018. He has more than R&D positions with Scanship in Scanship in 2016, Mr. Mohn
management positions in years of experience as CFO in until the end of 2012. Coming twenty-five years of experience since 2002. He has more than 25 held other manager roles in
Scanship Environmental, Mr. the companies VIA Travel Group out of employment as COO in from international business, years’ experience within Scanship and positions with
Badin was appointed CEO of ASA and Kongsberg Automotive Vissim and VP Supply Chain in serving in leading positions in advanced tertiary waste water DNVGL, NIVA Norwegian
Scanship in 2008. Mr. Badin has ASA. He also held the position of OceanSaver, he rejoined companies like treatment, potable water Institute for Water Research and
20 years of experience related to Group Finance Manager in Wilh. Scanship in 2017 as responsible Unitor/Wilhelmsen, Mettler- production, bio-residue Eurofins laboratory. He has 22
environmental engineering Wilhelmsen ASA. Mr. Magelssen for strategic initiatives. In April Toledo, Jotun and Elkem. During treatment, garbage handling years of experience related to
onshore and in the maritime has a BA degree from Heriot 2018 he returned to the COO his career, he has lived 13 years and R&D studies. Mr. Wien holds environmental engineering and
industries. He holds a Master of Watt University in Edinburgh, position. Mr. Hansen holds a outside Norway. Mr. Bache a Master of Science degree in from the international maritime
Science degree in Civil and has attended the Norwegian mini MBA DIP from Probana holds a Master of Science Civil engineering from NTH industry. Mr. Mohn holds a
engineering from NTH (NTNU). School of Economics, NHH (CPA, Business School. degree in Mechanical (NTNU) and an engineering Master of Science degree in Civil
“Statsautorisert revisor”) and the Engineering from Glasgow degree in Aquaculture. engineering from NTH (NTNU)
Executive education program at University. and a Master of Science degree
Harvard Business School. from the University of
Washington in Environmental
engineering.Thank you for the attention !
www.scanship.noYou can also read