Strong growth in project backlog and pipeline - Second quarter 2021
←
→
Page content transcription
If your browser does not render page correctly, please read the page content below
Second quarter 2021
Strong growth in project
backlog and pipeline
Disclaimer

    The following presentation is being made only to, and is only directed at, persons to whom such presentation
    may lawfully be communicated (’relevant persons’). Any person who is not a relevant person should not rely, act
    or make assessment on the basis of this presentation or anything included therein.
    The following presentation may include information related to investments made and key commercial terms
    thereof, including future returns. Such information cannot be relied upon as a guide to the future performance of
    such investments. The release, publication or distribution of this presentation in certain jurisdictions may be
    restricted by law, and therefore persons in such jurisdictions into which this presentation is released, published or
    distributed should inform themselves about, and observe, such restrictions. This presentation does not constitute
    an offering of securities or otherwise constitute an invitation or inducement to any person to underwrite,
    subscribe for or otherwise acquire securities in Scatec ASA or any company within the Scatec Group. This
    presentation contains statements regarding the future in connection with the Scatec Group’s growth initiatives,
    profit figures, outlook, strategies and objectives as well as forward looking statements and any such information
    or forward-looking statements regarding the future and/or the Scatec Group’s expectations are subject to
    inherent risks and uncertainties, and many factors can lead to actual profits and developments deviating
    substantially from what has been expressed or implied in such statements.
    The following presentation contains unaudited pro forma financial information which has been prepared solely
    for illustrative purposes to show how the acquisition of SN Power might have affected the financials of the group
    if the acquisition had occurred at an earlier date. All pro forma financials in this presentation are unaudited.
    Alternative performance measures (APM) used in this presentation are described and presented in the second
    quarter and first half 2021 report for the group.

2
Agenda
    • Highlights and project update
        Raymond Carlsen, CEO
    • Financial review
        Mikkel Tørud, CFO
    • Market & outlook
        Raymond Carlsen, CEO

3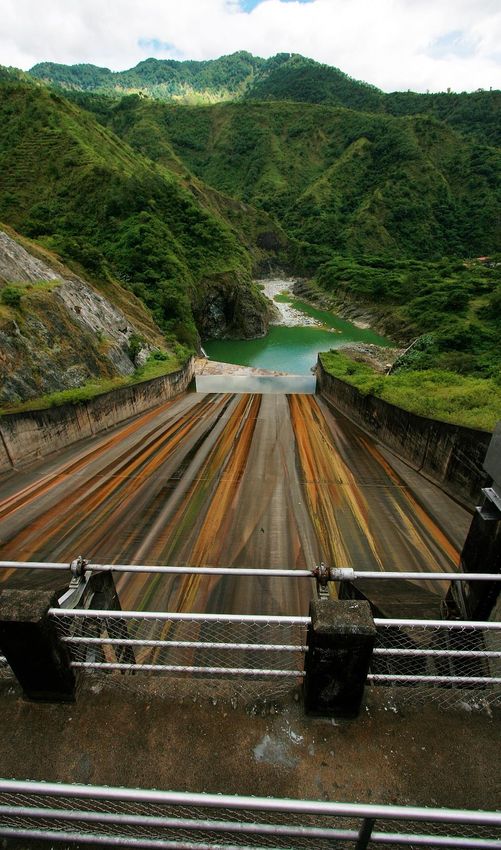
Q2’21
    Strong growth in project backlog and pipeline
                                                                                                  Power production (GWh)

    •    Power production of 860 (406) GWh and EBITDA¹ of                                                    2.1x
         NOK 601 (417) million                                                                                       860

    •    2.6 GW added to project backlog and pipeline
    •    First large-scale hybrid (540 MW solar + storage)
         project awarded in South Africa
    •    Entering the Indian market – secured 900 MW solar
         plant with local partner                                                                   406

    •    Moving into offshore wind in Southeast Asia
    •    320 MW in Ukraine and Argentina started commercial
         operation in July

                                                                                                   Q2 2020          Q2 2021
    1) EBITDA and other alternative performance measures (APMs) are defined and reconciled as a
    part of the APM section of the second quarter and first half 2021 report on pages 42-45.
4
Another 203 MW in commercial operation in Ukraine – 336 MW total

      Progressovka, 148 MW                            Chigirin, 55 MW
      •   Annual production: 184 GWh                  •   Annual production: 64 GWh
      •   70,000 tonnes GHG emissions to be avoided   •   25,000 tonnes GHG emissions to be avoided
      •   76,000 households to be powered             •   28,000 households to be powered

5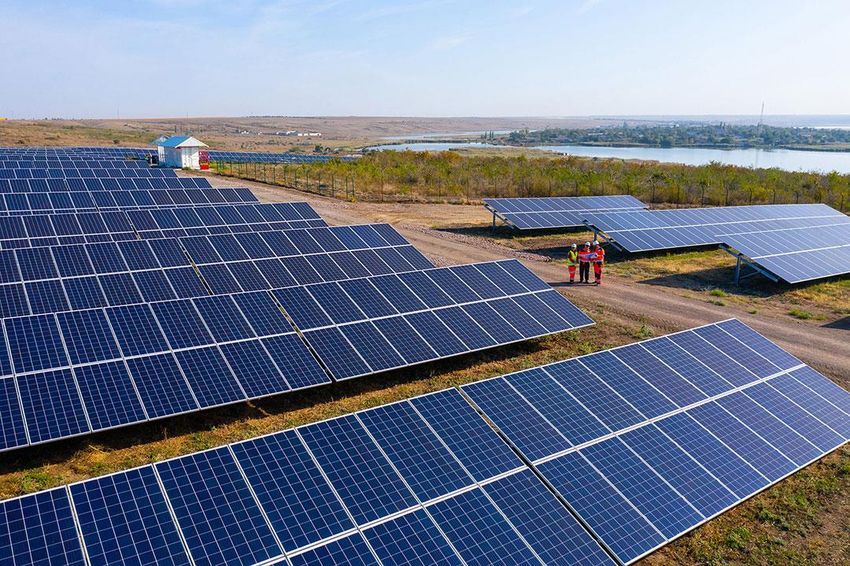
The 117 MW Guanizuil project
    in commercial operation

    • Scatec’s first power plant in Argentina and
      the second largest solar plant in the country
    • The plant is owned and operated 50% by
      Scatec and 50% by Equinor
    • Annual production: 305 GWh
    • GHG emissions avoided: 98,000 tonnes/year
    • Green energy for 80,000 households

6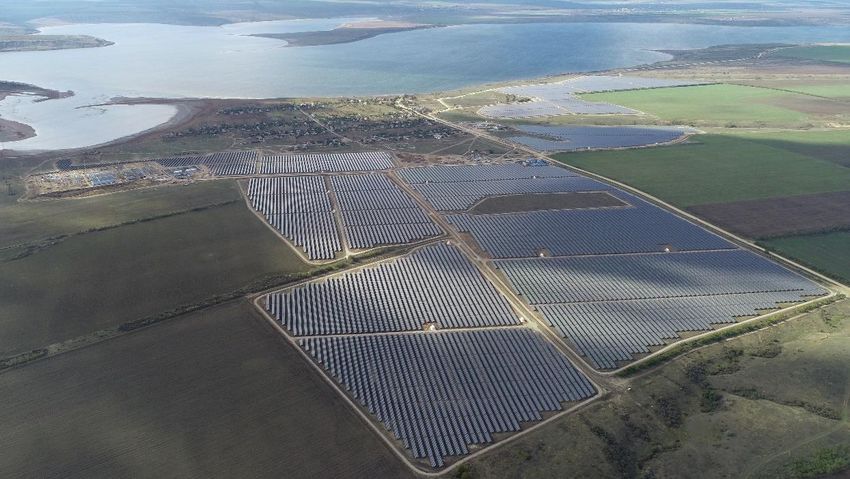
ESG ambitions                   Key focus areas

    32 ESG targets for 2021                 Lifecycle management
    shared in our 2020                      Strategy for lifecycle management of equipment
    Sustainability report
    • Status on 1H’21 performance
      available in the Q2 report            Climate target
                                            Climate roadmap to reach 2050 targets

                                            Responsible supply chain
                                            ESG risk and close engagement with key suppliers

                                            Human rights
                                            Strengthen due diligence and training to exposed groups

7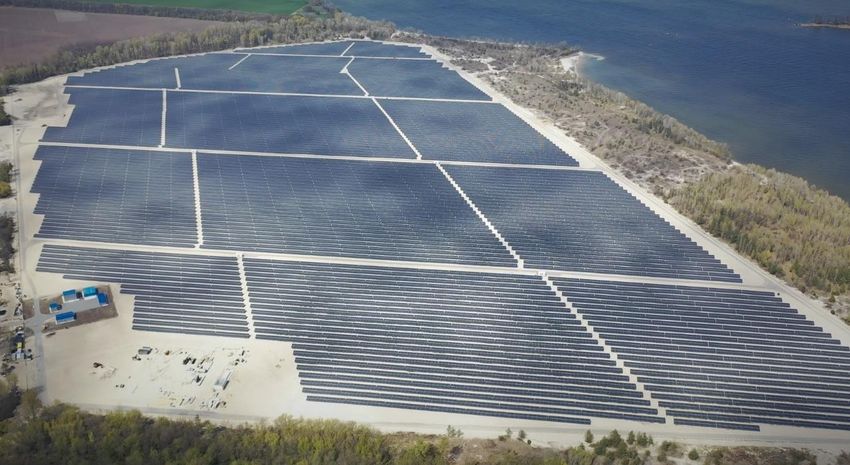
EU Taxonomy:
    Low GHG emissions for Scatec’s operating hydropower assets

    • Lifecycle GHG emissions* from reservoirs
      estimated by independent third party,
      International Hydropower Association (IHA)
    • Threshold for lifecycle emissions in the Taxonomy:
      100 gCO2/kWh
    • Lifecycle emissions estimates for Scatec’s
      reservoirs: ranging from 1.2 – 21.6 gCO2/kWh
    • “Do no significant harm assessment” in process

                                                                                                         Nam Gnouang Reservoir, TPHC, Lao PDR

    *Lifecycle GHG emissions: Assessment of greenhouse gas emissions during the entire value chain of a project.
8
Financial review
Mikkel Tørud, CFO

                    9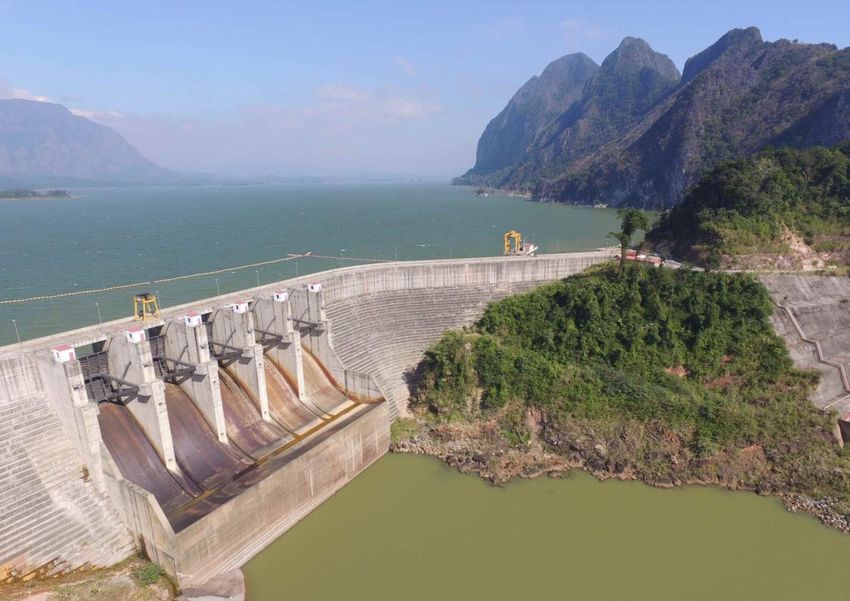
Strong growth in revenues and EBITDA

     Proportionate financials
     Quarterly (NOK million)                                              Last 12 months (NOK million)
                                                                                             4,956
        Cash Flow to Equity            EBITDA            Revenues

                                                                                                                   3,165
                                                      1,101

                                925

                                                                                                           1,780
                                              601                                    1,630

                        417
                                                                                                     808
                                                                               683
                  158                   177

                        Q2 20                 Q2 21                                  Q2 20                 Q2 21

 EBITDA
 margin                 45%                   55%                                    33%                   56%

      CF to equity in Q1’21 includes NOK 397 million from refinancing of the assets in the Philippines.
10    The 2021 figures include assets from the acquisition of SN Power.
Power Production
Strong increase in power production
Comments
Quarterly (NOK million) Last 12 months (NOK million) • New hydro assets with revenues of
CF to equity EBITDA Revenues
2,751 NOK 504 million and EBITDA of NOK
292 million
2,063
• EBITDA decreased by NOK 44 million
from Q1, mainly explained by a
1,557
seasonal dryer period and lower own
969
1,301
production in the Philippines
660
1,120 • Solar assets with fairly stable revenues
458
and EBITDA generation year on year
374
466
252
135
Q2 20 Q2 21 Q2 20 Q2 21
EBITDA
margin 82% 68% 84% 75%
11 CF to equity
equity: in Q1’21 includes NOK 397 million from refinancing of the assets in the Philippines.Services
Stable financial performance
Comments
Quarterly (NOK million) Last 12 months (NOK million) • Stable contract portfolio
230 • Underlying EBITDA broadly in line
CF to equity EBITDA Revenues 222
with last year
• EBITDA in Q2 last year included a
one-off catch up of NOK 14 million.
73
68
89
72 73
34 58
27 24
19
Q2 20 Q2 21 Q2 20 Q2 21
EBITDA
margin 47% 35% 40% 32%
12Development & Construction
Strong project development focus
Comments
Quarterly (NOK million) Last 12 months (NOK million) • Revenues decreased with lower
construction activity
CF to equity EBITDA Revenues
3,141
• Construction started on the 150 MW
302
245
Sukkur project in Pakistan
383
• Continued high project development
151
activity with major projects in South
Africa, India and Brazil
• 1,440 MW matured and moved to
51
19 22 backlog in the quarter
-134
-37 -54 -178
Q2 20 Q2 21 Q2 20 Q2 21
Gross
margin 14% 14% 14% 11%
EBITDA
margin 6% NA 10% NA
13Update on the Ukraine portfolio
• Commercial operation achieved for the whole asset
portfolio – 336 MW
• Loan agreements to be adjusted based on revised cash
flows - in principle agreement in place with lenders for
Kamianka and Boguslav - implementation in 2H 2021
• In compliance with all loan agreement covenants for
the whole portfolio at end of Q2 2021
14A solid financial position
Consolidated financial position (NOK million)
As of 31.12.2020 As of 30.06.2021
• Group free cash of NOK 2,361 million 33,213 33,213
• Available undrawn credit facilities NOK 1,588 million 5,751
9,681
• Group* book equity of NOK 11,061 million 26,663 26,663
9,074 2,480
9,467
(NOK Project Group Total
Consolidated
million) level level* prop.
3,495
27,463
Cash 4,192 1,664 2,361 4,025
21,052
Debt -19,530 -12,539 -7,179 -19,718 17,590
13,701
Net debt -15,337 -10,875 -4,818 -15,693
Assets Equity & Assets Equity &
Liabilities Liabilities
(*) Defined as ‘recourse group’ in the corporate bond and loan agreements, where Current assets Equity Non-current liabilities
restricted cash is excluded. Non-current assets Current liabilities
15 15Q2’21 movement of the Group’s free cash
NOK million
19 -57
-37 -86
206 -101 -173
-143
-185
2,918
2,361
End Q1 21 Distributions Cash flow to Cash flow to Cash flow Project equity Project Dividend Net cash Working End Q2 21
from operating equity D&C equity Services to equity Development distribution consideration Capital/other
power plants Corporate capex from
acquistion of
Movement of cash in ‘recourse group’ as defined in the corporate bond and loan agreements. SN Power
16Staying selective when investing
• Focus on capital discipline
• Power Production: Avg. Equity IRR on investments: 12-16%
• 30-year cash flows
• Average across technologies, regions & currencies
• Development & Construction gross margin: 10-12%
• D&C revenues expected to average 50-70% of project
capex dependent on Scatec’s role in the project
17Scatec - 2021 Guidance
Power Production (GWh) Development & FY2021 Services FY2021 Corporate
Proportionate production volume* Construction
Q3 2021: FY 2021: End of Q2’21: Revenues EBITDA
970-1,040 3,600 - 3,750 Remaining, not NOK 260 million NOK -110 million
booked, construction
Up from 430 Up from 3,045 contract value EBITDA margin:
in Q3 2020 in 2020 NOK 490 million 30-35%
Based on seasonal variations, the EBITDA
from the Philippines in second half 2021
is normally 20-30% higher than in first
half of the year.
(*) Guidance based on production from plants in operations at the end of second quarter 2021..
18Market & outlook
Raymond Carlsen, CEO
19BNEF’s Green scenario
The world to be powered by renewables in 2050
4.6x 89% Fossil fuels from USD 840 bn
Increase in global Power generation 68% to 13% Annual renewables
electricity demand covered by of final energy investments²
(from 2019) renewables consumption¹
Source: Bloomberg New Energy Outlook 2021.
1) Total energy consumed by end users,.
20 2) Annualised based on BNEF’s mid point invstment estimate.IEA report: Hydropower - a critical
contributor to the green energy transition
• Additional 477 GW of hydropower capacity needs to be
built globally by 2030 to achieve IEA’s net zero scenario
• 75% of capacity from large-scale projects in Asia and Africa
• Until 2030, USD 127 billion – or ¼ of investments in
modernising ageing plants
• Hydropower can be stored and be dispatched to match
demand as well as provide system stability
• Combined with wind and solar, hydropower offers
unmatched flexibility in renewable power production
• Scatec well positioned:
• Hydropower and hybrids project pipeline of 3.3 GW
• Track record across multiple technologies
IEA: International Energy Agency
21Technology integration strengthens renewables & expands market potential
Firm Renewable Power Hybridising PV and hydro Release Power to X
PV and/or wind with PV installations mounted Redeployable PV systems Competitive renewable
battery storage to provide on floating supports on to replace diesel and HFO power as enabler of
stable renewable power the artificial basin of a generators as standard infrastructure and
hydro dam solution industrial projects
22Project backlog & pipeline of more than 14 GW
Pipeline
Europe & Central/
South Asia
1,307 88
20 %
MW
3%
49 %
Africa & Southeast Asia
21 % Middle East
7% 4,230 418
Latin America 6,714
MW
1,608
Solar Hybrid solutions MW
2,118
Wind Release 692
MW
Hydro
All figures are as of Q2 2021 reporting date.
23Solar+storage hybrid project in South Africa The project:
A breakthrough for our large scale • Government requirement: Deliver 150 MW
hybrid solutions capacity between 5:00am and 21:30pm – all year
• Scatec’s solution: A 540 MW solar plant +
225MW/1140MWh Storage facility
• The Kenhardt project will be one of the largest PV • Ca. USD 1 billion capex investment
and battery plants in the world • Fixed ‘Capacity Payments’ over 20 years
• Project competed successfully in a technology
agnostic bidding process
• The only bid exclusivity making use of renewable
energy technology
• Our integrated approach strengthens
competitiveness of renewables and expands
market potential
24Entering India with 900 MW
– a key growth market for renewables
• Scatec has partnered with ACME, a leading solar
developer, to realise a 900 MW solar plant in India
• Pursuing long-term partnerships and upcoming
tenders/auctions
• India is targeting 450 GW of new renewable energy
capacity by 2030:
• Opportunities for large-scale renewables, including
hydropower and hybrid solutions
• Round-the-clock tenders, corporate PPAs and hydrogen
• Indian operation up and running
25Scatec moves into offshore wind in Southeast Asia
• Vietnam and the Philippines our key focus
• Attractive offshore wind conditions
• Aggressive long term renewable energy growth plans
• Target to secure 4 GW of development rights
• The Philippines
• 750 MW of exclusive development rights signed with
the Dep. Of Energy
• Another 1 GW of development rights expected to be
awarded and signed in second half 2021
• Vietnam
• Sites for 2 GW under development
• Development rights to be awarded post PDP8
announcement
26Realising 15 GW by end of 2025
• Delivering on 2021 targets
• Construction activity ramping up 2H’21
• Positive market and pipeline development
• Broad technology platform
• Solid basis for 15 GW growth plan
27Our asset portfolio
Plants in operation Capacity Economic Under construction Capacity Economic
MW interest MW interest
Theun Hinboun, Laos 525 20% Sukkur, Pakistan 150 75%
Magat, Philippines 388 50% Torex Gold, Mexico 9 100%
Benban, Egypt 380 51% Total 159 76%
Upington, South Africa 258 46%
Bujagali, Uganda 255 28%
Quantum Solar Park, Malaysia 197 100% Project backlog Capacity Economic
Apodi, Brazil 162 44% MW interest
Progressovka, Ukraine 148 100%
Binga, Philippines 140 50% India 900 50%
Guanizuil IIA, Argentina 117 50% South Africa 540 51%
Ambuklao, Philippines 105 50% Tunisia 360 55%
Kalkbult, South Africa 75 45% Brazil 101 40%
Dreunberg, South Africa 75 45% Ukraine 65 65%
Agua Fria, Honduras 60 40% Bangladesh 62 65%
Chigirin, Ukraine 55 100% Mali 33 64%
Boguslav, Ukraine 54 100% Lesotho 20 48%
Rengy, Ukraine 47 51% Total 2,081 54%
Redsol, Malaysia 47 100%
Jordan, Jordan 43 62% Project pipeline Capacity Share in %
Linde, South Africa 40 45% MW
Mocuba, Mozambique 40 53%
Dam Nai, Vietnam 39 100% Solar 6,082 49%
Los Prados, Honduras 35 70% Wind 2,620 21%
Kamianka, Ukraine 32 61% Hydro 2,428 20%
Czech, Czech Republic 20 100% Hybrid solutions 858 7%
Maris Hydro, Philippines 9 50% Release 300 3%
Asyv, Rwanda 9 54% Total 12,288 100%
Total 3,355 52%You can also read