REC GROUP SOLAR MARKET INSIGHT - Full-Year 2018 Results
←
→
Page content transcription
If your browser does not render page correctly, please read the page content below

REC GROUP
SOLAR MARKET INSIGHT
Full-Year 2018 Results

                         May 2019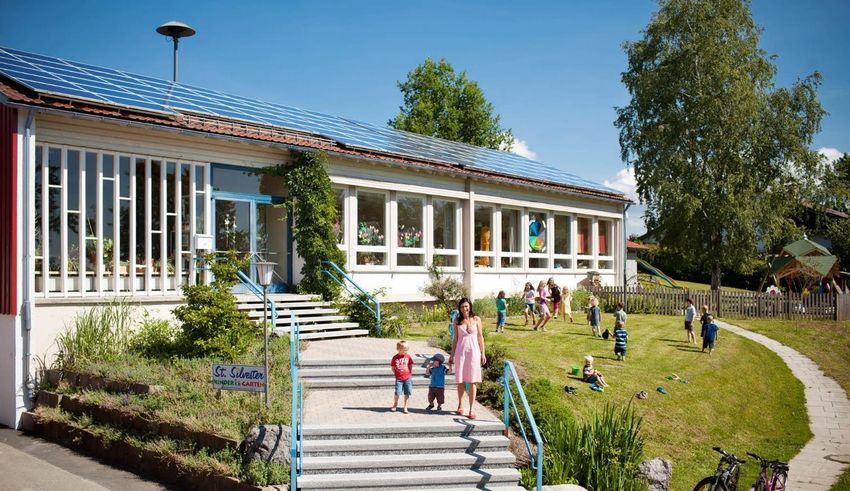
Table of contents

 1   REC Highlights 2018

 2   Global Performance 2018

 3   Regional Performance 2018

 4   REC & Market Outlook

                                 2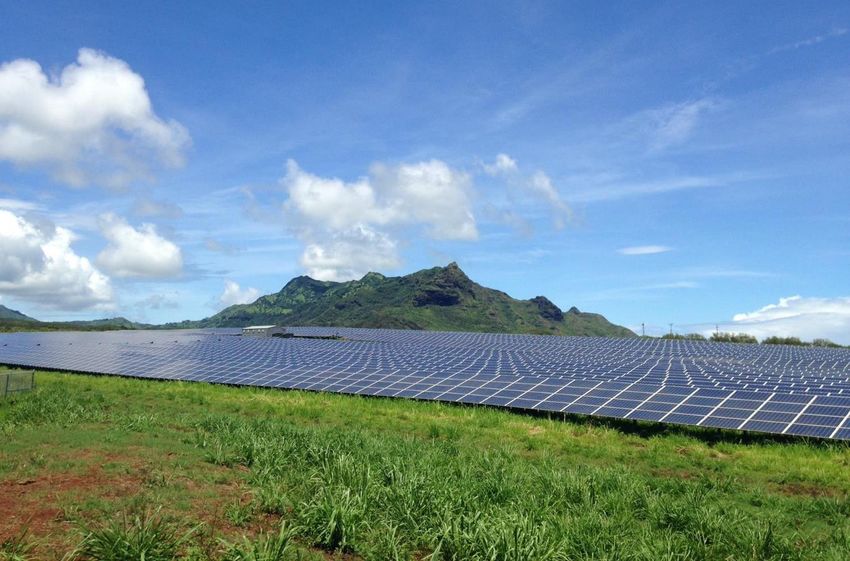
1   2   3   4   5

REC Highlights
Full-year 2018
Expansion of REC’s technology leadership into mono
products

                                 Three new products launched in 2018:
                                 • N-Peak
                                    o The world’s first n-type mono solar
                                      panel with half-cut cells and twin
                                      design

                                    o 60-cell panel with up to 330 Wp
                                 • Two new p-type monocrystalline
                                   PERC products based on REC’s
                                   award winning TwinPeak technology
                                    o 60-cell TwinPeak 2 Mono is rated
                                      up to 320 Wp
                                    o 72-cell TwinPeak 2S Mono 72 up
                                      to 380 Wp

                                                                            4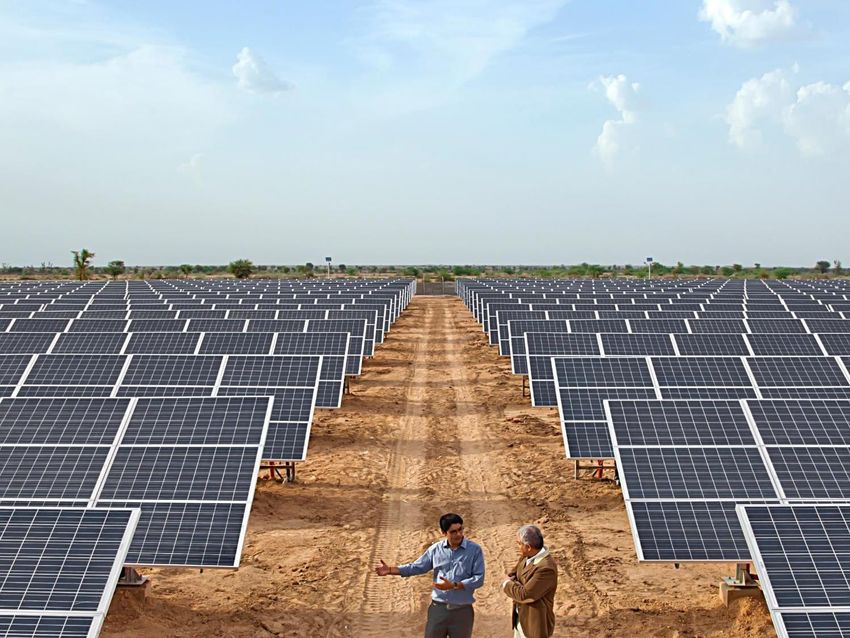
REC N-Peak with proven energy yield advantages

•   REC’s N-Peak demonstrates                  Specific Energy Yield
    consistently higher performance in         (Wh/Wp, March to December 2018, based on
    field testing by SERIS, both in terms of   actual power)
    Performance Ratio (PR) and Energy
    Yield (EY) over competitive Tier 1 p-                                    +8.5%
    mono products                                                                        1,045
                                                 1,050                           1,036
                                                 1,025
•   N-Peak outperformed the tested Tier 1
                                                 1,000         +1.2%
    competitor p-mono products by
                                                                       975
                                                   975   963
     •   +8.5% higher energy yield                 950
     •   95% Performance ratio (vs. 88%            925
         by competitor)                            900
                                                   875
                                                   850
                                                   825
                                                   800

                                                                                                 5
Firm orders for REC N-Peak – first installations live

The world’s first REC N-Peak solar panels went to
Australia. The Perth-based Solaire Connect,
completed the 3.2 kW rooftop project in Perth,
Australia, benefiting from the super-strong frame
design as well as the power efficiency of the 320
Wp modules to create a stable and efficient system.
Ben Towers, Managing Director at Solaire Connect,
says “We are very excited and proud to be a part of
the first ever N-Peak installation, and are looking
forward to many more over the years.”                                    © Solaire Connect

                                                                      System size: 10.24 kW
                                                                  Annual capacity: 7,000 kWh
                                                                  CO2 saved annually: 4 tons
                                                                       Number of panels: 32
                                                      Installer / EPC company: Solbære AS
© Solbære AS                                           Location: Frekhaug, Bergen, Norway
                                                                                               6
Technology innovations pushing REC’s cell efficiencies

REC Cell Efficiency Trend since 2010

 Cell Efficiency                                                                       24.5
                      REC Average (weighted)
 (in %)                                                                         24.0
                      REC’s Top Cell Efficiency
     24

    23                                                                   22.4          22.6

    22                                                                          21.2   REC’s new game-
    21                                                                                 changing product
                                                                                       to be launched at
                                                                         19.7          Intersolar Europe
    20                                                            19.4
                                                           18.8             REC N-Mono,
    19                                                                      TwinPeak Mono
                                                  18.0
                                        17.7
    18                           17.4
                          17.0                           REC TwinPeak
                   16.7
    17
           16.1
    16

    15
          2010     2011   2012   2013   2014      2015    2016    2017   2018 2019F 2020F

                                                                                                           7
Industry-topping new warranty for high-quality panels

New Product Warranty                                    New Power Output Warranty

•     20 years warranty for all products                •     Guarantees REC customers even greater
•     Extra 5-year product warranty for installations         output over the full 25-year duration
      carried out by REC-certified Solar
      Professionals

    REC Product Warranty Duration                           Overview Power Output Warranty
    (in years)                                              (by REC product)

                                 +5

                     100%

                                 20

             10

            Old                New
          warranty            warranty
                                                                                                      8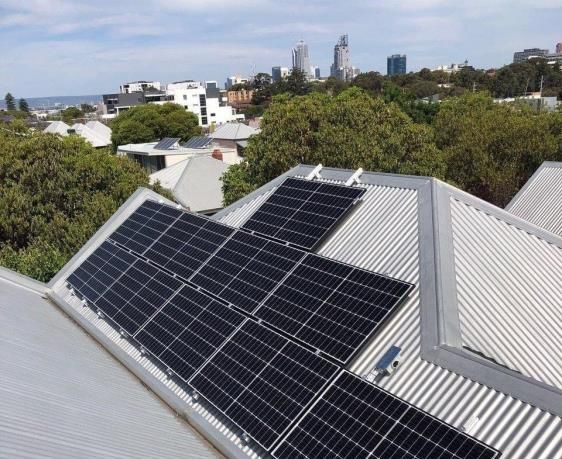
REC’s Quality is recognized year after year

                                                                                     Reliability Test          Duration
• REC has been named a Top Performer by                                              Thermal Cycling           600 cycles of -40 to +85°C
  DNV GL in its PV Module Reliability                                                Damp Heat                 2000 hours at 85°C & 85% RH
  Scorecard – for the 3rd year in a row                                              Humidity Freeze           30 cycles of 85°C & 85% RH for 20 hours, -40°C for 30 min

                                                                                     Dynamic Mechanical Load   1000 cycles of 1000 Pa then 50 TC cycles + 10 HF

                                                                                     PID                       96 hours, 85°C & 85% RH, negative system voltage rating

                                                                                        Dynamic Mechanical Load                       Thermal Cycling
                                                                                                        Top performers                                Top performers
                                                                                                        inc. REC                                      inc. REC

• REC competes against 9 of global top 10
  brands

• Program compares long term module
  reliability by vendor quality                                                         Damp Heat                                    PID
     o Testing in excess of IEC standards                                                               Top performers                                Top performers
                                                                                                        inc. REC                                      inc. REC
      o Accelerated lifetime tests

• Extended light soaking before testing to
  better quantify LID

                                                                                                                                                                       9
 *DNV GL, the world’s largest independent expert & certification body for renewable energy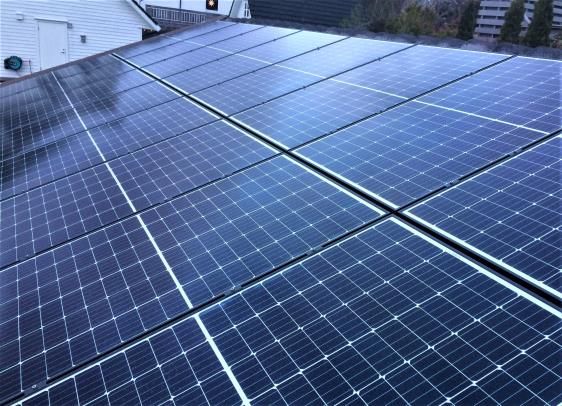
REC Channel program expanded across all regions

               2018 in Figures

       >10
   New Partners
     globally                 ~50
                          REC Partners
                            globally
        32
     Certification
trainings carried out
                          ~ 450 REC
                        Solar Professionals
                              certified
     >1,600
 Solar Professionals
                                              High-quality installations with
        (total)
                                                   high-quality panels

                                                                                10
REC follows its vision by bringing clean energy to
remote Himalayan communities
Better light, better education, cleaner air
• REC provided its panels to generate clean energy
to remote villages and schools in the Ladakh and
Zanskar regions of India
• Cooperation with Global Himalayan Expedition
(GHE)
• >1,500 people directly impacted
• 12 kW clean solar energy replaced polluting
sources
• 9,000 liters of kerosene per year
eliminated
• 22.8 tons of CO2 emissions avoided
• 100% of the population now have basic
energy access for lighting
• PV installations power computers and
displays at schools
• 30% increase in learning aptitude
report by schools
Our Vision: We want every person to benefit
from electricity directly from the sun.
111 2 3 4 Global Performance Full-year 2018
REC sold out in 2018 with strongest third quarter ever

REC Module Shipments 2018         • Sold out in 2018, with total shipments at
(in MW)                             1,165 MW and strongest 3rd quarter
                                    ever
                 +22%             • Upgrade and expansion of
                         640        manufacturing lines
                                  • Three new products launched
        525
                                      o N-Peak
                                      o TwinPeak 2 Mono
                                      oTwinPeak 2S Mono 72
                                  • >2.3 GW of award-winning REC
                                    TwinPeak modules installed globally
                                  • +20% customer base growth from end
                                    2017 to end of 2018

       H1 2018          H2 2018

                                                                            13
REC’s 2018 shipments are driven by the rooftop
segment
REC Module Shipments by Region REC Module Shipments by Segment
(in %) (in %)
Residential
APAC
Utility
24% EMEA 30%
38% 30%
38% 40%
Americas Commercial
+4% Y-o-Y shipment
growth despite market 70% of total REC shipments into
decline1 residential and C&I segment
1 SEIA / Wood Mackenzie, U.S. SOLAR MARKET INSIGHT, 2018 year in review, March 2019 14REC drives sales diversification, serving >40 countries
REC Growth markets 2018 vs. 2017
(based on REC shipments, in %)
+426%
+383%
+124% +117% +106%
+84%
+47% +45% +42%
+18
151 2 3 4 Regional Performance Full-year 2018
REC Americas shipment growth outperformed the
total U.S. PV market
   2018 Module Shipments split by Segment
   (in %)                                                                             REC Performance Highlights
                                                                                      • +45% customer base growth for REC Americas from
                                                                                        end 2017 to end 2018
                                                                                      • +4% REC shipments growth Y-o-Y, outperforming
                                                                                        the total U.S. market which saw a slight decline to
                                                                                        10.6GW in 2018 (down from 10.8GW in 2017)1
                                                                                      • >200MW initial order volume for REC’s TwinPeak
                                                                                        mono within days after starting production in
                                                                                        December 2018
                                                                                      • >1GW of award-winning REC TwinPeak modules
                                                                                        installed in the U.S. since 2015

                                                                                      Key regional trends
                Utility                                                               • 4% of distributed solar capacity in 2018 were
                          30%                                                           solar-plus-storage installations; This share is
                                                        Residential
                                               41%                                      forecasted to grow to 23% by 20241
                                                                                      • Investment activity for utility-scale project continues
                                                                                        to strengthen to secure 30% Investment Tax Credit
      Commercial               29%                                                      (ITC) ahead of its decline from 2020
                                                                                      • Corporate PPAs will continue to be strong demand
                                                                                        pillar
1 SEIA / Wood Mackenzie, U.S. SOLAR MARKET INSIGHT, 2018 year in review, March 2019
Source: Wood Mackenzie; Bloomberg NEF                                                                                                             17
REC expanded its customer base and country reach
in the EMEA region
2018 Module Shipments split by Segment
(in %) REC Performance Highlights
• +37% customer base growth for REC in the EMEA region
from end 2017 to end of 2018
• >20 markets are served by REC in the region
• Top 6 markets for REC were Germany, the Netherlands,
France as well as Belgium, Spain and Italy
• Belgium and the Netherlands saw the highest Y-o-Y
shipment growth amongst top markets of REC
• +117% in Belgium
• +42% in the Netherlands
Key regional trends
Residential • European PV market is set to double to 20GW by 2020
compared to its 2017 level
Utility 21%
36% • Thanks to PV’s increasing cost competitiveness, there
is vast potential for Corporate PPAs and unsubsidized
utility scale projects
• PV is given a more prominent role in the future energy
43% strategies by several large European markets
Commercial • France targets 45 GW of PV, Italy 50 GW, Spain
77 GW, all by 2030
Source: IHS (Dec. 2019); Press 182018 saw several of REC’s top 10 growth markets
being located in the APAC region
2018 Module Shipments split by Segment REC Performance Highlights
(in %)
• Top 5 markets for REC in APAC: India, Japan,
Australia, Singapore and Thailand
• In India, REC Group became the 1st European brand
of solar panels to be certified by BIS
• Upsurge in number of REC-certified installers in
Australia with >70 installers completing the
certification training in 2018, bringing the total number
to 255
• Seven new partners joined in 2018 REC’s Partner
Program across the APAC region
• Increasing footprint in emerging markets such as
Philippines and Indonesia
Key regional trends
Utility • Japan - strong outlook for residential driven by
Residential increasing attractiveness of self-consumption and
18%
27% government focus for Zero Energy Homes
• India - Strong growth prospects as India steadily
transitions from fossil fuels towards renewable energy;
Solar represented ~51% of all new power capacity in
20181
54% • Corporate PPAs enjoy a strong interest, the PPA
Commercial volume grew by +200% from 2017 to 2018²
1 India added 16.3 GW of new power generation capacity in 2018, renewable energy accounted for 70% of it and solar representing 50.7%; 2 BloombergNEF, Corp. PPA tracker, 2019
Source: Mercom India, (February 2019) 191 2 3 4 REC Global Outlook 2019 & Onwards
The number of Gigawatt-scale markets is continuously
growing thanks to strong economics of solar PV

Number of Solar PV GW-Scale Markets

     20

                                                             18
                                                      17

     15

                                               13

     10

                          6              6
      5

      0
                       2014             2016   2018   2020   2022

Source: IHS Markit Q4 2018 (Dec.2018)                               21
From 2019 to 2022, global demand is forecast to grow
at an annual average rate of 6%
Forecast of global PV installations from 2018 to 2022 ▪ Globally is expected to grow by
(In GW) around 6% per year from 2019
to 2022
150 ▪ Challenging 2018 due to
+6% regulatory decisions (i.e.
140 US, China, India)
130 RoW ▪ 2019 likely impacted by
+16%
120 new Chinese policy driving
Australia towards a subsidy–free PV
110 market demand
Japan
100 ▪ Growth drivers going forward:
90 Europe
▪ Demand diversification,
80 Rise of emerging markets
70 India ▪ Strengthening of
60 Prosumers
US
50 ▪ Declining LCOE’s leading
to acceleration of
40 economics- based
30 deployment
China
20 ▪ Solar + storage
10 ▪ Electrification in
transportation
0
2018 2019e 2020e 2021e 2022e
Source: REC, Bloomberg, Wood Mackenzie, IHS Markit 22Corporate Solar PPAs are booming, driven by PV cost
competitiveness
Solar PV LCOE development PPA volumes for Solar
(in $/MWh) (in GW, per Year)
PV - c-Si PV - c-Si Tracking Global Solar Corporate PPA, until 2018
5.9
350 6.0
PV achieved a 18% reduction in 4.0
300
LCOE from 1H’18 to 1H’19 – having
now reached $57/MWh 2.0 1.6 1.4
250 1.2
0.3 0.4
0.0
200 2013 2014 2015 2016 2017 2018
Outlook potential solar build by global RE100
150 members
Solar (new build)
Solar (existing)
100
18 19
16
50
14 19
0 16
H1 2014
H1 2015
H1 2016
H1 2017
H1 2018
H1 2019
Q3 2009
Q1 2010
Q3 2010
Q1 2011
Q3 2011
Q1 2012
Q3 2012
Q1 2013
4
2017-2020 2021-2025 2026-2030
Note: All LCOE calculations are unsubsidized.
Source: Bloomberg NEF, 1H 2019 LCOE Update – Solar, March 2019; Bloomberg NEF1H 2019 Corporate Energy Market Outlook 23>50% of module shipments in 2019 expected to be
mono-based
Module shipment forecast by technology 2017-2022e
(In GW)
Launch of Launch of REC‘s
REC N-Peak new HJT Product
100% 100%
90%
80%
Thin-Film
70%
N-Mono
60% Mono PERC
50% Mono
Multi-PERC
40%
Multi
30%
20%
10%
0%
2017 2018 2019e 2020e 2021e 2022e
Source: PV InfoLink (December 2018) 24REC Group to unveil game-changing solar panel at
Intersolar Europe 2019
The world’s highest power
60-cell solar panel
Leading technology expertise
from Europe and Singapore
Unique cell technology and
patented panel design
Something exciting is coming. A ‘best choice’ product for
growing solar rooftop
REC Group‘s big launch event at Intersolar Europe markets worldwide
on May 15, 2019 at 4PM. Booth A2.380.
www.recgroup.com/excitementFor more information, please contact:
Agnieszka Schulze
Head of Global PR, REC Group
E-mail: agnieszka.schulze@recgroup.com
The content of this presentation is strictly confidential. REC is the exclusive owner or licensee of the content, material, and information in this presentation. Any reproduction, publication or reprint, in whole or in part, is strictly prohibited. The information in this presentation may not
be accurate, complete or up to date, and is provided without warranties or representations of any kind, either express or implied. REC, as well as its directors, officers and employees, shall not be responsible for and disclaims any liability for any loss or damages, including without
limitation, direct, indirect, incidental, consequential and special damages, alleged to have been caused by or in connection with using and/or relying on the information contained in this presentation.You can also read