Gardner Denver Q2 2019 Earnings Presentation - August 1, 2019 - Investors
←
→
Page content transcription
If your browser does not render page correctly, please read the page content below

Gardner Denver
Q2 2019 Earnings Presentation
August 1, 2019
Replay Information

▪ Dial toll-free:   +1.877.344.7529

▪ International:    +1.412.317.0088

▪ Conference ID:    #10133603

▪ Log on to:        https://investors.gardnerdenver.com

                                                          2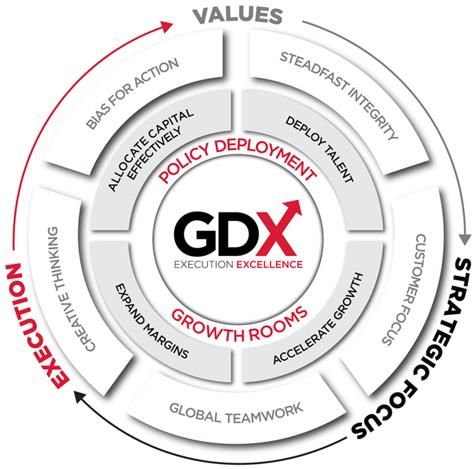
Disclaimer

Forward-Looking Statements
During the course of this presentation, we may make “forward-looking statements” within the meaning of the US
federal securities laws. In fact, all statements made during this presentation other than statements of historical fact
are forward-looking statements. Words such as “expects,” “anticipates,” “believes,” “estimates,” “plans,” “intends,”
“projects” and “indicates” and variations of such words or similar expressions are intended to identify forward-
looking statements. Although they reflect our current expectations, these statements are not guarantees of future
performance, and actual results may differ materially from what is expressed in or indicated by these forward-
looking statements. Forward-looking statements are subject to risks and uncertainties that could cause actual
performance or results to differ materially from those expressed in such forward-looking statements, including those
risks and uncertainties described under the section titled “Risk Factors” in our most recent annual report on form 10-
K filed with the Securities and Exchange Commission (“SEC”), which risks and uncertainties may be updated from
time to time in our periodic filings with the SEC (accessible on the SEC’s website at www.sec.gov). Forward-looking
statements speak only as of the date the statements are made. The Company does not undertake to update any
forward-looking statements as a result of future developments or new information, except as required by law.

Non-GAAP Financial Measures
Included in this presentation are certain non-GAAP financial measures designed to supplement, and not substitute,
the financial information presented in accordance with generally accepted accounting principles in the United States
of America because management believes such measures are useful to investors. The reconciliation of those
measures to the most comparable GAAP measures is detailed in Gardner Denver’s press release for the second
quarter of 2019, which is available at https://investors.gardnerdenver.com, together with this presentation.

                                                                                                                          3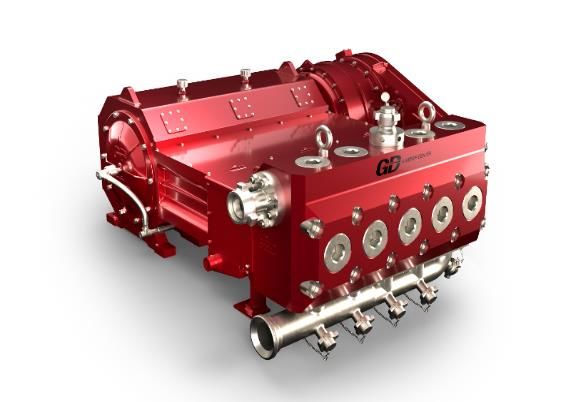
Agenda

▪ Company Highlights

▪ Gardner Denver/Ingersoll Rand Industrials Integration Update

▪ Strategy Update

▪ Segment Highlights

▪ Guidance

▪ Q&A

                                                                 4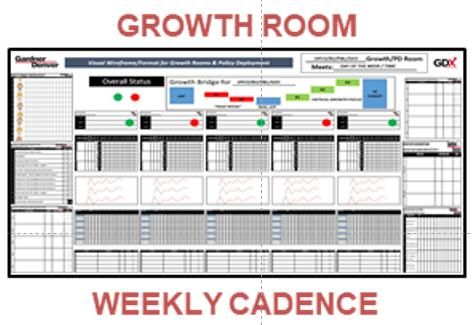
Q2 2019 Highlights1
Revenue of $629M, down 3% excluding FX
Adjusted EPS of $0.43 and Adjusted EBITDA of $148M with margin of 23.5%2
GDP-exposed businesses (represents ~80% of revenue)3
Revenue up 4% excluding FX
Triple digit Adjusted EBITDA margin expansion in Industrials and Medical segments
Upstream Energy (represents ~20% of revenue)
Downturn in upstream Energy due to supply/demand imbalances and limited market visibility… expecting
similar market conditions for remainder of 2019
Free cash flow (FCF) of $51M, FCF conversion of 113%, and net debt leverage of 2.0x4,5,6
Due to revised expectations for upstream Energy, updating full year 2019 Adjusted EBITDA
guidance to a range of $610M to $630M
1 All comparisons are versus the applicable prior year period unless otherwise noted 4 Free Cash Flow is defined as cash flows from operations less capital expenditures
2 Adjusted EPS is defined as adjusted net income divided by adjusted diluted average shares outstanding 5 Free Cash Flow conversion is defined as free cash flow divided by reported net income
3 GDP-exposed businesses defined as Industrials, Medical and mid/downstream Energy businesses 6 Leverage defined as net debt divided by LTM Adjusted EBITDA
5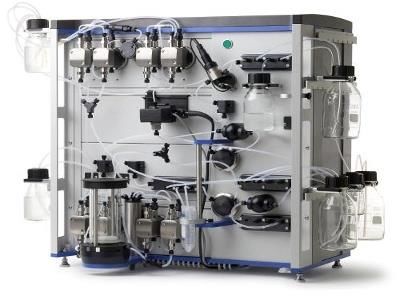
Gardner Denver/IR Industrials Transaction Update
Creating a Premier Diversified Leader in Mission-Critical Flow Creation and Industrial Products
Provides Greater Scale and Reach through Leading Brands and
Market Position
Enhances End Market Balance and Diversity
(Upstream energy reduced from ~25% to ~10% of revenue)
Broadens Portfolio of Technologies and Solutions
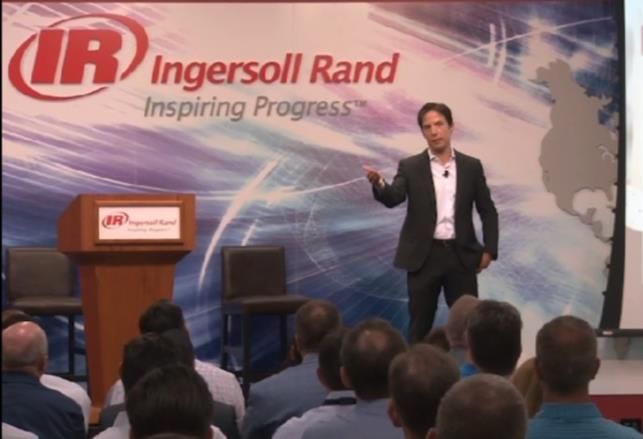
Gardner Denver CEO Vicente Reynal at Town Hall
Meeting at Ingersoll Rand HQ
Strong Recurring Service and Aftermarket Platform of ~$2.5B
(~40% of combined revenue) US antitrust (HSR) waiting period expired on June 29;
international antitrust process underway
World-Class Operating Platform Fueled by a Talented Joint integration planning progressing well… continued
Global Workforce confidence in achieving $250M cost synergies
Town hall hosted at Ingersoll Rand HQ… laying
Compelling Value Creation through $250M of Expected Cost
foundation for strong culture of engagement
Synergies with Incremental Revenue Growth Opportunities
~$1.6B Pro Forma Adjusted EBITDA1 On Track to Close Deal by early 2020
1 Presented on a 2019E basis. EBITDA is pro forma for anticipated synergies that we expect to realize by the end of year 3 after closing. 6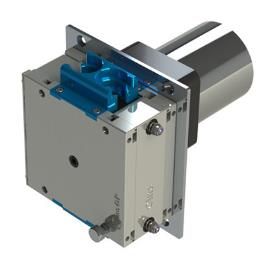
Integration: 4-Step Plan Governed by GDX

                       • 150+ employees engaged across GDI/IR
  Focused Team         • 23 functional workstreams

                       • Critical day 1 priorities by function and
  Step 1: Charter        sub-function
                       • Precise scope definition

                       • Current state processes (value stream
  Step 2: Blue Print     mapping) and capabilities
                       • Desired future state value stream map

                       • New IR future operating model
  Step 3: Work Plan    • Future state org design

                       • Bottoms-up functional plans for synergy
  Step 4: Synergy        delivery based on work plans
  Capture              • Ready for Day 1 execution on synergies

      Team Definition + 4-Step Plan Driven by GDX….Ensuring We “Stay in Control”
                                                                                   7
Our Strategy
Deploy Talent
Expand Margins
Accelerate Growth
Allocate Capital Effectively
8Industrials Segment – Q2 Highlights
(Dollars in millions)
As Prior YOY Ex-FX YOY
Reported Year Change Change
Revenue $334.3 $328.7 1.7% 5.5%
Adjusted EBITDA $76.6 $71.1 7.7% 11.5%
Adjusted EBITDA Margin 22.9% 21.6% 130 bps
Innovation in Action
Highlights:
Orders flat ex-FX
Revenue up 5% ex-FX
Positive orders performance in Americas & Europe ex-FX; negative
performance in Asia due to Runtech order placed in previous year
Solid performance in core oil lubricated compressors and blowers
Oil-Free Claw Vacuum Pump
which were both up mid to high single digits New vacuum technology providing oil-free air with
higher energy efficiency, lower footprint and
Adjusted EBITDA margin up 130 bps benefiting from continued reduced noise levels for applications such as food
packaging and processing, plastics and
progress on gross margin expansion initiatives (i2V, etc.) woodworking.
9Energy Segment – Q2 Highlights
(Dollars in millions)
As Prior YOY Ex-FX YOY
Reported Year Change Change
Revenue $222.8 $273.1 (18.4)% (16.8)%
Adjusted EBITDA $56.3 $79.7 (29.4)% (28.5)%
Adjusted EBITDA Margin 25.3% 29.2% (390) bps
Highlights: Innovation in Action
Orders down 30% ex-FX
Upstream orders down 35% due to minimal original equipment
activity and overall market activity impacting aftermarket
Revenue down 17% ex-FX
Upstream revenue down 26%
Mid/downstream down 3% ex-FX
Thunder E-Max Hydraulic Frac Pump
Adjusted EBITDA margin down 390 bps due to revenue decline in Newly introduced 11-inch stroke length
quintuplex hydraulic fracturing pump capable of
upstream with partial offset due to targeted cost actions; stable delivering up to 5,000 horsepower and longer
lasting fluid end and consumable life; pump is
margin performance in mid/downstream businesses designed for compatibility and enhanced
performance with emerging technology of
electric fracturing (“e-frac”).
10Medical Segment – Q2 Highlights
(Dollars in millions)
As Prior YOY Ex-FX YOY
Reported Year Change Change
Revenue $72.0 $66.4 8.4% 12.0%
Adjusted EBITDA $21.4 $18.0 18.9% 23.3%
Adjusted EBITDA Margin 29.7% 27.1% 260 bps
Acquisition of Oina
Acquired July 2019
Highlights:
Orders up 9% ex-FX
Revenue up 12% ex-FX
Strong broad-based performance across all product
technologies and geographies
Adjusted EBITDA margin up 260 bps driven by volume
growth and operational efficiencies
Oina Peristaltic Pumps
Highly engineered peristaltic pump offerings
developed for use in high precision liquid handling
applications such as pharmaceutical filtration
processes; pump reduces pulsation and provides
more reliable liquid flow.
11Revised 2019 Guidance
2019 Revised 2019
Guidance Guidance
(April 2019) (July 2019)
Revenue1 Growth (ex-FX) Growth (ex-FX)
Industrials up MSD up MSD
Medical up MSD up MSD
Mid & Downstream Energy up MSD up MSD
Upstream Energy down LDD to HSD down ~30%
Total Gardner Denver up LSD to MSD down LSD
FX Impact down LSD down LSD
Total Gardner Denver (incl. FX) up LSD down LSD to MSD
Adjusted EBITDA $680M – $710M $610M – $630M
Capital Expenditures ~$50M – $60M ~$50M – $60M
Tax Rate 24% – 26% 22% – 24%
Year-end Net Debt Leverage2 1.5x – 1.7x 1.8x – 2.0x
FCF Conversion ~100% ~100%
Average Shares Outstanding3 ~208M ~209M
1 All revenue outlook commentary expressed in percentages
2 Excluding the impact of any potential M&A activity or share repurchases
3 Represents the expectation of weighted average diluted shares outstanding for the balance of the year based on ending share count and share price as of June 30, 2019
12Appendix
Q2 2019 Financial Performance
                                                                                                                         (Dollars in millions, excl. EPS)

           Revenue                                                   Adjusted EBITDA                             Adjusted EPS1
     Down 6%                                                                   Down 9%                            Down 1 Cent
   Down 3% ex-FX                                                   Margin Down 70 bps
   $668
                                                                                                                 $0.44
                                                                       $162                                                       $0.43
                               $629

                                                                                                   $148

                                                                       24.2%
                                                                       Margin                      23.5%
                                                                                                   Margin

  Q2 2018                   Q2 2019                                 Q2 2018                    Q2 2019          Q2 2018          Q2 2019
        Industrials +5% ex-FX                                               Industrials +130 bps
         Medical +12% ex-FX                                                  Medical +260 bps
          Energy -17% ex-FX                                                   Energy -390 bps
    1   Adjusted EPS is defined as adjusted net income divided by adjusted diluted average shares outstanding
                                                                                                                                                      14
Q2 2019 Financial Performance
(Dollars in millions)
Working Capital Free Cash Flow 1 Leverage
(Op. Working Capital as % of LTM Sales) (FCF Conversion in % and FCF in $) (Net Debt / LTM Adjusted EBITDA)
Increased 40 bps Improved 0.4x Y/Y
205%
25.5%
25.1%
113%
2.4x
$124M
$51M
2.0x 2.0x
Q2 2018 Q2 2019 Q2 2018 Q2 2019 Q2'18 Q1'19 Q2'19
Industrials decreased 170 bps
Medical decreased 320 bps
Energy increased 430 bps
¹ Free Cash Flow is defined as cash flows from operations less capital expenditures; Free Cash Flow conversion is defined as free cash flow divided by reported net income 15Reconciliation of Net Income and Earnings per Share to
Adjusted Net Income and Adjusted Earnings per Share
GARDNER DENVER HOLDINGS, INC. AND SUBSIDIARIES
RECONCILIATION OF NET INCOME AND EARNINGS PER SHARE TO
ADJUSTED NET INCOME AND ADJUSTED EARNINGS PER SHARE
(Dollars in millions, except per share amounts)
(Unaudited)
For the Three Month For the Six Month
Period Ended Period Ended
June 30, June 30,
2019 2018 2019 2018
Net Income $ 44.9 $ 60.3 $ 92.1 $ 102.7
Basic Earnings Per Share (As Reported) $ 0.22 $ 0.30 $ 0.45 $ 0.51
Diluted Earnings Per Share (As Reported) $ 0.21 $ 0.29 $ 0.44 $ 0.49
Plus:
Provision for income taxes 8.3 17.2 20.3 40.7
Amortization of acquisition related intangible assets 28.2 27.6 56.6 55.6
Restructuring and related business transformation costs 2.0 8.4 6.1 12.9
Acquisition related expenses and non-cash charges 17.1 5.7 18.7 10.3
Expenses related to public stock offerings - 0.5 - 1.9
Establish public company financial reporting compliance - 1.1 0.6 1.9
Stock-based compensation 7.1 (0.8) 16.4 1.9
Foreign currency transaction losses (gains), net 0.6 (2.4) 3.7 0.2
Loss on extinguishment of debt 0.2 0.2 0.2 0.2
Shareholder litigation settlement recoveries - - (6.0) (4.5)
Other adjustments 0.6 - 0.9 (0.7)
Minus:
Income tax provision, as adjusted 19.2 25.4 40.5 49.9
Adjusted Net Income $ 89.8 $ 92.4 $ 169.1 $ 173.2
Adjusted Basic Earnings Per Share $ 0.44 $ 0.46 $ 0.84 $ 0.86
Adjusted Diluted Earnings Per Share 1 $ 0.43 $ 0.44 $ 0.81 $ 0.83
Average shares outstanding:
Basic, as reported 203.4 201.8 202.5 201.7
Diluted, as reported 208.9 209.6 208.4 209.8
Adjusted diluted 1 208.9 209.6 208.4 209.8
1
Adjusted diluted share count and adjusted diluted earnings per share include incremental dilutive
shares, using the treasury stock method, which are added to average shares outstanding.
16Reconciliation of Net Income to Adjusted EBITDA and Adjusted
Net Income and CFOA to Free Cash Flow
GARDNER DENVER HOLDINGS, INC. AND SUBSIDIARIES
RECONCILIATION OF NET INCOME TO ADJUSTED EBITDA AND ADJUSTED
NET INCOME AND CASH FLOWS - OPERATING ACTIVITIES TO FREE CASH FLOW
(Dollars in millions)
(Unaudited)
For the Three Month For the Six Month
Period Ended Period Ended
June 30, June 30,
2019 2018 2019 2018
Net Income $ 44.9 $ 60.3 $ 92.1 $ 102.7
Plus:
Interest expense 22.4 26.1 44.8 52.1
Provision for income taxes 8.3 17.2 20.3 40.7
Depreciation expense 13.5 13.8 27.6 27.8
Amortization expense 30.9 31.5 62.3 62.4
Restructuring and related business transformation costs 2.0 8.4 6.1 12.9
Acquisition related expenses and non-cash charges 17.1 5.7 18.7 10.3
Expenses related to public stock offerings - 0.5 - 1.9
Establish public company financial reporting compliance - 1.1 0.6 1.9
Stock-based compensation 7.1 (0.8) 16.4 1.9
Foreign currency transaction losses (gains), net 0.6 (2.4) 3.7 0.2
Loss on extinguishment of debt 0.2 0.2 0.2 0.2
Shareholder litigation settlement recoveries - - (6.0) (4.5)
Other adjustments 0.6 - 0.9 (0.7)
Adjusted EBITDA $ 147.6 $ 161.6 $ 287.7 $ 309.8
Minus:
Interest expense 22.4 26.1 44.8 52.1
Income tax provision, as adjusted 19.2 25.4 40.5 49.9
Depreciation expense 13.5 13.8 27.6 27.8
Amortization of non-acquisition related intangible assets 2.7 3.9 5.7 6.8
Adjusted Net Income $ 89.8 $ 92.4 $ 169.1 $ 173.2
Free Cash Flow
Cash flows - operating activities $ 61.4 $ 134.3 $ 130.1 $ 194.5
Minus:
Capital expenditures 10.6 10.8 24.7 20.9
Free Cash Flow $ 50.8 $ 123.5 $ 105.4 $ 173.6
17Reconciliation of Segment Adjusted EBITDA to Income
Before Income Taxes
GARDNER DENVER HOLDINGS, INC. AND SUBSIDIARIES
RECONCILIATION OF SEGMENT ADJUSTED EBITDA TO INCOME BEFORE INCOME TAXES
(Dollars in millions)
(Unaudited)
For the Three Month For the Six Month
Period Ended Period Ended
June 30, June 30,
2019 2018 2019 2018
Revenue
Industrials $ 334.3 $ 328.7 $ 652.4 $ 645.6
Energy 222.8 273.1 455.9 515.3
Medical 72.0 66.4 141.1 126.8
Total Revenue $ 629.1 $ 668.2 $ 1,249.4 $ 1,287.7
Segment Adjusted EBITDA
Industrials $ 76.6 $ 71.1 $ 147.7 $ 137.9
Energy 56.3 79.7 116.3 147.6
Medical 21.4 18.0 41.4 33.9
Total Segment Adjusted EBITDA $ 154.3 $ 168.8 $ 305.4 $ 319.4
Less items to reconcile Segment Adjusted EBITDA to
Income Before Income Taxes:
Corporate expenses not allocated to segments $ 6.7 $ 7.2 $ 17.7 $ 9.6
Interest expense 22.4 26.1 44.8 52.1
Depreciation and amortization expense 44.4 45.3 89.9 90.2
Restructuring and related business transformation costs 2.0 8.4 6.1 12.9
Acquisition related expenses and non-cash charges 17.1 5.7 18.7 10.3
Expenses related to public stock offerings - 0.5 - 1.9
Establish public company financial reporting compliance - 1.1 0.6 1.9
Stock-based compensation 7.1 (0.8) 16.4 1.9
Foreign currency transaction losses (gains), net 0.6 (2.4) 3.7 0.2
Loss on extinguishment of debt 0.2 0.2 0.2 0.2
Shareholder litigation settlement recoveries - - (6.0) (4.5)
Other adjustments 0.6 - 0.9 (0.7)
Income Before Income Taxes $ 53.2 $ 77.5 $ 112.4 $ 143.4
18You can also read