Investor Presentation Q1 2020 - Schoeller Allibert Investor ...
←
→
Page content transcription
If your browser does not render page correctly, please read the page content below

Investor Presentation Q1 2020
14 May 2020 | Strictly Private & Confidential
Disclaimer

•   THIS REPORT (THE “REPORT”) IS FOR INFORMATIONAL PURPOSES ONLY AND IS NOT AN OFFER OR SOLICITATION OF AN OFFER TO BUY OR SELL SECURITIES. BY READING THIS REPORT, ATTENDING
    ANY PRESENTATION OF THIS REPORT (THE “PRESENTATION”) AND/OR READING ANY SLIDES USED FOR ANY SUCH PRESENTATION (THE “PRESENTATION SLIDES”) YOU AGREE TO BE BOUND AS
    FOLLOWS:
•   The information contained in this Report, any Presentation and/or any Presentation Slides (the “Information”) has not been subject to any independent audit or review. A portion of the Information, including all market data
    and trend information, is based on estimates or expectations of Schoeller Packaging B.V. (together with its subsidiaries and affiliates, the “Group”), prepared by us based on certain assumptions, or by third party sources.
    We have not independently verified such data or sought to verify that the data remains accurate as of the date of this Report, any Presentation and/or any Presentation Slides. There can be no assurance that these
    estimates or expectations are or will prove to be accurate.
•   In addition, past performance of the Group is not indicative of future performance. The future performance of the Group will depend on numerous factors which are subject to uncertainty. Furthermore, the Information
    contained in this report is subject to change without notice. No representation or warranty, express or implied, is made as to the fairness, accuracy, reasonableness or completeness of the information contained herein and
    no reliance should be placed on it.
•   Certain statements contained in this Report, any Presentation and/or any Presentation Slides that are not statements of historical fact, including, without limitation, any statements preceded by, followed by or including the
    words “targets,” “believes,” “expects,” “aims,” “intends,” “may,” “anticipates,” “would,” “could” or similar expressions or the negative thereof, constitute forward-looking statements, notwithstanding that such statements are not
    specifically identified. In addition, certain statements may be contained in press releases and in oral and written statements made by or with the Group’s approval that are not statements of historical fact and constitute
    forward-looking statements. Examples of forward-looking statements include, but are not limited to: (i) statements about the benefits of any contemplated offering of securities, including future financial and operating results;
    (ii) statements of strategic objectives, business prospects, future financial condition, budgets, projected levels of production, projected costs and project levels of revenues and profits of the Group or its management or
    boards of directors; (iii) statements of future economic performance; and (iv) statements of assumptions underlying such statements.
•   By their nature, forward-looking statements involve risk and uncertainty and may, and often do, differ materially from actual results. Any forward-looking statement speaks only as of the date on which it is made and reflects
    the Group’s current view with respect to future events. Forward-looking statements are not guarantees of future performance, and the actual results, performance, achievements or industry results of the Group’s operations,
    results of operations, financial position and the development of the markets and the industry in which the Groups operates or is likely to operate may differ materially from those described in, or suggested by, the forward-
    looking statements contained in this Report, any Presentation and/or any Presentation Slides. New factors will emerge in the future, and it is not possible for the Group to predict which factors they will be. In addition, we
    cannot assess the impact of each factor on the Group’s business or the extent to which any factor, or combination of factors, may cause actual results to differ materially from those described in any forward-looking
    statements.
•   The Group presents financial information herein that is prepared in accordance with IFRS and may present any other generally accepted accounting principles, such as EBITDA, Adjusted EBITDA and other financial
    measures. These non-IFRS financial measures, as defined by the Group, may not be comparable to similarly-titled measures as presented by other companies, nor should they be considered as an alternative to the
    historical financial results or other indicators of the performance based on IFRS.
•   We or our affiliates may, at any time and from time to time, seek to retire or purchase our outstanding debt through cash purchases and/or exchanges for equity or debt, in open-market purchases, privately negotiated
    transactions or otherwise. Such repurchases or exchanges, if any, will be upon such terms and at such prices as we may determine, and will depend on prevailing market conditions, our liquidity requirements, contractual
    restrictions and other factors. The amounts involved may be material.
Introduction

Management

             Ludo Gielen   Hans Kerkhoven
             CEO           CFO

4
2020 Goals & Achievements
Key Messages: Q1 2020

Sales Growth
   • Revenue of € 122m, +11.8% vs LY

EBITDA Growth
  • EBITDA of € 12.1m, +12.9% vs LY

Cash flow
  • Operating cash flow improved to € 9.5m vs - € 2.6 m in Q1 2019

Covid-19 Impact
  • Despite the global economic downturn caused by the Covid-19 outbreak, our performance in Q1 2020
      was above prior year and budget
  • Our factories are currently operating well, some affected by lower volumes, some operating less shifts
  • Orderbook has been stable in March and April, although we received some requests for delay and a
      limited number of cancellations

6
2020 Strategic Priorities
Grow Sales Generate cash
• Continue innovation leadership to drive • Select capital expenditure with best returns
sales growth of new products once economy
picks up again • Freeze unnecessary spend
• Diversify sales in the US • Reduce inventory
• Use government support where eligible
Improve Operations Improve margins
• Strengthen supply chain planning • Optimise selling prices with process
discipline
• Move moulds between factories for better
utilisation • Increase the use of regrind material
• Improve central sales operations planning • Reduce indirect costs
• Continue automation of production lines • Improve procurement
7New Product Sales
• Q1 2020 new product sales increased by
€ 5.2m of which € 2.0m is attributable to
Big 3
• LTM increase of € 14.6m is largely due to
Big 3 and new beverage projects
8Capital Expenditure
• Growth capex of € 10.1m in Q1 2020 as
projects initiated in 2019 are moving into final
stages of execution.
• Main growth investments were made in:
o New product development € 5.4m
o New production line in US € 3.0m
o Big 3 € 0.5m
o Pooling € 0.6m
• Maintenance capital expenditure in line with
2019
• Capex will be less in the coming quarters
9Financial Results
Sales Performance Q1

     • Revenue growth of 11.8% versus Q1 2019

     • Revenue growth supported by continued strong sales in the pooling sector in both
       Europe and US

     • Other drivers of revenue growth are the Big 3 sales and strong beverage sales
       versus last year

     • The European automotive sector is especially impacted by COVID-19 resulting in
       automotive plant closures that have further depressed this already weak sector.
       This has resulted in lower sales versus the same period last year

11
Q1 2020 Financial Performance
in € million Q1 2020 Q1 2019
Revenue 122.0 109.0
% growth y-o-y 11.8% 1.5%
EBITDA 12.1 10.7
% sales 9.9% 9.8%
• EBITDA improved € 1.4m (+12.9%) driven by higher volume (+11.8%), higher margins on New
Products and a negative mix effect from lower margin products in pooling
• LTM Revenue of € 550m continued the upward trend
• LTM EBITDA increased to € 67.6m (+ € 1.4m versus Q4 2019)
12Cash Flow
YoY
in € million Q1 2020 Q1 2019
change
• Operating cash flow was positive due
Adjusted EBITDA 12.1 10.7 13% to smaller working capital change
Change in Working Capital -2.6 -13.3 81%
Operating Cash Flow 9.5 -2.6 463%
Capital expenditures -14.0 -8.2 -71%
• Capital expenditures € 5.8m above LY
Adjusted Free Cash Flow -4.5 -10.8 59% as a result of new product
Interest -0.9 -1.1 18% development and a new production
New finance leases 0.0 3.1 -100% line in the US.
Finance Lease repayments -1.3 -1.0 -30% Lower quarterly capex expected for
Operating Lease repayments -2.5 -2.7 6% the remainder of 2020
Debt repayment and proceeds 0.0 0.5 -96%
Taxes -0.3 0.3 -194%
Recurring Net Cash Flow -9.5 -11.7 19% • Net cash flow improved YoY
Swedish tax payment 0.0 -1.5 100% excluding shareholder funding in Q1
Adjusting items -0.9 -0.7 -34% 2019
Shareholder funding 0.0 7.6 -100%
Other/Related parties -0.8 -0.8 3%
Net Cash Flow -11.2 -7.1 -57%
13Debt and liquidity overview
in € million Q1 2020 FY 2019
• Long term stable senior debt structure in
6.375% Senior Secured Indebtedness due 1 Nov. 2024 250.0 250.0 place
Finance Leases 22.2 23.7
IFRS 16 impact 28.1 28.3
Total lease obligation 50.3 52.1 • Headroom of € 95.9m comprising of
Bank Loans 12.9 13.2 € 38.5m of cash at bank and RCF and
Total Debt 313.2 315.3 € 57.4m under the Brookfield facility
RCF Drawings (limit € 30m)1 17.0 5.1
Cash at bank and in hand -27.1 -26.8 • Leverage ratio at 4.5x
Net Cash -10.1 -21.7
Total Net Debt 303.1 293.6
• Non-recourse factoring totalled € 45.3m
for Q1
Leverage ratio 4.5x 4.4x
Total Liquidity Headroom 95.9 109.0
1 Out of the € 30m, € 3m is to be used for contingent liabilities only
14Covid-19 & Outlook
Covid 19 – Priorities and Consequences

     Protecting our people and customers

     •   3 people have been infected of which 2 recovered and returned to work, 1 recovering
     •   People are working from home where feasible
     •   Physical distancing measures in place for all locations and is working well

     Current situation

     •   All of our factories are operating, some are affected by lower volumes, operating less shifts
     •   The order-book has been stable although some requests for delays of orders and limited cancellations
     •   Business is positively positioned in certain essential sectors (i.e. food & beverage, retail, logistics)

16
Covid 19 – Mitigating Actions
• Plans agreed with each location to rapidly respond IF volumes would decline by reducing
temporary workforce, adjusting shift patterns, applying short work and preparing for possible
redundancies
• Certain Covid-19 scenarios have been run to analyze how our liquidity is impacted and we
have defined necessary mitigating actions. We will continue to assess the impact and
redefine these mitigating actions going forward
• Mitigating actions focusing on Cash Preservation - Cost avoidance, delay / reduce capex,
tax deferrals, inventory reductions
• Continue to explore eligibility for government support and loan programs
17Conclusion And Current Trading Update
• Growth of 11.8% in Q1 2020 and 12.9% EBITDA improvement
• Positive Operating Cash Flow in Q1 2020
• April 2020 revenue in line with and EBITDA above LY April
• Covid-19 Scenario analysis continues to be performed and mitigating actions implemented
18Q&A
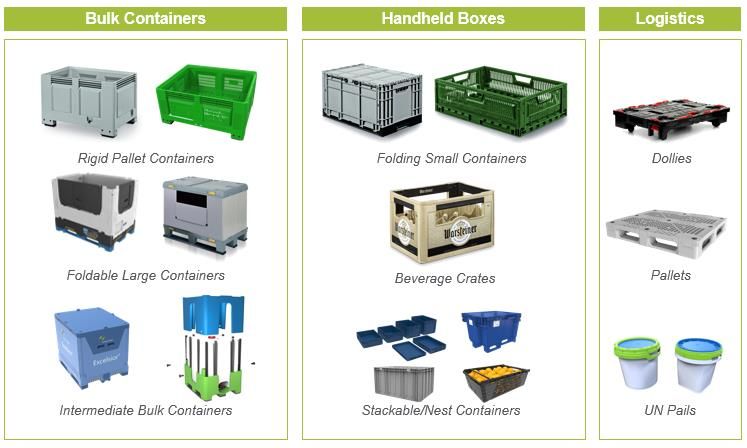
Schoeller Allibert At A Glance

  Business Overview                                                                                                                                                    Product Range

      ~20% market share in Europe
      >1,000 products, the broadest portfolio in the industry
      >10,000 customers
      >15 years of long-term client relationships (top 10) driving recurring revenue
      Sustainability focus and substitution of one-way packaging
      New Markets opened by waste reduction, growing logistics & warehouse automation
      100% Regrind of returned containers for new products
      13 production plants able to serve many geographies
      ~32 R&D staff supporting project pipeline and revenues

                                                                      17%                                               13%               11%                     9%                 8%           7%           7%
                      28%

                                                      Industrial
Pooling Services                                    Manufacturing                                      Automotive                 Beverage                   Retail            Food & Food   Agriculture   Traders
                                                                                                                                                                                Processing

                                                                                                                              Revenue Diversification By End-Market2
Source: company information
2
  based on 2019 revenue information, excludes rental business and activities by Schoeller Allibert International GmbH
Appendix: Operating Result To Adjusted EBITDA Bridge
in € million Q1 2020 Q1 2019
Operating result 2.2 -0.2
Depreciation 8.2 9.3
Amortisation 0.5 0.4
Management Fees 0.3 0.4
Other 0.0 0.0
Adjusting Items 0.9 0.7
Adjusted EBITDA 12.1 10.7
21You can also read