Interim Results Investor Presentation - AWS

Page created by Neil Diaz
 
CONTINUE READING
Interim Results Investor Presentation - AWS
Interim Results Investor Presentation
Interim Results Investor Presentation - AWS
CORPORATE SNAPSHOT
Shareholder Distribution                                          Management
                                                                  Chris Scott                                                                                   Managing Director
                                     Insiders                     Edmund Mah                                                                                    Group CFO
                                       23%
                        Retail
                         38%
                                                                  Matt Veal                                                                                     Group Financial Controller
                                                                  Bev Davies                                                                                    Head of People and Talent
                                 Institutional
                                     39%                          Jenny Aldous                                                                                  Head of Projects
                                                                  Tomas Stehlik                                                                                 IT Manager
                                                                  Henry Blundell                                                                                Head of Property
Substantial shareholders (% of total shares) as at 30 June 2021   Historical Share Price

J47 Pty Ltd                                      AU   16.4%       1600000                                                                                                                                                                                                                                                   1.6
                                                                  1400000                                                                                                                                                                                                                                                   1.4
                                                                  1200000                                                                                                                                                                                                                                                   1.2
Citicorp Nominees Pty Ltd                        AU   11.1%       1000000                                                                                                                                                                                                                                                   1
                                                                   800000                                                                                                                                                                                                                                                   0.8
                                                                   600000                                                                                                                                                                                                                                                   0.6
Upton124 Pty Ltd                                 AU   5.1%         400000                                                                                                                                                                                                                                                   0.4
                                                                   200000                                                                                                                                                                                                                                                   0.2
                                                                        0                                                                                                                                                                                                                                                   0
HSBC Custody Nominees Ltd                        AU   4.9%

                                                                            3/01/2020

                                                                                        3/02/2020
                                                                                                    3/03/2020

                                                                                                                3/04/2020

                                                                                                                            3/05/2020

                                                                                                                                        3/06/2020

                                                                                                                                                    3/07/2020

                                                                                                                                                                3/08/2020

                                                                                                                                                                            3/09/2020

                                                                                                                                                                                        3/10/2020

                                                                                                                                                                                                    3/11/2020

                                                                                                                                                                                                                3/12/2020

                                                                                                                                                                                                                            3/01/2021

                                                                                                                                                                                                                                        3/02/2021
                                                                                                                                                                                                                                                    3/03/2021

                                                                                                                                                                                                                                                                3/04/2021

                                                                                                                                                                                                                                                                            3/05/2021

                                                                                                                                                                                                                                                                                        3/06/2021

                                                                                                                                                                                                                                                                                                    3/07/2021

                                                                                                                                                                                                                                                                                                                3/08/2021
National Nominees Limited                        AU   4.5%
                                                                                                                                                                            Volume                              Close
Interim Results Investor Presentation - AWS
BOARD OF DIRECTORS

Hamish Stevens - Chairman Chris Scott - MD and CEO                             Chris Sacre - NED                          Kim Campbell - NED              Adrian Fonseca - NED
Hamish has held independent         Chris was the Founder and, from 2010       Chris Sacre is widely regarded and         Kim Campbell attended the       Adrian practised as a banking
directorships on several boards     to 2016, the Managing                      respected within the childcare             University of Canterbury        and finance lawyer at global
since 2010 and is currently Chair   Director of ASX listed G8 Education        industry. Chris developed a passion        completing a Bachelor of        firms Allens and Ashurst
of East Health Services, a          which evolved into Australia’s             for the industry in early 2007 when        Arts majoring in Geography.     before spending 17 years in
director of NZX-listed Marsden      largest listed early education and child   he provided financial consultative         Kim was the CEO of the          investment banking in Sydney,
Maritime       Holdings,   Radius   care provider. During this period, the     services, as an Advisory Manager for       Employers & Manufacturers       Singapore and London with
Residential Care, Pharmaco, and     G8 Education Limited portfolio grew        PricewaterhouseCoopers to G8               Association. Kim is currently   Macquarie Bank, Deutsche
Counties Power. Prior to his        from 38 to over 500 pre-school             Education (formally Early Learning         a Director of Douglas           Bank and Barclays Bank. In his
governance career, Hamish held      education centres in Australia (plus 20    Services) in the lead up to the public     Pharmaceuticals, Director of    last role Adrian was head of a
senior finance positions with       in Singapore). Chris was also              listing. After successfully floating the   EMH Trade Ltd and Chair of      Strategic     Solutions   and
Heinz Watties, Tip Top Ice Cream    instrumental in raising over $500          company in 2007, Chris joined G8           Auckland      Manufacturers     Financing Team at Deutsche
and DB Breweries. Hamish is a       million in equity capital and more         Education as Chief Financial Officer.      Association.                    Bank in Singapore. Adrian is
qualified Chartered Accountant      than $500 million in debt (including       During his time with G8 Education,                                         currently the Founder and
and a Chartered Fellow of the       Singapore       dollar   bonds).     G8    Chris was instrumental to the                                              Managing Director of Oxanda
Institute of Directors.             Education's market capitalisation          growth of the company with over                                            Education - a large Australian
                                    grew from $4 million in 2010 to a          400 childcare acquisitions, raising                                        early learning centre.
                                    peak of approximately $1.9 billion.        over $500 million in capital and
                                                                               increasing market cap. from $4
                                                                               million to $1.3 billion.
Interim Results Investor Presentation - AWS
1H21 HIGHLIGHTS
 Acquisition Growth

• During the 6 months ended 30 June 2021,
  the Group acquired 10 centres in
  Australia.
• The acquisitions have contributed revenue
  of $4.5 million and net profit of $1.3
  million to the Group’s results.
• A further two centres have settled to date
  and conditional agreements for two
  centres have been signed.
• The Group is actively pursuing acquisition
  opportunities across Australia.
Interim Results Investor Presentation - AWS
1H21 HIGHLIGHTS (cont.)
Share Placement

• $23.5 million raised in an institutional share
  placement in April 2021.

• Funds have been / will be used for centre
  acquisitions in Australia.

NZ Centre Upgrade Plan

• The Board approved a $4.5 million centre
  upgrades capital expenditure plan for CY
  2021. Centre upgrade works are
  progressing well.

• Continued focus on providing high quality
  centre facilities and resources.
Interim Results Investor Presentation - AWS
Financial Highlights
                                                   1H2021 vs 1H2020
                                                       (NZD$M)
                                                                            Underlying           Underlying
                             Government              Corporate and         EBITDA (incl.        EBITDA (excl.
      Parent Fees
                               Funding               Support Costs         wage subsidy)        wage subsidy)
                       49                    4.6                      12                    6
25

                       48                                             10                    4

                       47                    4.5                       8                    2
20

                       46                                              6
                                                                                           -
                                                                                                 2021    2020
15                     45                    4.4                       4
                                                                                           -2

                       44                                              2
                                                                                           -4

10                     43                    4.3                      -
     2021    2020            2021   2020             2021    2020           2021    2020   -6

Note - Effective from 1 April 2020, the Group's reporting date changed from 31 March to 31 December. The 1H20
comparative period mentioned throughout this presentation is for the six months to 30 June 2020. This differs to the
2020 interim financial statements that were prepared for the six months ended 30 September 2020. Due largely to
the seasonality of the Group’s operations, results for the six months to 30 September 2020 were stronger than the
six months to 30 June 2020.
Interim Results Investor Presentation - AWS
Financial Highlights

NZD $'000s                1H2021 1H2020
                                               Wage 1H2020
                                                              Variance       %    ▪ $14.2m in government wage subsidy and
                                             subsidy adjusted
                                                                                    JobKeeper payments received in 1H2020.
  Parent Fees             26,450    16,438             16,438    10,012    61%

  Government Funding      48,441    45,475             45,475     2,966     7%    ▪ Excluding these subsidies, centre wages have
                                                                                    increased by $1.6m driven largely by the new
Total revenue             74,891    61,913             61,913    12,978    21%
                                                                                    centres in Australia. This has been more than
  Centre wages            -43,472 -28,367    -13,505   -41,872   -1,600     -4%     offset by additional revenue of A$4.2m
Centre gross profit       31,419    33,546   -13,505   20,041    11,378    57%
                                                                                    generated by these centres. Agency reliever
                                                                                    costs in New Zealand have increased in 1H2021
  Centre rent             -13,140 -12,544              -12,544     -596     -5%     due to staffing shortages across the industry.
  Other centre expenses    -8,381   -7,098              -7,098   -1,283    -18%
                                                                                  ▪ Corporate costs reduced by 21% and support
Centre EBITDA              9,898    13,904   -13,505      399     9,499   2381%
                                                                                    office costs have remained consistent with the
  Corporate costs           -581      -731               -731      150     21%      comparative period.
  Support Office cost      -3,853   -3,169     -678     -3,847       -6     0%
                                                                                  ▪ Underlying EBITDA increased by $9.6 million,
Underlying EBITDA          5,464    10,004   -14,183    -4,179    9,643   231%      adjusted for subsidies received.
Interim Results Investor Presentation - AWS
Financial Highlights
                                                    Balance Sheet
                                 Jun-21               Dec-20

                                            $'000                $'000

Cash and cash equivalents                  35,987               59,139

Funding receivable                          8,434                    -

Other current assets                        3,244                2,507

Property, plant and equipment               7,438                7,102

Right-of-use assets                       185,835              170,938

Deferred tax assets                        14,044               13,022

Intangible assets                         153,682              117,697

Term deposits                               4,616                4,066

Total assets                              413,280              374,471

Trade and other payables                   11,553                7,124

Current income tax liabilities              1,207                2,014

Funding received in advance                     -                4,639

Borrowings                                 36,515               36,137

Lease liabilities                         223,755              208,224

Employee entitlements                       9,238                6,827

Total liabilities                         282,268              264,965
                                                                         ▪ The Group was in compliance with all debt
Net assets                                131,012              109,506     covenants during the current and previous
                                                                           periods.
Interim Results Investor Presentation - AWS
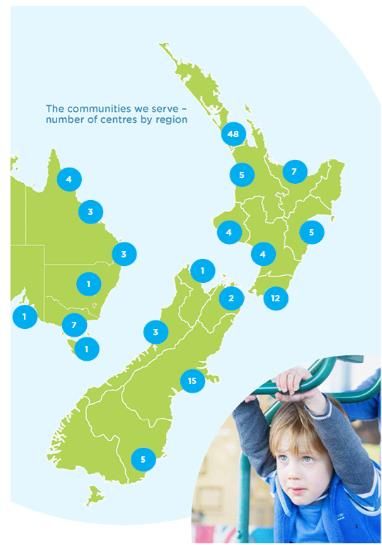
Portfolio footprint
in NZ and Australia
   • NZ – 111 centres
   • AU – 20 centres
Interim Results Investor Presentation - AWS
New Zealand
                                                                                             YTD OCCUPANCY
      • NZ occupancy averaging 69% in 2021, up 2% from
                                                                                                   2020    2021
        2020 however has not returned to pre-Covid-19
                                                                71%
        levels.                                                 70%
                                                                69%
      • Steady increase in total revenue per FTE per day        68%

        attributable to fee increases.                          67%
                                                                66%
                                                                65%
      • Metrics for 2020 have been distorted by Covid-19.       64%
                                                                63%
                                                                62%
                                                                      January     February      March        April    May   June

                  WAGE TO REVENUE RATIO                                         TOTAL REVENUE PER FTE PER DAY
                                2020   2021                                                         2020   2021

65%                                                             90
60%                                                             85
55%                                                             80
50%
                                                                75
45%
                                                                70
40%
                                                                65
35%
30%                                                             60

25%                                                             55

20%                                                             50
        January    February   March     April   May   June            January     February      March         April   May    June
Revenue and EBIT Reconciliation – New Zealand
                                          1H CY 2021 Revenue Bridge (NZD $000’s)

 • Increase in revenue of $5.2m (10%)
   attributable to childcare fees lost in 2020
   due to alert level 4 centre closures.
 • Teacher shortages have affected our ability
   to hit higher MOE funding band.
 • Decrease in number of centres has also
   reduced MOE funding.

                                      1H CY 2021 Underlying EBITDA Bridge (NZD $000’s)

• Underlying EBITDA has decreased by 76%
  largely due to wage subsidies received in
  2020.
Australia
                                                                                    YTD OCCUPANCY
  • Steady increase in occupancy and decrease in wage                                      2020    2021

    to revenue ratio in 2021.                              85%

                                                           80%

  • Covid-19 government support measures ended on          75%
    31 January 2021.                                       70%

                                                           65%
  • Metrics for 2020 have been distorted by Covid-19.
                                                           60%

                                                           55%
                                                                  January    February    March      April    May   June

                WAGE TO REVENUE RATIO                                 TOTAL REVENUE PER BOOKING PER
                              2020   2021                                          DAY
70%                                                                                         2020   2021
60%                                                         160
50%                                                         140
                                                            120
40%
                                                            100
30%                                                          80
20%                                                          60
                                                             40
10%
                                                             20
0%                                                           -
      January   February   March      April   May   June           January    February    March      April   May   June
Revenue and EBIT Reconciliation - Australia
                                           1H CY 2021 Revenue Bridge (A$000’s)

• Revenue was $14.9m, up 101%
• New centres contributed $4.2m of total
  revenue (28%)
• Final government support payments of
  $0.3m received in January 2021

                                     1H CY 2021 Underlying EBITDA Bridge (A$000’s)

• Underlying EBITDA for 2021 is $3.1m, up
  161%
• New centres contributed $1.3m of total
  Underlying EBITDA (40%), offset by small
  increase in support office costs of $24k
• Increases achieved by centres acquired
  prior to 2021 offset by $2.2m decrease
  from JobKeeper payments
STRATEGY AND OUTLOOK
Strategy and Outlook
 ▪ Further acquisitions are being
   contemplated following the capital raise
   which was completed at the end of March
   2021.

 ▪ Continued focus on increasing occupancy,
   centre upgrades, and more prudent use
   of labour.
APPENDIX
Glossary

Term                                Definition

EBITDA                              Earnings before interest, taxation, depreciation and amortisation

                                    Earnings before interest, taxation, depreciation and amortisation less the effects of NZ
                                    IFRS 16: Leases, gains and losses on the sale or closure of businesses, acquisition and
Underlying EBITDA
                                    integration costs, impairment losses (or reversals of impairment losses), restructuring
                                    costs and non-operational items.

                                    Comprises Evolve Education Group Limited and its subsidiaries across New Zealand and
Group
                                    Australia
                                    Number of children attending per period specified as a percentage of the service’s
Occupancy
                                    licensed places

Wage to Revenue ratio               Employee benefits expense as a percentage of total revenue

Total Revenue per FTE per day       Revenue earned per full-time-equivalent child booking per day

Total Revenue per Booking per day   Revenue earned per child booking per day
Disclaimer
The information in this presentation is an overview and does not contain all information necessary to make an investment decision. It is intended to constitute a
summary of certain information relating to the performance of Evolve Education Group Limited (“Evolve Education”) for the current period. Please refer to the
unaudited financial statements for the period ended 30 June 2021 that have been simultaneously released with this presentation.

The information in this presentation does not purport to be a complete description of Evolve Education. In making an investment decision, investors must rely on their
own examination of Evolve Education, including the merits and risks involved. Investors should consult with their own legal, tax, business and/or financial advisors in
connection with any acquisition of financial products.

The information contained in this presentation has been prepared in good faith by Evolve Education. No representation or warranty, expressed or implied, is made as
to the accuracy, adequacy or reliability of any statements, estimates or opinions or other information contained in this presentation, any of which may change without
notice. To the maximum extent permitted by law, Evolve Education, its directors, officers, employees and agents disclaim all liability and responsibility (including
without limitation any liability arising from fault or negligence on the part of Evolve Education, its directors, officers, employees and agents) for any direct or indirect
loss or damage which may be suffered by any person through use of or reliance on anything contained in, or omitted from, this presentation.

This presentation includes non-GAAP financial measures in various sections. This information has been included on the basis that management and the Board believe
that this information assists readers with key drivers of the performance of Evolve Education which are not otherwise disclosed as part of the financial statements.
Past performance information given in this presentation is given for illustrative purposes only and should not be relied upon as it is not an indication of future
performance.

This presentation is not a product disclosure statement, prospectus, investment statement or disclosure document, or an offer of shares for subscription, or sale, in
any jurisdiction.

This presentation may not be reproduced or published, in whole or in part, for any purpose without the prior written consent of Evolve Education.
You can also read