FY2018 Results Presentation - Bapcor
←
→
Page content transcription
If your browser does not render page correctly, please read the page content below
FY2018 Results Presentation
Disclaimer

  The material in this presentation has been prepared by Bapcor Limited (“Bapcor”) ABN 80 153 199 912 and is general background information about
  Bapcor’s activities current at the date of this presentation. The information is given in summary form and does not purport to be complete. Information in
  this presentation, including forecast financial information should not be considered as advice or a recommendation to investors or potential investors and
  does not take into account investment objectives, financial situation or needs of any particular investor. These should be considered, with or without
  professional advice when deciding if an investment is appropriate.

  Persons needing advice should consult their stockbroker, solicitor, accountant or other independent financial advisor.

  The release, publication or distribution of this presentation in certain jurisdictions may be restricted by law and therefore persons in such jurisdictions into
  which this presentation is released, published or distributed should inform themselves about and observe such restrictions.

  This presentation does not constitute, or form part of, an offer to sell or the solicitation of an offer to subscribe for or buy any securities, nor the solicitation
  of any vote or approval in any jurisdiction, nor shall there be any sale, issue or transfer of the securities referred to in this presentation in any jurisdiction in
  contravention of applicable law.

  Certain statements made in this presentation are forward-looking statements. These forward-looking statements are not historical facts but rather are
  based on Bapcor’s current expectations, estimates and projections about the industry in which Bapcor operates, and beliefs and assumptions. Words
  such as "anticipates”, "expects”, "intends,", "plans”, "believes”, "seeks”, "estimates”, and similar expressions are intended to identify forward-looking
  statements. These statements are not guarantees of future performance and are subject to known and unknown risks, uncertainties and other factors,
  some of which are beyond the control of Bapcor, are difficult to predict and could cause actual results to differ materially from those expressed or
  forecasted in the forward- looking statements. Bapcor cautions investors and potential investors not to place undue reliance on these forward-looking
  statements, which reflect the view of Bapcor only as of the date of this presentation. The forward-looking statements made in this presentation relate only
  to events as of the date on which the statements are made. Bapcor will not undertake any obligation to release publicly any revisions or updates to these
  forward-looking statements to reflect events, circumstances or unanticipated events occurring after the date of this presentation except as required by law
  or by any appropriate regulatory authority.
                                                                                                                                                                          2

                          ”Australasia’s leading provider of aftermarket parts, accessories, equipment and services”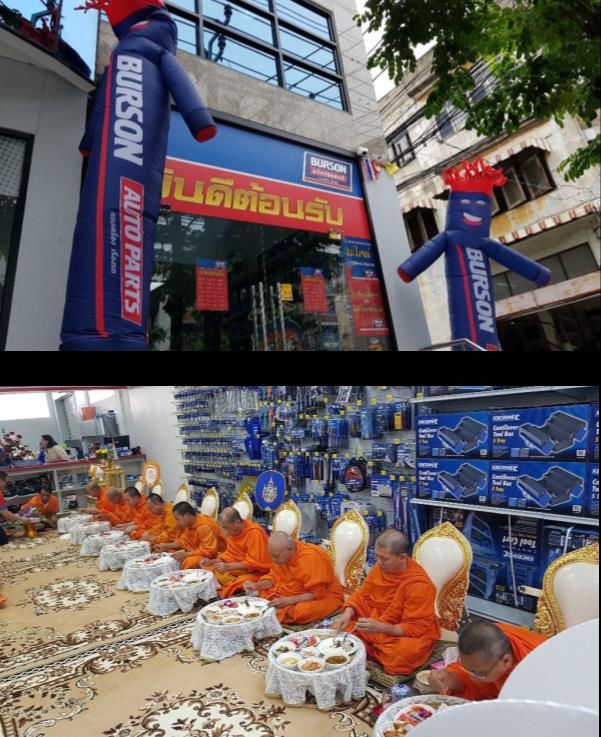
AFTERMARKET SUPPLY CHAIN

                                                            1           FY2018 Results

                                                            2           FY2018 Result Details

                                                            3           Strategy Update

                                                            4           FY2019 Trading Update

                                                            5           Q&A

                                                                                                  3
     ”Australasia’s leading provider of aftermarket parts, accessories, equipment and services”
1           FY2018 Results

                                                       2           FY2018 Result Details

                                                       3           Strategy Update

                                                       4           FY2019 Trading Update

                                                       5           Q&A

                                                                                             4

”Australasia’s leading provider of aftermarket parts, accessories, equipment and services”
FY2018 Headline Results

             22%                                           32%                                                27%

         REVENUE                                           NPAT                                               EPS

     Up 22% to $1,237M                             Up 32% to $86.5M                                 Up 27% to 30.99 cps
        (continuing ops)                           (proforma continuing ops)                          (proforma continuing ops)

                                                   Up 48% to $94.7M                                 Up 43% to 33.90 cps
                                                           Statutory                                          Statutory

                                                                                                                                  5
                 ”Australasia’s leading provider of aftermarket parts, accessories, equipment and services”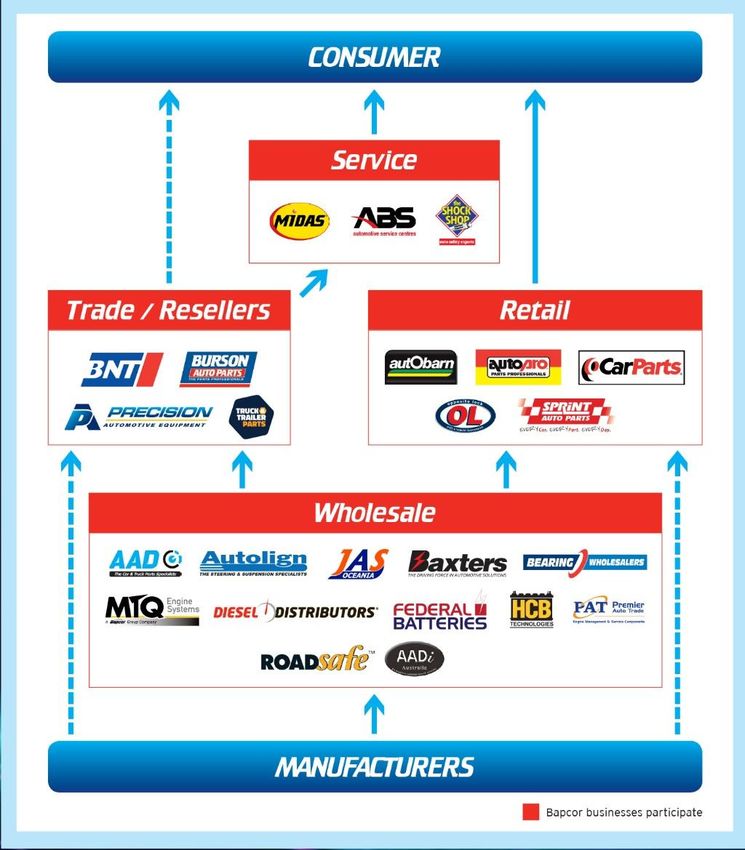
FY2018 Operational Highlights
Delivered result in line with guidance – have done each year since IPO in 2014
Every business segment showing improvement on prior year
Trade continues to perform extremely well, as does Specialist Wholesale and Bapcor
New Zealand
Retail & Service making good progress, in line with plan
Intercompany sales & own brand increasing
Completed divestment of non-core assets with investment proceeds of NZ$103M
Resulting in a gain on divestments of $7M in statutory NPAT
Successful integration of Hellaby Automotive acquisition and delivered on synergies.
6
”Australasia’s leading provider of aftermarket parts, accessories, equipment and services”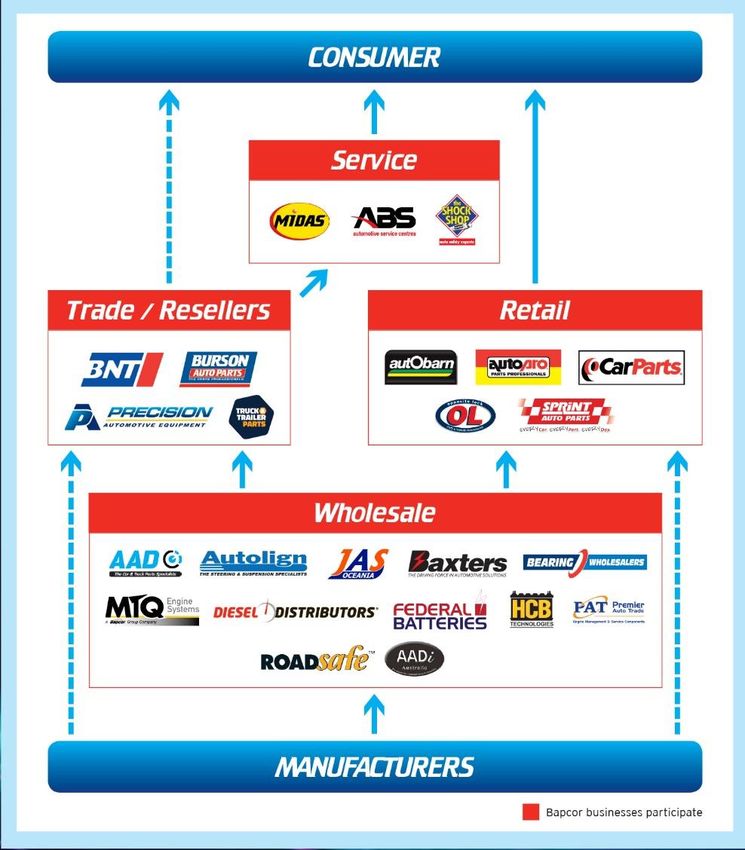
FY2018 Financial Highlights

                                                                            FY18                   FY17                Variance
             Continuing Operations
             Revenue                                  $’M                       1,236.7               1,013.6            22.0%
             Gross Margin                              %                         46.0%                  45.7%            0.3 pp
             EBITDA – proforma                        $’M                         150.0                  117.4           27.7%
             EBITDA                                    %                         12.1%                  11.6%            0.5 pp
             NPAT – proforma                          $’M                           86.5                   65.8          31.6%
             EPS – proforma                           cps                         30.99                  24.40           27.0%

             Total Bapcor (including Discontinued Operations)
             NPAT – statutory                         $’M                           94.7                   63.8          47.8%
             EPS – statutory                          cps                         33.90                  23.76           42.7%
             Dividend                                 cps                           15.5                   13.0          19.2%

                    Notes:
                    1.   Hellaby was acquired in January 2017 and hence is included for the full year FY18, but only six months
                         in the prior year.
                    2.   Discontinued Operations include Hellaby Footwear, Contract Resources and TBS.

                                                                                                                                  7
             ”Australasia’s leading provider of aftermarket parts, accessories, equipment and services”
Summary of Key Performance Indicators

                                               Revenue *                                                    EPS (cps) *

                                                                                1,236.7                                               31.0
                                                           1,013.6                                                         24.4
                                       685.6                                                         17.9
                                                                                           13.6
                  375.3

                 FY2015               FY2016               FY2017                FY2018   FY2015    FY2016                FY2017     FY2018

                                                NPAT *                                             Dividends per share
                                                                                                             Interim   Final

                                                                                                                                      8.5
                                                                                  86.5                                         7.5
                                                                                                     6.0
                                                             65.8                          4.7
                                        43.6
                                                                                                                                      7.0
                  23.1                                                                               5.0                       5.5
                                                                                           4.0

                 FY2015               FY2016               FY2017                FY2018   FY2015    FY2016                FY2017     FY2018

        * Based on continuing operations only and proforma results where appropriate
                                                                                                                                              8

                      ”Australasia’s leading provider of aftermarket parts, accessories, equipment and services”
Comparative Total Return to Shareholders
- over last four years

              Source: KPMG
                                                                                                               9

                  ”Australasia’s leading provider of aftermarket parts, accessories, equipment and services”
Business Segment Results – continuing operations

                                                                                                                     EBITDA %
                                               Revenue                                      EBITDA
                                                                                                                      Revenue
    $’M Proforma
                                   FY18         FY17        % Change            FY18         FY17         % Change   Change

    Trade                             501.6        465.1     7.8%                   72.1          63.3     13.9%     +0.8 pp

    Bapcor NZ                         177.9          87.1   104.1%                  22.7            9.3   144.3%     +2.1 pp

    Specialist Wholesale              364.3        272.3     33.8%                  38.6          28.0     37.7%     +0.3 pp

    Retail & Service                  239.1        221.0     8.2%                   28.8          27.6     4.4%       -0.5 pp

    Group / Elims                     (46.2)       (31.9)    44.7%                 (12.3)       (10.8)    (13.5%)

    Continuing operations           1,236.7      1,013.6     22.0%                 150.0        117.4      27.7%     +0.5 pp

            NOTE: The former Hellaby Automotive Specialist Wholesale businesses based in Australia have been
            reallocated to Specialist Wholesale Group for FY18 and FY17. Refer ASX release on 20 July 2018.
                                                                                                                                10

                    ”Australasia’s leading provider of aftermarket parts, accessories, equipment and services”
Business Segment Contribution to Results
Total Auto Revenue Total Auto EBITDA
FY2018 FY2017 FY2018 FY2017
24% 22%
28% 26%
$1.2B 53%
$1.0B 53%
$150M $117M
58% 57%
18% 22%
19% 21%
11
”Australasia’s leading provider of aftermarket parts, accessories, equipment and services”Burson Trade
Revenue and "Same Store" growth EBITDA % of Sales
14.4%
501.6 13.6%
465.1
419.1 12.4%
11.8%
375.3
4.6% 4.6% 4.6% 4.4%
FY2015 FY2016 FY2017 FY2018
FY Same Store growth % FY2015 FY2016 FY2017 FY2018
EBITDA $M Store numbers
170
72.1 160
63.3 145
130
51.8
44.3
FY2015 FY2016 FY2017 FY2018 FY2015 FY2016 FY2017 FY2018
12
”Australasia’s leading provider of aftermarket parts, accessories, equipment and services”Burson Trade
• Good revenue and EBITDA growth
$’M FY18 FY17 Change
• FY18 same store sales growth of 4.4%
Revenue 501.6 465.1 7.8%
• Equipment sales growth very strong
EBITDA 72.1 63.3 13.9% • Margin up 0.8pp for the full year
EBITDA % 14.4% 13.6% +0.8 pp • +10 new stores in FY18, now at 170.
• 5 year target number of total stores increased from 200 to 230
Stores 170 160 +10
• Workstreams in place to increase Own Brand ratio
• People pipeline and training a high priority
• Acquired Tricor Engineering, specialising in supply & installation
of lubrication equipment for workshops, on 3 July 2017.
13
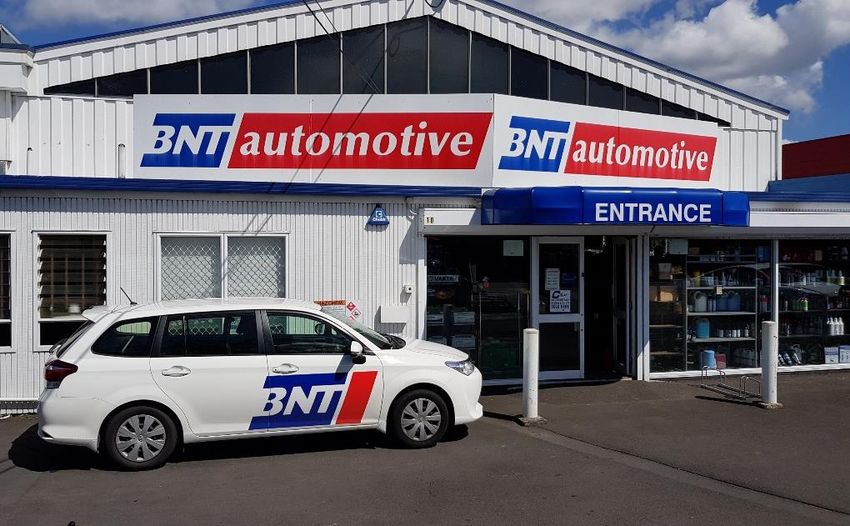
”Australasia’s leading provider of aftermarket parts, accessories, equipment and services”Bapcor NZ
$’M NZD FY18 FY17 Change • Significant Revenue and EBITDA growth with full 12 months in
Revenue 192.9 92.8 107.8% FY18 versus 6 months results in FY17 post Hellaby acquisition
• Revenue growth of 5.7% and EBITDA growth of 33.1%
EBITDA 24.6 9.9 148.7% (assuming include full year of Hellaby FY17 results)
EBITDA % 12.8% 10.7% +1.2 pp
• Full year BNT same store sales up 6.1%
• H2 lower than H1 due to stronger comparative period
BNT Stores 57 56 +1
• Good margin growth reflecting optimisation benefits and
pricing management.
• Optimisation benefits on target
• Bapcor NZ reflects the NZ based operations of the • Many growth opportunities in progress
Hellaby acquisition. The Australian based
operations have been moved to Specialist • Implemented leadership and sales training
Wholesale. FY17 comparatives have been changed
to reflect this change.
14
”Australasia’s leading provider of aftermarket parts, accessories, equipment and services”Specialist Wholesale
• Specialist Wholesale reflects a full twelve months results of the
$’M FY18 FY17 Change Australian based Hellaby Automotive businesses.
Revenue 364.3 272.3 33.8% • 11 business units now comprise Specialist Wholesale
• Revenue growth of 11.0% and EBITDA growth of 16.2%
EBITDA 38.6 28.0 37.7% (assuming include full year of Hellaby FY17 results)
EBITDA % 10.6% 10.3% +0.3 pp • Good performance throughout the portfolio of businesses
• Large pipeline of projects for intercompany product range
substitution.
• A number of business units back office function transitioned
into Shared Services centre
• Specialist Wholesale now includes the Australian
based operations of the Hellaby acquisition. These • DC improvements delivering improved customer service
were moved from the Bapcor NZ segment. FY17
comparatives have been changed to reflect this • Acquired AADi, a specialist importer/distributor of driveshafts,
change. CV’s, wheel bearings and shock absorbers, on 30 April 2018
15
”Australasia’s leading provider of aftermarket parts, accessories, equipment and services”Retail & Service
$’M FY18 FY17 Change • Growth in Autobarn company stores driving revenue growth of
8.2%
Revenue 239.1 221.0 8.2%
• EBITDA increased by 4.4%
EBITDA 28.8 27.6 4.4% • Autobarn same store sales of 4.7% for company owned and
EBITDA % 12.0% 12.5% -0.5 pp 1.4% for franchise stores
• Autobarn Number 1 in Auto Stores customer satisfaction survey
Autobarn store numbers conducted by Roy Morgan – significant jump compared to last
Company owned 48 31 +17 year
Franchise 80 91 -11 • 8 greenfield stores and 9 franchise conversions during the
period
Total 128 122 +6
• Now 38% of Autobarn stores are company owned. Number of
% coy stores 38% 25% +13 pp
company stores has tripled in the last two years
Other stores 250 263 -13 • EBITDA % of revenue down 0.5 pp due to increased sales from
company stores that impacts revenue mix
16
”Australasia’s leading provider of aftermarket parts, accessories, equipment and services”Discontinued Operations - statutory
$ FY18 FY17 Change • Divested in FY18;
Revenue 145.6 196.6 (25.9%) • Footwear – divested end September 2017
• Contract Resources – divested September / October 2017
NPAT – stat1 10.2 10.3 (1.0%)
• TBS – divested March 2018
NPAT Reconciliation:
Disc Operations during year until divested1 6.7
Reserve reclassifications 0.4
Gain on sale of divestments 7.0
Tax (3.9)
1. Includes minority interest adjustment of $0.3M (PY: $0.2M) Statutory NPAT 10.2
17
”Australasia’s leading provider of aftermarket parts, accessories, equipment and services”1 FY2018 Results
2 FY2018 Result Details
3 Strategy Update
4 FY2019 Trading Update
5 Q&A
18
”Australasia’s leading provider of aftermarket parts, accessories, equipment and services”Summary Income Statement
Revenue growth of 22% delivered by
Segment Growth Pro-forma, $’M FY18 FY17 Change
Burson Trade 7.8% Continuing Operations
Bapcor NZ 104.1% Revenue 1,236.7 1,013.6 22.0%
Specialist Wholesale 33.8% Gross Profit 569.4 463.3 22.9%
Retail & Service 8.2% Margin (%) 46.0% 45.7% 0.3 pp
CODB (419.4) (345.9) 21.3%
Same Store sales growth CODB (%) (33.9%) (34.1%) 0.2 pp
Burson Trade 4.4% EBITDA 150.0 117.4 27.7%
BNT 6.1%
Autobarn company stores 4.7% EBITDA (%) 12.1% 11.6% 0.5 pp
Autobarn Franchised stores 1.4% Depreciation and Amortisation (15.6) (13.5) 15.2%
EBIT 134.4 103.9 29.4%
Gross margin % up 0.3 percentage points
GM% is a continuous focus across all segments Finance Costs (13.5) (9.6) 40.3%
Includes the benefits of the optimisation projects Profit Before Tax 120.9 94.3 28.3%
Income Tax Expense (34.5) (28.5) 21.0%
CODB as a % of sales down 0.2 percentage points
Cost control focus across all segments and optimisation benefits Non-controlling Interest 0.1 - 100%
NPAT - continuing 86.5 65.8 31.6%
Finance costs up due to Hellaby acquisition funding
NPAT (%) 7.0% 6.5% 0.5 pp
Proforma NPAT from continuing operations up 31.6% EPS(1) (CPS) 30.99 24.40 27.0%
EPS from continuing operations up 27.0%
Note: 1. EPS is based on the TERP adjusted weighted number of shares on issue
during the year as per accounting standard AASB-133
19
”Australasia’s leading provider of aftermarket parts, accessories, equipment and services”Summary Cash Flows
$’M FY18
EBITDA – Proforma 150.0
Strong cash conversion of 98.9%
Operating cash flow before finance, transaction and tax costs 148.3
Working capital excluding impact of acquisitions and
Cash conversion 98.9%
new stores as a % of sales has decreased by 1.7 pp to
Financing costs (14.7)
17.5% compared to June 2017 Payments associated with discontinued operations (0.7)
Capex and acquisitions Payments associated with restructuring activities (2.0)
Transaction costs (0.7)
Capex mainly reflects investment in new stores, Tax paid (38.1)
purchase of motor vehicles, IT development and front of Operating cash flows 92.1
store refurbs Store acquisition and greenfields (17.0)
Business acquisitions includes Tricor and AADi and Business acquisitions – net of cash – including deferred payments (14.8)
Capital expenditure (excluding new stores) (15.6)
deferred payments for Precision, Sprints and TBS
Dividend paid (31.8)
Net cash generated is positive $57.1M excluding Treasury shares and equity costs (3.0)
acquisitions, dividends and divestment proceeds. Other 0.6
Cash generated excluding divestments 10.5
Divestment proceeds
Cashflow includes proceeds related to divestments of Divestment proceeds – net of expenses 93.7
Contract Resources, TBS and Footwear divisions of
Cash generated 104.2
Hellaby
Opening cash on hand 39.8
Borrowing repayments (103.8)
Net cash movement 104.2
Closing cash on hand 40.2
20
”Australasia’s leading provider of aftermarket parts, accessories, equipment and services”Summary Balance Sheet
$’M FY18 FY17
Cash 40.2 39.8
Net Debt/Cash Trade and other receivables 146.8 136.1
Net debt at June 2018 is $289.5M Inventories 287.3 261.6
Represents annualised leverage ratio of less than PP&E 52.6 49.8
2.0X on a twelve month EBITDA basis
Deferred tax assets 17.8 18.7
Intangible assets 677.7 647.8
Dividends
Assets held for sale - 178.9
Final dividend declared for FY18 of 8.5 cents per
Other assets 5.2 4.1
share fully franked
Total assets
Record date 31 August 2018 1,227.5 1,336.7
Pay date 27 September 2018 Trade and other payables 187.8 174.8
Dividend reinvestment plan will continue for the Tax liabilities 2.4 3.5
FY18 final dividend Provisions 68.0 65.5
Borrowings 326.5 429.7
Liabilities held for sale - 70.8
Notes: Other 0.5 2.4
1. Net debt is based on borrowings less cash of ($286.3M), adding in financial derivative
assets of $1.3M, less capitalized borrowing costs including in borrowings of ($2.0) and
Total liabilities 585.2 746.7
removing cash pertaining to the non-controlling interest of ($2.5M)
Net assets 642.3 590.0
21
”Australasia’s leading provider of aftermarket parts, accessories, equipment and services”Inventory Provision
$ $’M
Balance at 1 July 2017 54.0
Additional provisions recognised against profit 1.9
Additions through business combinations 1.2
Inventory written off against provision (9.9)
Foreign currency translation (0.4)
Balance at 30 June 2018 46.8
• Profit has not been enhanced by the release of inventory provision
• No inventory provision was released to profit in FY18; in fact there was an expense charged to profit of $1.9M
representing businesses as usual recognition of slow and obsolete inventory
• Provisions of $1.2M were raised during the year relating to acquired businesses by applying Bapcor’s
provisioning policy which is consistently applied to all acquisitions
• Obsolete inventory scrapped (sent to recycling) of $9.9M in FY18 – related to previous Metcash and Hellaby
acquisitions. This had been recognised and provided for at time of acquisition in line with Bapcor’s policy
• We continue to apply inventory provisioning policy consistently and disclose all movements in reporting
22
”Australasia’s leading provider of aftermarket parts, accessories, equipment and services”1 FY2018 Results
2 FY2018 Result Details
3 Strategy Update
4 FY2019 Trading Update
5 Q&A
23
”Australasia’s leading provider of aftermarket parts, accessories, equipment and services”Aftermarket Supply Chain
24
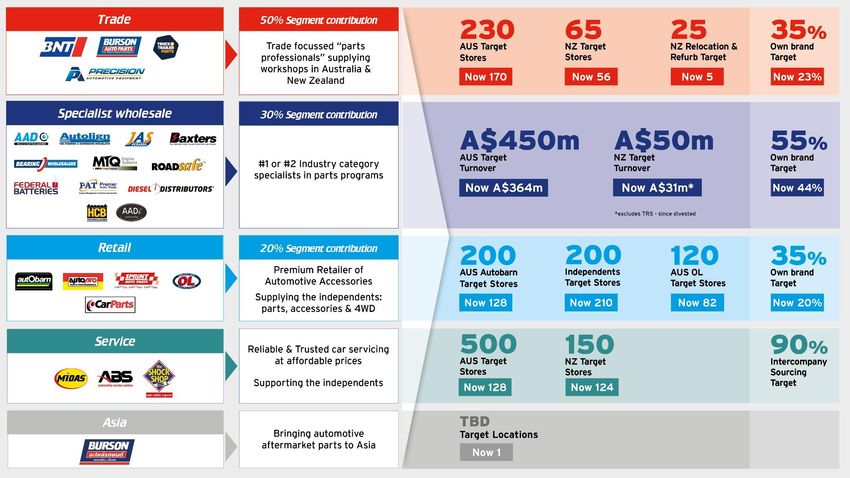
”Australasia’s leading provider of aftermarket parts, accessories, equipment and services”Bapcor 5 Year Strategic Targets
25
”Australasia’s leading provider of aftermarket parts, accessories, equipment and services”Strategy
Consistent strategy with specific, clear, measurable targets.
No changes to direction.
We know what we do best and stick with it.
26
”Australasia’s leading provider of aftermarket parts, accessories, equipment and services”1 FY2018 Results
2 FY2018 Result Details
3 Strategy Update
4 FY2019 Trading Update
5 Q&A
27
”Australasia’s leading provider of aftermarket parts, accessories, equipment and services”Trading Update
TRS, a NZ tyre & wheel specialist business,
was divested in July 2018 for NZ$20M
First store in Asia opened – formal grand
opening was held 10 August 2018
FY19 YTD all business segments tracking to
expectations
FY19 expect continued revenue & profit
growth
Consensus EBITDA circa $170M
Increase NPAT between 9% & 14%
above FY18 proforma NPAT
28
”Australasia’s leading provider of aftermarket parts, accessories, equipment and services”1 FY2018 Results
2 FY2018 Result Details
3 Strategy Update
4 FY2019 Trading Update
5 Q&A
29
”Australasia’s leading provider of aftermarket parts, accessories, equipment and services”Appendix – Statutory to Proforma Reconciliation
30
”Australasia’s leading provider of aftermarket parts, accessories, equipment and services”You can also read