DBS Pulse of Asia Conference - 8 January 2019 - NetLink NBN Trust

 
CONTINUE READING
DBS Pulse of Asia Conference - 8 January 2019 - NetLink NBN Trust
DBS
Pulse of Asia Conference
8 January 2019

The joint issue managers of the initial public offering and listing of NetLink NBN Trust were DBS Bank Ltd., Morgan Stanley Asia
(Singapore) Pte., and UBS AG, Singapore Branch. The joint underwriters of the initial public offering and listing of NetLink NBN
Trust were DBS Bank Ltd., Morgan Stanley Asia (Singapore) Pte., UBS AG, Singapore Branch, Merrill Lynch (Singapore) Pte.
Ltd., Citigroup Global Markets Singapore Pte. Ltd., The Hongkong and Shanghai Banking Corporation Limited, Singapore
Branch, Oversea-Chinese Banking Corporation Limited, and United Overseas Bank Limited. The joint issue managers and joint      1
underwriters of the initial public offering assume no responsibility for the contents of this presentation.
DBS Pulse of Asia Conference - 8 January 2019 - NetLink NBN Trust
Disclaimer
This presentation is for information purposes only and does not constitute or form part of an offer, solicitation, recommendation or invitation for the sale or
purchase or subscription of securities, including units in NetLink NBN Trust (the “Trust” and the units in the Trust, the “Units”) or any other securities of the
Trust. No part of it nor the fact of its presentation shall form the basis of or be relied upon in connection with any investment decision, contract or commitment
whatsoever.

The information and opinions in this presentation are provided as at the date of this document (unless stated otherwise) and are subject to change without
notice, its accuracy is not guaranteed and it may not contain all material or relevant information concerning NetLink NBN Management Pte. Ltd. (the
“Trustee-Manager”), the Trust or its subsidiaries (the “Trust Group”). None of the Trustee-Manager, the Trust nor its affiliates, advisors and representatives
make any representation regarding, and assumes no responsibility or liability whatsoever (in negligence or otherwise) for, the accuracy or completeness of,
or any errors or omissions in, any information contained herein nor for any loss howsoever arising from any use of this presentation. Further, nothing in this
presentation should be construed as constituting legal, business, tax or financial advice.

The information contained in this presentation includes historical information about and relevant to the assets of the Trust Group that should not be regarded
as an indication of the future performance or results of such assets. Certain statements in this presentation constitute “forward-looking statements”. These
forward-looking statements are based on the current views of the Trustee-Manager and the Trust concerning future events, and necessarily involve risks,
uncertainties and assumptions. These statements can be recognised by the use of words such as "expects", "plans", "will", "estimates", "projects", "intends"
or words of similar meaning. Actual future performance could differ materially from these forward-looking statements, and you are cautioned not to place any
undue reliance on these forward-looking statements. The Trustee-Manager does not assume any responsibility to amend, modify or revise any forward-
looking statements, on the basis of any subsequent developments, information or events, or otherwise, subject to compliance with all applicable laws and
regulations and/or the rules of the Singapore Exchange Securities Trading Limited (the “SGX-ST”) and/or any other regulatory or supervisory body or agency.

This document contains certain non-SFRS financial measures, including EBITDA and EBITDA margin, which are supplemental financial measures of the
Trust Group’s performance and liquidity and are not required by, or presented in accordance with, SFRS, IFRS, IFRS-identical Financial Reporting
Standards, U.S. GAAP or any other generally accepted accounting principles. Furthermore, EBITDA and EBITDA margin are not measures of financial
performance or liquidity under SFRS, IFRS, IFRS-identical Financial Reporting Standards, U.S. GAAP or any other generally accepted accounting principles
and should not be considered as alternatives to net income, operating income or any other performance measures derived in accordance with SFRS, IFRS,
IFRS-identical Financial Reporting Standards, U.S. GAAP or any other generally accepted accounting principles. You should not consider EBITDA and
EBITDA margin in isolation from, or as a substitute for, analysis of the financial condition or results of operation of the Trust Group, as reported under SFRS.
Further EBITDA and EBITDA margin may not reflect all of the financial and operating results and requirements of the Trust Group. Other companies may
calculate EBITDA and EBITDA margin differently, limiting their usefulness as comparative measures.

                                                                                                                                                                2
DBS Pulse of Asia Conference - 8 January 2019 - NetLink NBN Trust
Overview

                     Key Highlights                                                          Financial Snapshot

•    Sole appointed “Network Company”                                                                           H1         Variance vs
                                                                           $m
                                                                                                               FY19        Projection(1)
     for Singapore's Next Gen NBN
•    Resilient business model generates                                    Revenue                             176.7             4.8%
     long-term, predictable cash flows
                                                                           EBITDA                              122.2             3.8%
     through:
       • Growing demand for fibre                                          EBITDA Margin                       69.2%          0.6 p.p
          connections                                                      Profit After Tax                     37.7          21.4%
       • Regulated and transparent
                                                                           Distribution Per Unit
          pricing                                                                                              2.44               n/a
                                                                           (Cents)
       • Creditworthy customers
•    “Future-proof” fibre infrastructure                                   $m                                   As at 30 Sep 2018
•    Strong balance sheet to support                                       Market
     growth                                                                                                               3,040
                                                                           Capitalisation(2)
•    Constituent of FTSE ST Large & Mid
                                                                           Enterprise Value(2)                            3,523
     Cap Index, FTSE ST Singapore
     Shariah Index and the MSCI Global                                     Net Assets                                     3,088
     Small Cap – Singapore Index                                           NAV per unit (Cents)                           79.2
 (1) Projection for H1 was part of the Projection Year 2019’s projection disclosed in the prospectus dated 10 Jul 2017.
 (2) Based on the unit price of $0.78 as at 28 Sep 2018.
                                                                                                                                        3
Fibre is a critical infrastructure
enabling Singapore’s Next Gen NBN

                                Fibre is the medium of
                           #1    choice for delivering
                                 broadband services
  Fibre capacity
    is scalable
                                                About 9 out of 10
                           FIBRE IS            homes in Singapore
                       ‘FUTURE PROOF’         has a fibre termination
                                                  point installed

  Fibre is used to                             Fibre broadband
 support wireless                             prices are lower in
  access solution                            Singapore than many
   such as WiFi                                 other countries
hotspots and 3G/4G
mobile base stations
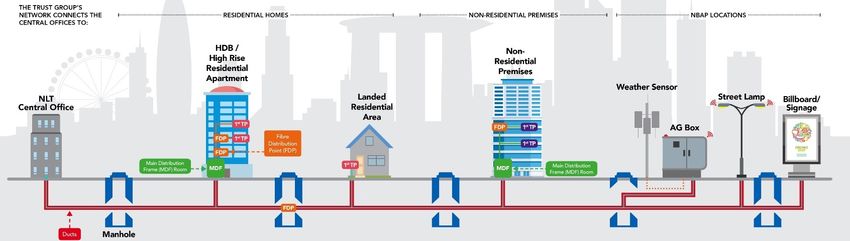
                                                               4
Our network

                    1,241,018     45,514                     1,280
                      End-Users   End-Users                Connections

                                                           * Figures are as at 30 Sep 2018

          ~90% share of               ~35% share of
          residential market      non-residential market

                                                                                  5
A resilient business model

                                      RAB Revenue                                        Non-RAB Revenue

                                                               NLT

                     Residential    Non-        NBAP and     Ducts and   Installation   Diversion   Co-Location    Central
                     Connections Residential    Segment      Manholes      Related      Revenue      and Other     Office
                                 Connections      Fibre       Service     Revenue                    Revenue      Revenue
                                               Connections   Revenue
           % of
         H1 FY19
         Revenue        57.0%      8.4%          1.9%        10.6%         5.8%          6.0%         5.6%         4.7%

Recurring,
predictable cash                                                          −            −                        
flows
Long-term
contracts /                                                               −            −                        
customer stability
Regulated
revenues
                                                                                      −                        −
Creditworthy
customers
                                                                                                              

                                                                                                                         6
Fibre connections
                Residential                                                   Non-Residential                                     Non-Building Address Points

’000                                                            ’000

1,300                                                           50                                                                                                           1,592
                                    1,278.3                                                             47.3                     1,600
                                                                                                 45.5
                       2.0% 1,241.0                                                   43.9 44.8
                                                                                               1.6%                              1,400
                        1,217.1
                                                                               38.5                                                                                  1,280
1,200              1,192.5                                      40                                                                                      13.4%
                                                                                                                                 1,200                       1,129
                                                                       31.5
            1,094.8                                             30                                                               1,000
1,100
                                                                                                                                                     835

                                                                                                                IPO Projection

                                                                                                                                                                                      IPO Projection
                                               IPO Projection

                                                                                                                                  800

1,000                                                           20
                                                                                                                                  600

                                                                                                                                                                              IPO Projection
                                       IPO Projection

                                                                                                        IPO Projection
        938.0
                                                                                                                                  400          357
 900                                                            10

                                                                                                                                  200    142

 800                                                              0                                                                 0
        FY16A FY17A FY18A    Q1    Q2 FY19E                            FY16A FY17A FY18A    Q1    Q2 FY19E                               FY16A FY17A FY18A    Q1    Q2 FY19E
                            FY19A FY19A                                                    FY19A FY19A                                                       FY19A FY19A

                                                                                                                                                                                   7
Q2 Profit & loss statement

 S$’000                           Q2 FY19           Projection(1)        Variance (%)            Revenue was higher than
                                                                                                 projection mainly due to
 Revenue                            90,594              84,876                  6.7              higher diversion revenue
                                                                                                 and ducts & manhole service
                                                                                                 revenue, this was partially
 EBITDA                             61,239              59,427                  3.0              offset by lower than
                                                                                                 projected installation-related
 EBITDA margin (%)                  67.6(2)               70.0              (2.4p.p)             revenue.

 Depreciation &                                                                                  EBITDA margin was lower
                                   (40,030)            (40,865)                (2.0)
 amortisation                                                                                    than projection mainly due to
                                                                                                 the higher diversion
 Net finance charges               (4,340)             (5,042)               (13.9)              revenues which carry lower
                                                                                                 margins as compared to the
                                                                                                 overall EBITDA margins of
 Profit before tax                  16,869              13,520                 24.8
                                                                                                 the Trust Group.
(1) Projection for Q2 FY19 was part of the Projection Year 2019’s projection disclosed in the
    prospectus dated 10 July 2017.
(2) Excluding the impact of the higher diversion revenues, the Trust Group would have achieved
    EBITDA margin of 70.4% in Q2 FY19.

                                                                                                                            8
H1 Profit & loss statement

 S$’000                           H1 FY19           Projection(1)        Variance (%)            Revenue was higher than
                                                                                                 projection mainly due to
 Revenue                           176,706             168,671                  4.8              higher diversion revenue
                                                                                                 and ducts & manhole service
                                                                                                 revenue, this was partially
 EBITDA                            122,231             117,766                  3.8              offset by lower than
                                                                                                 projected installation-related
 EBITDA margin (%)                  69.2(2)              69.8               (0.6p.p)             revenue.

 Depreciation &                                                                                  EBITDA margin was lower
                                   (79,806)            (81,730)                (2.4)
 amortisation                                                                                    than projection mainly due to
                                                                                                 the higher diversion
 Net finance charges               (8,484)            (10,085)               (15.9)              revenues which carry lower
                                                                                                 margins as compared to the
                                                                                                 overall EBITDA margins of
 Profit before tax                  33,941              25,951                 30.8
                                                                                                 the Trust Group.
(1) Projection for H1 FY19 was part of the Projection Year 2019’s projection disclosed in the
    prospectus dated 10 July 2017 (the “Prospectus”).
(2) Excluding the impact of the higher diversion revenues, the Trust Group would have achieved
    EBITDA margin of 71.1% in H1 FY19.

                                                                                                                            9
Balance sheet as at 30 Sep 2018

Cash Balance                                                                       S$153m

Gross Debt                                                                         S$636m

Net Assets                                                                       S$3,088m

Gross Debt/EBITDA                                                                      2.6x

EBITDA Interest Cover                                                                 14.1x

Net Assets per unit(1)                                                                 79.2
(1)   Net assets per unit represents equity divided by total number of units (3,896,971,100)

                                                                                               10
Growth opportunities

  In the next   Residential homes not on Increasing Non-residential NBAP demand
    5 years      fibre broadband & new           end-users           from Smart
                  household formations                               Nation, IoT
                                                                     and mobile

                            Residential and Non-residential

                                Smart                           5G Mobile
 Beyond the                                       IoT
                                Nation                          technology
 next 5 years

                                                                             11
Attractive distribution yield with low risk
                                                     NetLink NBN’s Distribution Yield vs Other Investments 1

                         7%
                                     6.3% 2
                         6%                                                                                                                       5.5%
Distribution Yield (%)

                         5%
                                                                                                                                 4.3%
                         4%

                         3%                           2.5%                                                        2.5%
                                                                          2.3%
                         2%

                         1%
                                                                                              0.4%

                         0%
                                NetLink Yield    10-YR Singapore   5-YR Singapore Govt Bank 12-month Fixed   CPF Ordinary A/C   STI Yield   FTSE ST REIT Yield
                                                    Govt Bond             Bond            Deposit Rate         Interest Rate

                         •    Assuming the distribution for the second half of the financial year is the same as the first half, the
                              annualised DPU of 4.88 cents represents an increase of 5.2% over the projected DPU of 4.64 cents
                         •    The Trust’s distribution policy is to distribute 100% of its CAFD3
                         •    Distributions made by the Trust are exempt from Singapore income tax in the hands of all
                              Unitholders
                         1 Source:  Bloomberg as at 28 Sep 2018
                         2 Distribution yield is based on the assumption that the annualised DPU is 4.88 cents (as mentioned above) and the unit price of
                         $0.78 cents as at 28 Sep 2018
                         3 Cash Available for Distribution as defined in the prospectus dated 10 July 2017

                                                                                                                                                            12
Well-positioned to deliver long-term value and growth

      1   Critical infrastructure enabling Singapore’s Next Gen NBN

                Resilient business model with transparent, predictable and
            2
                regulated revenue stream

                    Sole nationwide provider of residential fibre network in
                3
                    Singapore

                    Well-positioned to benefit from growth in the non-residential
                4
                    segment as the independent nationwide network provider

                Well-positioned to capitalise on growth in connected services
            5
                including Singapore’s Smart Nation initiatives

      6   Extensive nationwide network affording natural barrier to entry

                                                                                13
Thank You

            14
Supplemental Business
Information

                        15
NetLink Trust’s pricing for its services

Pricing of NLT’s principal services are regulated by IMDA
 • IMDA shall hold a review of pricing terms every five years following the last price review, or at any such time as IMDA may
   consider appropriate (which may include a mid-term review in the third year from the last price review)

   – The most recent review by IMDA of prices under the Interconnection Offer and Reference Access Offer was completed in
     May 2017 and substantially most of the revised prices will be effective from or around Jan 2018 to Dec 2022

   – Pricing terms are regulated using the regulatory asset base (RAB) framework, which allows NLT to recover the following
     components: (a) return of capital deployed (i.e. depreciation); (b) return on capital employed; and (c) operating expenditure

 • NLT may propose to conduct a mid-term adjustment in the third year, in the event of any significant change in cost inputs or if any
   significant changes to cost or demand forecasts are required due to unforeseen circumstances

Monthly recurring charge (MRC) for fibre connections

                Residential                                        S$13.80 per connection per month

             Non-residential                                          S$55 per connection per month

                    NBAP                                           S$73.80 per connection per month

                                                                                                                                     16
NetLink Trust’s pricing for its services

Framework for RAB Based Pricing Model                                                   Methodology for RAB based pricing model

1                                                                                       1
                                                                                                           • Base year of the RAB is 2012
                 RAB                                                WACC
                                                                                                              – Assets purchased up to 2012 are valued at 2012
                                                                                             Cost Base
                                                                                                                prices
                                                                                              for RAB
                                                                                                              – Assets purchased after 2012 are valued at actual
                                                                                                                cost

                         2                                                              2                  • Nominal pre-tax WACC of 7.0% for the current review
                                 Return on Capital                                                           period
                                                                                                              – Derived using the capital asset pricing model
                                                                              EAC =          Return on

                                            +                               Regulated
                                                                             EBITDA
                                                                                             Capital (1)   • Nominal Pre-tax WACC =

                                                                                                              Cost of equity x
                                                                                                                                 (1 – gearing)
                                                                                                                                   (1 – tax)
                                                                                                                                               + Cost of debt x gearing
                         3
                             Regulatory Depreciation
                                                                                        3
                                                                                                           • Based on Annuity Method of Depreciation
                                                                                                           • Useful life of assets:
                                            +                                                Regulatory
                                                                                            Depreciation      – Ducts and manholes: 35 years

                         4                                                                                    – Fibre and related infrastructure: 25 years
                                  Regulatory Opex
                                                                                        4

                                                                                            Regulatory     • NLT is allowed to recover a portion of its operating
                                Regulated Revenue                                             Opex           expenditure spent as part of the RAB

 1. IMDA may change the rate of applicable pre-tax WACC in future review period

                                                                                                                                                                    17
Understanding the ICO pricing framework
 Illustrative Worked Example
How Does EAC Work for 1 Year’s Outflow on Capex?
Assuming Opening RAB of S$1Bn, WACC of 7.0% and Asset Useful Life of 10 Years
EAC (S$ MM)                                                                                                                                                                               RAB (S$MM)
300                                                                                                                                                                                               1,000

                                                                                                                                                                                                  750
200
               142                142                  142                142                142                   142                142              142              142         142
                                                                                                                                                                                                  500
                                                                                                                                      34                26              18           9
                                  65                   60                  54                 48                   41
100             70
                                                                                                                                                                                    133           250
                                                                                                                   102                109              116              124
                72                77                   83                  89                 95
  0                                                                                                                                                                                               0
                1                  2                   3                   4                  5                     6                  7                8               9           10
                                                                                                          Years
          Return of Capital (Depreciation Component)         Return on Capital (Interest Component)               RAB

Incremental Capex Leads to Incremental EAC
Assuming Opening RAB of S$1Bn, capex of S$300MM in Year 1 and capex of S$200MM in Year 2
S$ MM
  300
                                                             214                214                   214                 214               214               214             214           214
                                       185
  200                                                        28                 28                    28                  28                 28                28             28             28
                    142                 43                   43                 43                    43                  43                 43                43             43             43

  100
                    142                142                   142                142                   142                 142               142               142             142           142

      0
                     1                  2                    3                  4                     5                    6                 7                 8              9              10
                                                                                                                                                                                                  Years
           EAC from Opening RAB (S$1Bn)                EAC from Additional Capex in Year 1 (S$300MM)                    EAC from Additional Capex in Year 2 (S$200MM)

                          The annuity method of depreciation provides an Equivalent Annual Cost which equates to
                          regulatory depreciation (depreciation component) + return on capital (interest component)

                                                                                                                                                                                                  18
You can also read