AUSTRALIAN STOCK EXCHANGE FILING - HotCopper
←
→
Page content transcription
If your browser does not render page correctly, please read the page content below
Documentation financière et conformité

            AUSTRALIAN STOCK EXCHANGE FILING

Date :                             March 8, 2021

Document filed :                   Québec - Monthly Report on Financial Transactions as at
                                   November 30, 2020

Description :

  For more information, please contact
  Ms. Julie Simard at (418) 643-8887 julie.simard@finances.gouv.qc.ca
  Mr. Pierre-Luc Chouinard at (418) 643-8206 pierre-luc.chouinard@finances.gouv.qc.ca
  Ms. Marjolaine Dion at (418) 643-4469 / (418) 643-8141 marjolaine.dion@finances.gouv.qc.ca
  Ms. Myriam Bouchard at (418) 643-5761 myriam.bouchard@finances.gouv.qc.ca

  390, boulevard Charest Est
  Québec (Québec) G1K 3H4
  Téléphone : (418) 643-8141
  Télécopieur : (418) 528-0984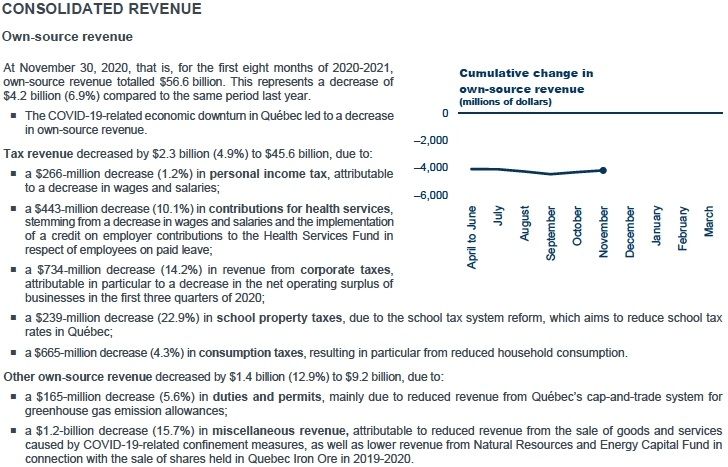
Exhibit 99.14

Note to the reader

The Monthly Report on Financial Transactions provides an overview of the Québec government’s monthly financial results. It is produced to
increase the transparency of public finances and to provide regular monitoring of the achievement of the budgetary balance target for the fiscal year.
The financial information presented in this report is unaudited and is based on the accounting policies used in the government’s annual financial
statements.(1)

In March 2020, the World Health Organization declared a COVID-19 pandemic. The pandemic and the measures implemented to deal with it are
having significant impacts, in particular on the Québec government’s financial situation. The impacts of COVID-19-related measures for the period
from April 1 to November 30, 2020 are presented in Appendix 3. An update of that information will be available at the end of the fiscal year.

The Monthly Report on Financial Transactions at December 31, 2020 will be published on April 9, 2021.

SUMMARY OF CONSOLIDATED RESULTS
(unaudited data, millions of dollars)
                                                          November                                           April to November
                                                2019           2020        Change         2019-2020      2020-2021      Change        Change (%)
Own-source revenue                              7 949         8 072            123           60 758         56 556        -4 202             -6.9
Federal transfers                               1 969         2 699            730           15 953         18 915         2 962             18.6
Consolidated revenue                            9 918        10 771            853           76 711         75 471        -1 240             -1.6
Portfolio expenditures                         -8 255        -9 440         -1 185          -65 473        -73 656        -8 183             12.5
Debt service                                     -624          -650            -26            -5 109         -4 731          378             -7.4
Consolidated expenditure                       -8 879       -10 090         -1 211          -70 582        -78 387        -7 805             11.1
SURPLUS (DEFICIT)(2)                            1 039            681           -358            6 129         -2 916         -9 045                -
BALANCED BUDGET ACT
Deposits of dedicated revenues in the
Generations Fund                                 -204           -198              6           -1 618         -1 779           -161                -
BUDGETARY BALANCE(3)                              835            483           -352            4 511         -4 695         -9 206                -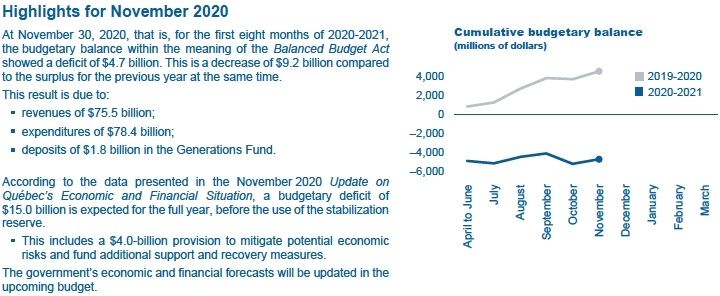
Revenue from government enterprises decreased by $496 million (21.5%) to $1.8 billion. The decrease stems principally from Loto-Québec’s
results, affected by the temporary closing of casinos, gaming halls, and sales outlets. Moreover, Hydro-Québec observed a drop in electricity
consumption in Québec. These decreases are partially offset by an increase in Investissement Québec’s results, mainly as a result of the rise of the
fair value of investments.

OWN-SOURCE REVENUE
(unaudited data, millions of dollars)
                                                          November                                         April to November
                                                2019          2020        Change         2019-2020     2020-2021      Change        Change (%)
Income and property taxes
  Personal income tax                          2 681          2 969            288           21 840        21 574           -266            -1.2
  Contributions for health services              563            528            -35            4 391         3 948           -443           -10.1
  Corporate taxes                                648            711             63            5 153         4 419           -734           -14.2
  School property tax                            125             90            -35            1 044           805           -239           -22.9
Consumption taxes                              1 905          2 056            151           15 490        14 825           -665            -4.3
Tax revenue                                    5 922          6 354            432           47 918        45 571         -2 347            -4.9
Duties and permits                               563            508            -55            2 948         2 783           -165            -5.6
Miscellaneous revenue                            922            819           -103            7 582         6 388         -1 194           -15.7
Other own-source revenue                       1 485          1 327           -158           10 530         9 171         -1 359           -12.9
Total own-source revenue excluding
revenue from government enterprises            7 407          7 681            274           58 448        54 742         -3 706            -6.3
Revenue from government enterprises              542            391           -151            2 310         1 814           -496           -21.5
TOTAL                                          7 949          8 072            123           60 758        56 556         -4 202            -6.9

                                                                         2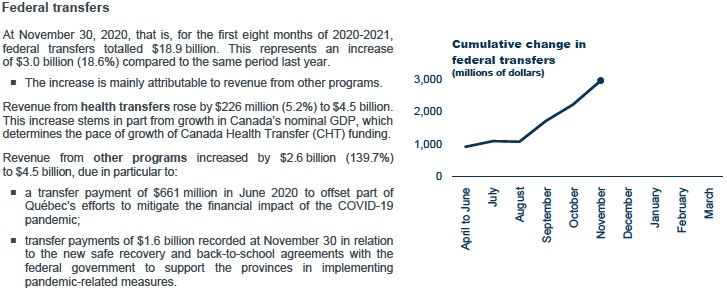
FEDERAL TRANSFERS
(unaudited data, millions of dollars)
November April to November
2019 2020 Change 2019-2020 2020-2021 Change Change (%)
Equalization 1 094 1 104 10 8 750 8 835 85 1.0
Health transfers 540 568 28 4 322 4 548 226 5.2
Transfers for post-secondary education
and other social programs 127 133 6 1 019 1 069 50 4.9
Other programs 208 894 686 1 862 4 463 2 601 139.7
TOTAL 1 969 2 699 730 15 953 18 915 2 962 18.6
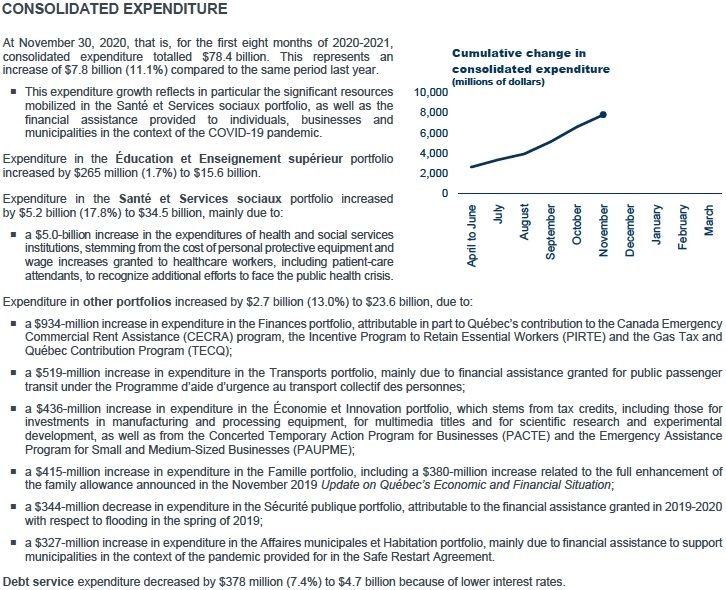
3CONSOLIDATED EXPENDITURES BY PORTFOLIO(4)
(unaudited data, millions of dollars)
November April to November
2019 (5) 2020 Change 2019-2020 (5) 2020-2021 Change Change (%)
Éducation et Enseignement supérieur 2 137 2 263 126 15 308 15 573 265 1.7
Santé et Services sociaux 3 667 4 464 797 29 309 34 522 5 213 17.8
Other portfolios(6) 2 451 2 713 262 20 856 23 561 2 705 13.0
Portfolio expenditures 8 255 9 440 1 185 65 473 73 656 8 183 12.5
Debt service 624 650 26 5 109 4 731 -378 -7.4
TOTAL 8 879 10 090 1 211 70 582 78 387 7 805 11.1
4NET FINANCIAL SURPLUSES OR REQUIREMENTS
Composition of net financial surpluses or requirements
The government’s revenues and expenditures are established on an accrual basis of accounting. Revenues are recognized when earned and expenses
when incurred, regardless of when receipts and disbursements occur.
Financial surpluses (requirements), on the other hand, consist of the difference between receipts and disbursements resulting from government
activities. To meet its net financial requirements, the government uses a variety of financing sources, including cash and borrowings.
The various items for net financial requirements represent net receipts and disbursements generated by the government’s loans, interests in its
enterprises, fixed assets and other investments, as well as by retirement plans and other employee future benefits, and by other accounts. This last
item includes the payment of accounts payable and the collection of accounts receivable.
For the period of April to November 2020, net financial requirements amount to $3.4 billion and are due to:
the $2.9-billion deficit resulting from the difference between government revenues and expenditures;
the $2.4-billion financial requirements for investments, loans and advances, due primarily to an increase in loans, especially those granted
through support measures for businesses affected by the COVID-19 pandemic, and the growth in the consolidation value of government
enterprises;(7)
the $2.4-billion financial requirements for government capital investments, due to investments of $5.2 billion, partially offset by amortization
expenses of $2.8 billion;(7)
the $2.3-billion financial surplus related to retirement plans and other employee future benefits liabilities, resulting from an increase in these
liabilities of $6.5 billion,(7) partially offset by the payment of government employee benefits of $4.3 billion;
the $2.2-billion financial surplus from other accounts,(8) which results in particular from the receipt in September 2020 of an amount from the
federal government for the year 2020-2021 under the Safe Restart Agreement to finance efforts to mitigate the impact of COVID-19 and
support safe economic recovery.
NET FINANCIAL SURPLUSES OR REQUIREMENTS
(unaudited data, millions of dollars)
April to November
2019-2020 2020-2021
SURPLUS (DEFICIT)(2) 6 129 -2 916
Non-budgetary transactions
Investments, loans and advances -2 236 -2 418
Capital investments -2 015 -2 434
Retirement plans and other employee future benefits 2 229 2 255
Other accounts(8) -19 2 162
Total non-budgetary transactions -2 041 -435
NET FINANCIAL SURPLUSES (REQUIREMENTS) 4 088 -3 351
5CHANGE IN THE BUDGETARY BALANCE IN 2020-2021
Results at November 30, 2020 showed a budgetary deficit of $4.7 billion for the first eight months of the year.
According to the data presented in the Update on Québec’s Economic and Financial Situation of November 2020, a budgetary deficit of $15.0
billion is expected for 2020-2021, before the use of the stabilization reserve.
For the last four months of the fiscal year, that is, from December 2020 to March 2021, the budgetary deficit will come from:
results excluding initiatives announced since the beginning of the fiscal year, which will increase the deficit by $1.6 billion;
initiatives announced in the June 2020 snapshot, Québec’s Economic and Financial Situation, of which a balance of $2.0 billion has yet to be
recorded;
initiatives announced in the November 2020 Update on Québec’s Economic and Financial Situation, of which a balance of $2.8 billion has
yet to be recorded.
The government has also set up a provision of $4.0 billion to mitigate potential economic risks and fund additional support and recovery measures.
The use of the stabilization reserve will reduce the budgetary deficit to $3.0 billion.
The government’s economic and financial forecasts will be updated in the upcoming budget.
CHANGE IN THE BUDGETARY BALANCE FOR 2020-2021
(millions of dollars)
2020-2021
BUDGETARY BALANCE(3) - MONTHLY REPORT ON FINANCIAL TRANSACTIONS AT NOVEMBER 30, 2020 -4 695
UPCOMING RESULTS FROM DECEMBER 2020 TO MARCH 2021
Results excluding initiatives
- Consolidated revenue 43 383
- Consolidated expenditure -44 064
- Deposits of dedicated revenues in the Generations Fund -874
Subtotal -1 555
Balance of the initiatives in the June 2020 snapshot to be recorded -1 963
Balance of the initiatives in the November 2020 update to be recorded -2 787
Provision for economic risks and other support and recovery measures -4 000
TOTAL UPCOMING RESULTS -10 305
PROJECTED BUDGETARY BALANCE BEFORE USE OF THE STABILIZATION RESERVE -15 000
Use of the stabilization reserve 12 009
PROJECTED BUDGETARY BALANCE(9) - NOVEMBER 2020 UPDATE -2 991
6APPENDIX 1: BUDGET FORECASTS - CHANGE SINCE THE MARCH 2020 BUDGET
BUDGET FORECASTS FOR 2020-2021
(millions of dollars)
March 2020 November 2020
Budget Adjustments update (10) Change (%) (11)
CONSOLIDATED REVENUE
Income and property taxes
Personal income tax 35 435 -137 35 298 4.4
Contributions for health services 6 896 -515 6 381 -2.1
Corporate taxes 8 530 -863 7 667 -10.9
School property tax 1 349 -192 1 157 -24.8
Consumption taxes 22 961 -2 959 20 002 -6.3
Tax revenue 75 171 -4 666 70 505 -1.8
Duties and permits 4 643 -441 4 202 -7.3
Miscellaneous revenue 10 975 -851 10 124 -7.6
Other own-source revenue 15 618 -1 292 14 326 -7.6
Total own-source revenue excluding revenue from
government enterprises 90 789 -5 958 84 831 -2.9
Revenue from government enterprises 4 814 -1 208 3 606 -18.4
Total own-source revenue 95 603 -7 166 88 437 -3.6
Federal transfers 25 692 4 604 30 296 20.1
Total consolidated revenue 121 295 -2 562 118 733 1.5
CONSOLIDATED EXPENDITURE
Éducation et Enseignement supérieur -25 734 -349 -26 083 6.9
Santé et Services sociaux -47 760 -4 699 -52 459 16.6
Other portfolios(6) -36 806 -4 158 -40 964 13.1
Portfolio expenditures -110 300 -9 207 -119 507 13.1
Debt service -8 266 693 -7 573 -1.3
Total consolidated expenditure -118 566 -8 514 -127 080 12.2
Provision for economic risks and other support and recovery
measures - -4 000 -4 000 -
SURPLUS (DEFICIT)(2) 2 729 -15 076 -12 347 -
BALANCED BUDGET ACT
Deposits of dedicated revenues in the Generations Fund -2 729 76 -2 653 -
BUDGETARY BALANCE BEFORE USE OF THE
STABILIZATION RESERVE - -15 000 -15 000 -
Use of the stabilization reserve - 12 009 12 009 -
BUDGETARY BALANCE(9) - -2 991 -2 991 -
Note: Totals may not add due to rounding.
7APPENDIX 2: EXPENDITURES BY MISSION
Government expenditures are broken down into five public service missions. This breakdown of the government’s expenditures into its main areas of
activity is a stable indicator over time because it is usually not influenced by Cabinet shuffles. Moreover, since this breakdown is also used in the
Public Accounts, its presentation in the Monthly Report on Financial Transactions allows for a better monitoring of actual results over the course of
the year.
The public service missions are:
Health and Social Services, which consists primarily of the activities of the health and social services network and the programs
administered by the Régie de l’assurance maladie du Québec;
Education and Culture, which consists primarily of the activities of the education networks, student financial assistance, programs in the
culture sector and immigration-related programs;
Economy and Environment, which primarily includes programs related to economic development, employment assistance measures,
international relations, the environment and infrastructure support;
Support for Individuals and Families, which includes, in particular, last resort financial assistance, assistance measures for families and
seniors, and certain legal aid measures;
Administration and Justice, which consists mainly of the activities of the legislature, central bodies and public security, as well as
administrative programs.
CONSOLIDATED EXPENDITURES BY MISSION EXCLUDING DEBT SERVICE
(unaudited data, millions of dollars)
November April to November
2019 (5) 2020 2019-2020 (5) 2020-2021
Health and Social Services 3 566 4 354 28 617 33 648
Education and Culture 2 227 2 357 15 851 16 255
Economy and Environment 914 1 215 8 365 9 909
Support for Individuals and Families 864 759 7 255 7 640
Administration and Justice 684 755 5 385 6 204
TOTAL 8 255 9 440 65 473 73 656APPENDIX 3: IMPACTS OF COVID-19 FOR THE PERIOD FROM APRIL 1 TO NOVEMBER 30, 2020
In March 2020, the World Health Organization declared a COVID-19 pandemic. On March 13, 2020, the Québec government declared a health
emergency for the entire province. It then undertook to set up a series of public health measures and offer financial support for individuals,
businesses and communities, to help them deal with the economic consequences of the crisis.
The initiatives for managing the crisis and restarting the economy outlined in the June 2020 snapshot, Québec’s Economic and Financial Situation,
and the November 2020 Update on Québec’s Economic and Financial Situation had significant impacts on the government’s results for the period
from April 1 to November 30, 2020. The expenditures presented in this Appendix are included in the government’s monthly results.
The COVID-19 pandemic also had indirect impacts on the financial results at November 30, stemming mainly from confinement measures such as
the temporary closing of establishments. That had the effect of reducing own-source revenue and certain expenditures, but cannot be calculated
precisely because many factors are involved.
The health and social services sector
The additional expenditures for the health and social services sector stemming from the pandemic are estimated at $5.5 billion for the eight-month
period ending November 30, 2020.
PANDEMIC-RELATED HEALTH AND SOCIAL SERVICES EXPENDITURES
FOR THE PERIOD FROM APRIL 1 TO NOVEMBER 30, 2020(1)
(millions of dollars)
Expenditure categories
Remuneration(2) 2 984.5
Operating(3) 864.2
Transfers(4) 350.0
Personal protective equipment(5) 1 260.2
TOTAL 5 458.9
(1) These are additional pandemic-related expenditures compiled by the health and social services network organizations (see Appendix 3 of the government’s
2019-2020 consolidated financial statements for the complete list) and the Régie de l assurance maladie du Québec for the remuneration category. For the
network organizations, the figures are those as at December 5, adjusted pro rata to November 30, 2020. These expenditures do not include the impact of
cutting non-priority activities, which has a downward effect on forecast health expenditures for 2020-2021.
(2) Remuneration includes salaries for full-time staff and management, including bonuses, overtime, benefits and social security charges. Remuneration for
handling requests for payment by health professionals to the Régie de l’assurance maladie du Québec for specific COVID-19-related billing ($959.5 million)
must be added to the costs incurred by the health and social services network organizations.
(3) Operating expenditures include the other COVID-19-related direct charges such as costs of materials, supplies, transportation and staff training.
(4) Transfer expenditures include amounts paid to seniors’ residences and non-agreement private long-term care facilities, support for community organizations
and emergency hospital services.
(5) This information is based on an estimate of consumption by the Ministère de la Santé et des Services sociaux.
9Initiatives to support Quebecers, lessen the pandemic’s impact on the economy and restart the economy
For the period from April 1 to November 30, 2020 the government incurred expenditures of $2.4 billion to implement the initiatives to support
Quebecers, lessen the pandemic’s impact on the economy and restart the economy outlined in the June 2020 snapshot, Québec’s Economic and
Financial Situation, and the November 2020 Update on Québec’s Economic and Financial Situation.
FINANCIAL IMPACT OF THE INITIATIVES TO SUPPORT QUEBECERS AND OUR ECONOMY
(millions of dollars)
Actual expenditures
April to November 2020 (8 months)
SUPPORTING QUEBECERS
Incentive Program to Retain Essential Workers (PIRTE)* 198.9
Support for childcare services 97.8
Increase student financial assistance and improving student support services 75.0 (1)
Strengthen the support and safety of students and school staff 75.0 (1)
Moratorium on student loan repayments - Harmonization with the Government of Canada measure* 36.4
Recruitment of farm workers 23.5
Other initiatives 50.1
Subtotal 556.7
MITIGATING THE ECONOMIC IMPACT OF THE PANDEMIC
Specific assistance for public transit bodies 613.7
Support for all municipalities 488.9
Commercial rent assistance* 208.9
Concerted Action Program for Job Retention (PACME)* 125.5
Support the cultural sector 50.0 (1)
Measures for culture and the media 32.7
Other initiatives 53.6 (1)
Subtotal 1 573.3
RESTARTING THE ECONOMY
Help get Quebecers back into the labour market 66.2
OTHER IMPACT
Recoverability risk and forgivable portion of loans / loan guarantees 202.9
TOTAL 2 399.1
* These initiatives ended on or before November 30, 2020.
(1) These amounts include in whole or in part expenditures between bodies within the government’s reporting entity that will have an impact on
the government’s budgetary balance when the expenditures are realized with bodies outside the government’s reporting entity.
10Consolidated financial information
Consolidated results include the results of all entities that are part of the government’s reporting entity, i.e. that are under its control. To determine
consolidated results, the government eliminates transactions carried out between entities in the reporting entity. Additional information on the
government’s financial organization and the financing of public services can be found on pages 13 to 18 of the document titled “Budgetary Process
and Documents: Public Financial Accountability” (in French only).
Notes
(1) A summary of the government’s accounting policies can be found on pages 82 to 85 of Volume 1 of the Public Accounts 2019-2020.
(2) Balance as defined in the Public Accounts.
(3) Budgetary balance within the meaning of the Balanced Budget Act.
(4) Consolidated expenditures by mission are presented in Appendix 2.
(5) Certain expenditures were reclassified between portfolios and between missions to take into account the transition to the 2020-2021
budgetary structure.
(6) Other portfolios include inter-portfolio eliminations resulting from the elimination of reciprocal transactions between entities in different
portfolios.
(7) These items, which are included in the government’s budgetary surplus (deficit), are eliminated in non-budgetary transactions because they
have no effect on cash flow.
(8) The financial surpluses or requirements pertaining to other accounts can vary significantly from one month to the next, in particular
according to the time when the government collects or disburses funds related to its activities. For example, when the last day of the month is
not a business day, QST remittances are collected at the beginning of the following month, such that the equivalent of two months’
remittances can be collected in a given month.
(9) Budgetary balance within the meaning of the Balanced Budget Act, after use of the stabilization reserve.
(10) The presentation of the budgetary information in this monthly report is consistent with that of the financial framework as published in the
Update on Québec’s Economic and Financial Situation - Fall 2020.
(11) This is the annual change compared to preliminary results in 2019-2020.
For more information, contact the Direction des communications of the Ministère des
Finances at 418-528-7382.
The report is also available on the Ministère des Finances website: www.finances.gouv.qc.ca.
11You can also read