Q3 2019 Earnings Presentation - Dietmar Siemssen, CEO Dr. Bernd Metzner, CFO Duesseldorf, October 10, 2019 - Gerresheimer
←
→
Page content transcription
If your browser does not render page correctly, please read the page content below

Q3 2019 Earnings Presentation
Dietmar Siemssen, CEO
Dr. Bernd Metzner, CFO
Duesseldorf, October 10, 2019

Disclaimer

    This presentation may contain certain forward-looking statements, including assumptions, opinions and views of the
    Company or cited from third party sources. Various known and unknown risks, uncertainties and other factors could
    cause the actual results, financial position, development or performance of the Company to differ materially from the
    estimations expressed or implied herein.

    The Company does not guarantee that the assumptions underlying such forward-looking statements are free from
    errors nor does the Company accept any responsibility for the future accuracy of the opinions expressed in this
    presentation or the actual occurrence of the forecast development.

    No representation or warranty (express or implied) is made as to, and no reliance should be placed on, any
    information, including projections, estimates, targets and opinions, contained herein, and no liability whatsoever is
    accepted as to any errors, omissions or misstatements contained herein, and, accordingly, none of the Company or
    any of its parent or subsidiary undertakings or any of such person‘s officers, directors or employees accepts any
    liability whatsoever arising directly or indirectly from the use of this document.

    For an overview of abbreviations and definition please see the glossary slide in the backup section

October 2019   Q3 2019 Earnings                                                                                         2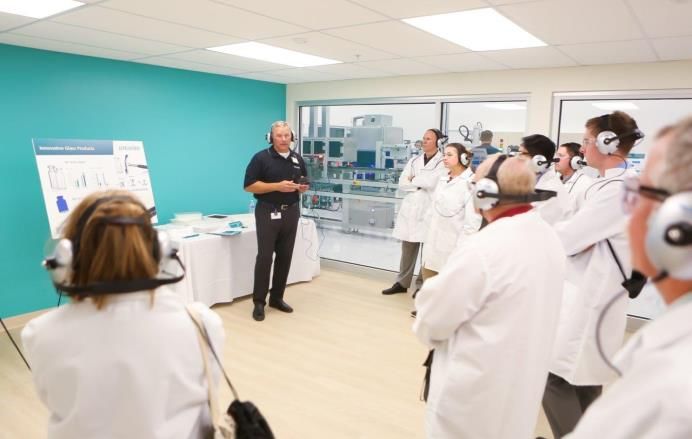
Agenda

      1            Dietmar Siemssen
                   Q3 2019 highlights

      2            Dr. Bernd Metzner
                   Q3 2019 financial review

      3            Dietmar Siemssen
                   Conclusion & outlook

      4            Appendix

October 2019   Q3 2019 Earnings               3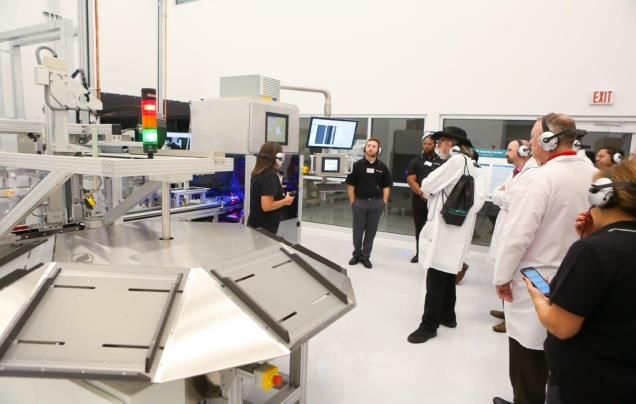
Q3 2019 performance in line with expectations. Year 1 of capex
plan almost completed, underpinning disciplined execution.

                                      Strict monitoring of all business and macro drivers

  Q3 2019 Financials                             Markets & Macro                            Operations

      Revenues and profitability                  Good market environment all in all with    P&D reported revenues up 2.1% YoY
      developments in line with expectations      regional differences
                                                                                               Driven by Primary Plastic Packaging
         Reported revenues up 1.4%                Solid demand in Europe overall               and Syringes
         Adjusted EBITDA at EUR 72.2m             Softer demand in the glass business in     PPG reported revenues down 0.9% YoY
                                                  the USA essentially led by operational
      Adjusted net income performance                                                          Essentially led by softer US demand
                                                  issues at one of our customers’ where
      higher by over 7% YoY                                                                    and strong comparables YoY
                                                  we have a high market share
      Adjusted EBITDA Leverage at 2.4x                                                       Disciplined execution of capex plan
                                                  Currency movements result in slight
                                                  translation tailwinds                        Essen furnace overhaul on plan
                                                  Refinancing of RCF successfully              Plant constructions in Anapolis and
                                                  completed                                    Skopje progressing well
                                                                                               Expansion in Horsovsky Tyn on track
                                                                                               Gx® Glass Innovation & Technology
                                                                                               Center, Vineland/NJ, opened (Sept)

October 2019     Q3 2019 Earnings                                                                                                    4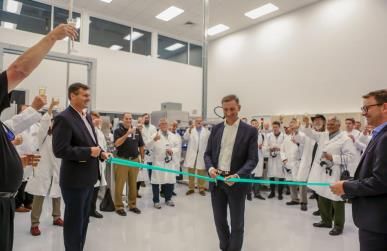
Disciplined execution of capex plan. Full speed ahead on
growth, productivity and innovation.
2019                              2019

                                         Expanding
                                         innovation in glass

October 2019   Q3 2019 Earnings                                5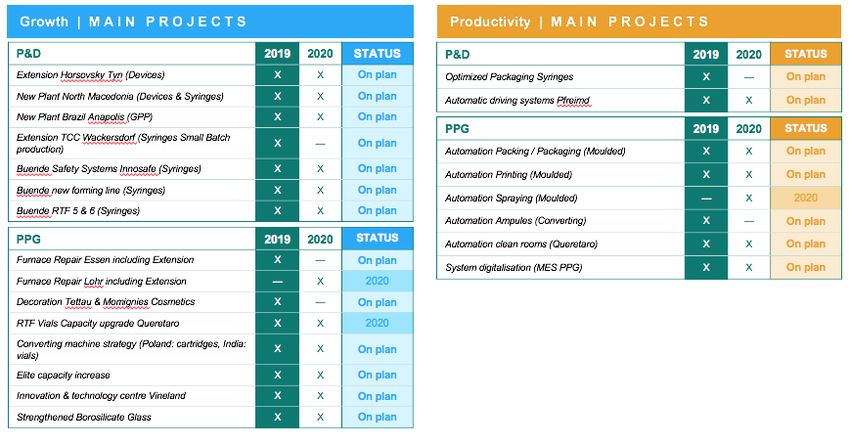
Gx ® Glass Innovation & Technology Center, Vineland/NJ
From component supplier to provider of technology solutions

      Bundling our glass expertise under one roof to
      develop new products and technologies

      In close cooperation with our customers, we are now
      able to develop new products in a very early design
      phase

      Driving innovation in pharmaceutical glass, primary
      packaging glass products, technologies and digitized
      processes

      Grand opening with over 100 customers Sep 25, 2019

October 2019    Q3 2019 Earnings                              6
Sensile: Focus on executing main projects and driving leads &
innovation pipeline
 Projects and Processes

       Executing on current
       projects
       Driving industrialization
       processes

Leads and Innovation Pipeline

                 Large base of prospects                       New treatment methods                  Diverse therapeutic areas
                                                                                                                     Diabetes
                                   Large Pharma                              Avoiding hospital
                                                                             stays                                   Oncology
                                   Generics
                                                                             Alternative to                          Parkinson
                                   Specialized Pharma
                                   Biotech / Biosimilars
                                                           +                 infusions or other
                                                                             injectables
                                                                                                  +                  Pain therapies
                                                                                                                     Narcolepsy
                                   …/….
                                                                             Patient comfort                         Pregnancy induced
                                                                             …/….                                    high blood pressure
                                                                                                                     …/….

October 2019    Q3 2019 Earnings                                                                                                           7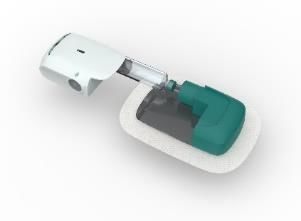
Agenda

      1            Dietmar Siemssen
                   Q3 2019 highlights

      2            Dr. Bernd Metzner
                   Q3 2019 financial review

      3            Dietmar Siemssen
                   Conclusion & outlook

      4            Appendix

October 2019   Q3 2019 Earnings               8
Q3 2019 performance in line with expectation
CHANGE
EUR M Q3 2019 Q3 2018 ANALYSIS
in %
FXN Revenues as per guidance1) 355.2 351.7 1.0% Driven by P&D , Glass Europe & EM
Revenues 358.6 353.7 1.4% Slight fx tailwind
FXN Adjusted EBITDA as per guidance 2) 71.1 69.8 1.6% Development in line with sales growth
Adjusted EBITDA 72.2 73.7 -2.3%
Total one-off items -1.1 -5.8 -80.1%
Including FVA with regard to the acquisition of Sensile
Depreciation & Amortization3) -37.3 -34.6 7.0%
Medical in July 2018
Net finance expense -7.0 -6.9 0.7%
Income taxes -7.8 -7.4 5.0%
Net income 19.0 19.0 0.5%
Total one-off items (including amortization and tax effects) 11.7 13.5 -13.6%
Adjusted net income 30.7 32.5 -5.4%
Adjusted net income performance4) 30.7 28.6 7.5% Continuing to deliver improvement YoY
1. FXN: See page 105 of annual report FY 2018 for currency assumptions regarding FY 2019. For Q3 2018: excluding EUR 3.7m revenues from the loss of the inhaler customer at our plant in Küssnacht.
2. FXN: See page 105 of annual report FY 2018 for currency assumptions regarding FY 2019. For Q3 2018: excluding a EUR 5.6m positive one-off effect linked to the loss of the inhaler customer at our plant
in Küssnacht and a EUR 1.4m negative one-off effect relating to the network charges.
3. Including EUR 14.0m (Q3 2018: EUR 11.5m) amortization of fair value adjustments.
4. For Q3 2018: excluding a EUR 4.9m positive one-off effect linked to the loss of the inhaler customer at our plant in Küssnacht and a EUR 1.0m negative one-off effect relating to network charges.
October 2019 Q3 2019 Earnings 9Q3 marked by sustained dynamic in Primary Plastic Packaging
and Syringes but lower demand from one US Glass customer
P&D PPG GAT
Adj. Adj.
FXN1),2) FXN1)
2.8% EBITDA 23.6% -2.6% EBITDA 18.9%
Growth Growth
margin3) margin3)
REPORTED EUR M REPORTED EUR M REPORTED EUR M 1.8
193.7 50.8
45.7 30.2 30.1 6.3
Q3 160.7 Q3
159.2 Q3
189.7 2018 2018 2018
3.5
Q3 Q3 Q3
2019 2019 2019
(2.0)
Revenues Adj. EBITDA Revenues Adj. EBITDA Revenues Adj. EBITDA
— Overall plastic packaging business stable YoY — Trends from Q2 2019 continued into Q3 2019
— Syringes up — Growth in Europe
— Revenues for Sensile Medical in line with expectations
— Medical Plastics Systems overall stable YoY — Good quarter in Emerging Markets
— Almost exclusively development revenues
— Tooling up (timing effects) — US business impacted by operational issues at
one of our customers’ where we have a high
— Q3 2018 Contract Manufacturing positively impacted
market share
by Adj. EBITDA of 5.6 million linked to loss of the
Inhaler customer in Küssnacht — Revenues mix temporarily weighs on margins
— Furnace overhaul in Essen spread over Q3 and Q4
— Externalisation to third parties in Decoration continue to
impact margins in Q3 2019
1. FXN: See page 105 of annual report FY 2018 for currency assumptions regarding FY 2019.
2. For Q3 2018: excluding EUR 3.7m from the loss of the inhaler customer at our plant in Küssnacht.
3. Reported.
October 2019 Q3 2019 Earnings 10FCF generation mostly driven by implementation of capex plan
in Q3 2019 and temporary change in working capital
EUR M Q3 2019 Q3 2018 CHANGE
Adjusted EBITDA 72.2 73.7 -1.5 .
Implementation of capex program for
Change in net working capital -12.4 6.3 -18.7 2019 & 2020 drives higher capex
spend YoY
Capital expenditure -43.6 -19.4 -24.2
Operating cash flow 16.2 60.6 -44.4 Change in net working capital driven
by phasing effects in inventories and
temporary build up of receivables at
Net interest paid -2.4 -2.0 -0.4 Sensile Medical due to nature of
project business – rebound in Q4
Net taxes paid - 8.2 -7.8 -0.4 expected
Pension benefits paid -3.2 -2.7 -0.5
Other -5.2 -5.5 0.3
Free cash flow before acquisitions / divestments -2.8 42.6 -45.4
October 2019 Q3 2019 Earnings 11Net Financial Debt increase led by dividend and milestone
payments; RCF refinancing closed with improved conditions
NET FINANCIAL DEBT AND ADJ. EBITDA LEVERAGE
FCF before Milestone
Net Financial Debt Other (incl. FX acquisitions and payment Sensile Net Financial Debt
May 31, 2019 effect) divestments Dividends (Ever) August 31, 2019 Dividend payment (EUR 36.1m) and Milestone
-800 payment (EUR 18.7m) linked to the Sensile
acquisition drive increase in Net Financial Debt in
-850
Q3 2019
-900 RCF refinancing closed: New EUR 550.0m RCF
agreement with 5 Year Maturity successfully
-950 (2.5)
(940.3) (2.8) negotiated with lower interest margins and
-1000 (36.1) improved documentation
(18.7) (1,000.4)
Net Financial Debt Summary
IN EUR M Aug 31, 2019 Aug 31, 2018 EXPIRY DATE MAIN FACILITIES
Drawn portion of RCF 368.5 291.0
600 550.0 RCF (new)
Promissory loans (2017) 250.0 250.0 Promissory loans
Promissory loans (2015) 425.0 425.0 400 305.5
Local borrowings and leasing / 189.5
37.6 26.7 200 109.0
installment purchases
25.5 45.5
Cash and cash equivalents (80.7) (86.9)
0
Net Financial Debt 1,000.4 905.8
Adjusted EBITDA Leverage 2.4x 3.2x
October 2019 Q3 2019 Earnings 12Agenda
1 Dietmar Siemssen
Q3 2019 highlights
2 Dr. Bernd Metzner
Q3 2019 financial review
3 Dietmar Siemssen
Conclusion & outlook
4 Appendix
October 2019 Q3 2019 Earnings 13FY 2019 guidance confirmed, FY 2020-2022 indications
unchanged. Focus on execution
At Group
level &
METRICS EXPECTED FY 2019 (FXN1)
FXN1
Revenues ~ EUR 1.40bn to EUR 1.45bn
~ EUR 295m (plus/minus EUR 5m)
Adjusted EBITDA Excluding EUR 118.5m from derecognition of contingent purchase price
components
Capex (% FXN sales) ~ 12%
FY 2020
EXPECTED ADJUSTED — 2022
EXPECTED TOP LINE EXPECTED CAPEX
GROWTH EBITDA MARGIN REQUIREMENTS
DEVELOPMENT
4% to 7% FXN1 revenue growth Temporary increase of capex
per annum for the financial years ~ 21% in FY 2020 to revenues in 2019 and 2020
2020 – 2022 based on ~ 23% for the financial years up to 12%
▪ Market volume growth 2021 – 2022 Thereafter back to 8% of
▪ Gx market outperformance revenues
▪ Growth projects
▪ Sensile Medical
1. See page 105 of annual report FY 2018 for currency assumptions regarding FY 2019.
October 2019 Q3 2019 Earnings 14Agenda
1 Dietmar Siemssen
Q3 2019 highlights
2 Dr. Bernd Metzner
Q3 2019 financial review
3 Dietmar Siemssen
Conclusion & outlook
4 Appendix
October 2019 Q3 2019 Earnings 15Q3 marked by sustained dynamic in Primary Plastic Packaging
and Syringes but lower demand from one US Glass customer
EUR m FXN1 growth YoY: +1.0%
FXN1
1.7 355.4 5.3 2.8 355.2
353.7 351.7
350 (0.4)
(3.7) (4.2)
325
300
Q3 2018 Currency Q3 2018 @ Impact 2018 Q3 2018 FXN Δ P&D Δ PPG Δ GAT Δ Internal Sales Q3 2019
reported impact 2019 budget loss of the Guidance Base FXN
rate (FXN) inhaler
customer (P&D)
FXN P&D Q3 2019 performance review
FXN PPG Q3 2019 performance review FXN GAT Q3 2019 performance review
+ 2.8% (excl. 2018 impact loss inhalation)
-2.6% EUR + 2.8m
+0.8% (including impact)
— Overall plastic packaging business stable YoY — Trends from Q2 2019 continued into Q3 2019 — Revenues for Sensile Medical in line with
— Syringes up expectations
— Growth in Europe
— Almost exclusively development revenues
— Medical Plastics Systems overall stable YoY — Good quarter in Emerging Markets
— Tooling up (timing effects) — US business impacted by operational issues at
one of our customers’ where we have a high
market share
1. See page 105 of annual report FY 2018 for currency assumptions regarding FY 2019.
October 2019 Q3 2019 Earnings 16FXN Adjusted EBITDA development in line with sales growth
EUR m FXN1 growth YoY: +0.8%
FXN1
73.7 0.3 74.0 71.1
1.4 69.8 3.8
(5.6) (0.3) (2.1) (0.1)
Q3 2018 Currency Q3 2018 Impact 2018 Impact 2018 Q3 2018 FXN Δ P&D Δ PPG Δ GAT Δ HQ Q3 2019 FXN
adjusted impact adjusted Loss of the Network base for 2019 adjusted
EBITDA EBITDA @ Inhaler Charges (PPG) guidance EBITDA
reported 2019 budget customer
rate (FXN) (P&D)
P&D Q3 2019 performance review PPG Q3 2019 performance review
GAT Q3 2019 performance review
EUR -0.3mYoY (excl. 2018 impact EUR - 2.1m YoY (excl. 2018 impact network
EUR +3.8m
inhalation) or EUR -5.9m including impact charges) or EUR -0.7m including impact
— Contract Manufacturing impacted by the loss of the — Revenues mix temporarily weighs on margins — Adj. EBITDA development in line with expectations
inhaler customer in 2018 — Higher demand in Decoration led to given the nature of revenues
capacity constraints and externalization to
— Other businesses delivering in line with expectations third parties with lower margins
— US business impacted by operational issues at one
of our customers’ where we have a high market
share
— Furnace overhaul Essen spread over Q3 and Q4
1. See page 105 of annual report FY 2018 for currency assumptions regarding FY 2019.
October 2019 Q3 2019 Earnings 17GXI Key Data
in EUR per share 2008 2009 2010 2011 2012 2013 2014 2015 2016 2017 2018
Dividend 0.40 – 0.50 0.60 0.65 0.70 0.75 0.85 1.05 1.10 1.15
Dividend yield 1.5% – 1.8% 1.9% 1.7% 1.4% 1.7% 1.2% 1.5% 1.6% 1.8%
Payout ratio 22% – 26% 25% 25%1 23% 26% 25% 25% 27% 20%
Share price high 38.20 27.05 29.85 36.62 41.34 50.14 56.42 76.32 76.86 78.01 79.80
Share price low 23.99 13.24 22.09 28.30 31.00 37.60 42.31 41.99 57.10 61.03 59.75
Share price at FY end 27.10 23.05 28.20 31.17 39.41 49.67 44.44 73.90 68.85 67.06 62.90
Book value per share 15.26 15.29 16.86 17.59 17.14 17.94 19.25 22.23 24.31 25.14 28.35
P/E ratio2 14.81 17.20 14.46 12.77 15.041 16.13 15.38 21.67 16.31 16.51 11.09
Market cap in EUR m 851 724 886 979 1,238 1,560 1,395 2,320 2,162 2,106 1,975
MDAX weighting year
11.48%3 1.33% 1.24% 1.40% 1.47% 1.33% 1.01% 1.42% 1.33% 1.00% 0.87%
end
Number of shares in
31.4 31.4 31.4 31.4 31.4 31.4 31.4 31.4 31.4 31.4 31.4
million
1. Retrospective restatement due to the early adoption of IAS 19 (amended in 2011) from December 1, 2012.
2. Based on adj. EPS after non-controlling interests.
3. SDAX weighting at year end.
October 2019 Q3 2019 Earnings 18Financial calendar and contact details FINANCIAL CALENDAR February 19, 2020 FY 2019 Earnings April 9, 2020 Interim Report 1st Quarter 2020 April 29, 2020 Annual General Meeting 2020 July 14, 2020 Interim Report 2nd Quarter 2020 October 13, 2020 Interim Report 3rd Quarter 2020 CONTACT DETAILS Name Corporate Investor Relations Phone +49 211 6181 257 Fax +49 211 6181 121 E-mail Gerresheimer.ir@gerresheimer.com IR website www.gerresheimer.com/ir October 2019 Q3 2019 Earnings 19
Overview of Abbreviations and Definitions

ABBREVIATIONS AND DEFINITIONS

Adj. EBITDA             Net income before income taxes, net finance expense, amortization of fair value adjustments, depreciation and amortization, impairment losses,
                        restructuring expenses and one-off income and expenses
Adjusted EPS            Adjusted earnings per share after non-controlling interests, divided by 31.4m shares
Adjusted net income Net income before non-cash amortization of fair value adjustments, non-recurring effects of restructuring expenses, portfolio adjustments, the balance of
                    one-off income and expenses – including significant non-cash expenses – and the related tax effects
CAGR                Compound Annual Growth Rate
Capex                   Investments in tangible and intangible assets
EBIT                    Earnings before interest and taxes
EBITA                   Earnings before interest, taxes and amortization
EBITDA                  Earnings before interest, taxes, depreciation and amortization
FXN                     "Foreign currency neutral" - based on budgeted FX-rates
Gx ROCE                 Adjusted EBITA divided by capital employed (total assets minus investments, investments accounted for using the equity method and other loans, minus
                        cash and cash equivalents, minus pensions (without pension provisions), deferred tax liabilities, and income tax liabilities, minus prepayments received,
                        trade payables, and other non- interest bearing liabilities)
Gx RONOA             The ratio of adjusted EBITA to average net operating assets, comprising the sum of property, plant and equipment and net working capital
Adj. EBITDA Leverage The relation of net financial debt to adjusted EBITDA of the last twelve months, according to the credit facility agreement currently in place
Net financial debt   Short and long term debt minus cash and cash equivalents
Net finance expense     Interest income and expenses related to the net financial debt of the Gerresheimer Group. It also includes net interest expenses for pension provisions
                        together with exchange rate effects from financing activities and from related derivative hedges.
Net working capial
(NWC)                   Inventories plus trade receivables minus trade payables plus/minus prepayments

Op. CF margin           Adjusted EBITDA plus/minus the change in net working capital, minus capex and in relation to revenues
Operating cash flow     Adjusted EBITDA plus/minus change in net working capital, minus capex
P/E Ratio               Company's share price divided by the adj. EPS
RCF                     Revolving credit facility
yoy                     year-on-year

October 2019         Q3 2019 Earnings                                                                                                                                               20
Our Vision Gerresheimer will become the leading global partner for enabling solutions that improve health and well-being. Our success is driven by the passion of our people.
You can also read