Q1 2019 Earnings Presentation - Dietmar Siemssen, CEO Rainer Beaujean, CFO Duesseldorf, April 11, 2019 - Gerresheimer

Page created by Michele Garza
 
CONTINUE READING
Q1 2019 Earnings Presentation - Dietmar Siemssen, CEO Rainer Beaujean, CFO Duesseldorf, April 11, 2019 - Gerresheimer
Q1 2019 Earnings Presentation
Dietmar Siemssen, CEO
Rainer Beaujean, CFO
Duesseldorf, April 11, 2019
Q1 2019 Earnings Presentation - Dietmar Siemssen, CEO Rainer Beaujean, CFO Duesseldorf, April 11, 2019 - Gerresheimer
Disclaimer

    This presentation may contain certain forward-looking statements, including assumptions, opinions and views of the
    Company or cited from third party sources. Various known and unknown risks, uncertainties and other factors could
    cause the actual results, financial position, development or performance of the Company to differ materially from the
    estimations expressed or implied herein.

    The Company does not guarantee that the assumptions underlying such forward-looking statements are free from
    errors nor does the Company accept any responsibility for the future accuracy of the opinions expressed in this
    presentation or the actual occurrence of the forecast development.

    No representation or warranty (express or implied) is made as to, and no reliance should be placed on, any
    information, including projections, estimates, targets and opinions, contained herein, and no liability whatsoever is
    accepted as to any errors, omissions or misstatements contained herein, and, accordingly, none of the Company or
    any of its parent or subsidiary undertakings or any of such person‘s officers, directors or employees accepts any
    liability whatsoever arising directly or indirectly from the use of this document.

    For an overview of abbreviations and definition please see the glossary slide in the backup section

11/04/2019    Q1 2019 Earnings                                                                                          2
Q1 2019 Earnings Presentation - Dietmar Siemssen, CEO Rainer Beaujean, CFO Duesseldorf, April 11, 2019 - Gerresheimer
Agenda

      1          Dietmar Siemssen
                 Q1 2019 highlights

      2          Rainer Beaujean
                 Q1 2019 financial review

      3          Dietmar Siemssen
                 Conclusion & outlook

      4          Appendix

11/04/2019   Q1 2019 Earnings               3
Q1 2019 Earnings Presentation - Dietmar Siemssen, CEO Rainer Beaujean, CFO Duesseldorf, April 11, 2019 - Gerresheimer
A good start into the year

                                    Strict monitoring of all business and macro drivers

  Q1 2019 Financials                            Markets & Macro                         Operations

      Revenues and profitability                 Currency movements result in slight     Strong performance of PPG across all
      developments in line with expectations     translation tailwinds                   businesses
         Reported revenues up 6.3%               Over 65% of 2019 energy volume fixed    Encouraging revenue growth in
                                                 for the current year                    Syringes as well as in Plastic
         Adjusted EBITDA at EUR 145.9m
                                                                                         Packaging
         (EUR 53.6m + EUR 92.3m)
                                                                                         US prescription business and Inhalation
      Adjusted EBITDA Leverage at 2.4x
                                                                                         lower year-on-year (strong flu season in
      Confirming 2019 guidance and outlook                                               Q1 2018 and inhalation contract loss
      for 2020-2022                                                                      set higher comparison base in 2018)
                                                                                         Performance of Advanced
                                                                                         Technologies in line with expectations
                                                                                         Systematic execution of capex plan

11/04/2019       Q1 2019 Earnings                                                                                                   4
Q1 2019 Earnings Presentation - Dietmar Siemssen, CEO Rainer Beaujean, CFO Duesseldorf, April 11, 2019 - Gerresheimer
Systematic execution of Capex plan

  Growth | M A I N P R O J E C T S                                     Productivity | M A I N P R O J E C T S

   P&D                                         2019   2020   STATUS    P&D                                        2019   2020   STATUS

   Extension Horsovsky Tyn (Devices)            X      X     On plan   Optimized Packaging Syringes                X      —     On plan

   New Plant North Macedonia (Devices &                                Automatic driving systems Pfreimd           X      X     On plan
                                                X      X     On plan
   Syringes)
   New Plant Brazil Anapolis (GPP)              X      X     On plan

   Extension TCC Wackersdorf (Syringes                                 PPG                                        2019   2020   STATUS
                                                X      —     On plan
   Small Batch production)
                                                                       Automation Packing / Packaging (Moulded)    X      X     On plan
   Buende Safety Systems Innosafe (Syringes)    X      X     On plan
                                                                       Automation Printing (Moulded)               X      X     On plan
   Buende new forming line (Syringes)           X      X     On plan
                                                                       Automation Spraying (Moulded)               —      X      2020
   Buende RTF 5 & 6 (Syringes)                  X      X     On plan
                                                                       Automation Ampules (Converting)             X      —     On plan

                                                                       Automation clean rooms (Queretaro)          X      X     On plan
   PPG                                         2019   2020   STATUS
                                                                       System digitalisation (MES PPG)             X      X     On plan
   Furnace Repair Essen including Extension     X      —     On plan

   Furnace Repair Lohr including Extension      —      X      2020

   Decoration Tettau Cosmetics                  X      —     On plan

   Queretaro ETF line #2                        —      X      2020

   Converting machine strategy (Poland:
                                                X      X     On plan
   cartridges, India: vials)

11/04/2019        Q1 2019 Earnings                                                                                                        5
Q1 2019 Earnings Presentation - Dietmar Siemssen, CEO Rainer Beaujean, CFO Duesseldorf, April 11, 2019 - Gerresheimer
Systematic execution of Capex plan :
New plant for medical plastic systems & syringes in Skopje
    Skopje, capital of Republic of North Macedonia:
        good infrastructure
        good cost structure
        trained personnel
        support from authorities
    Invest of mid double digit million Euro, up to 400 employees mid-term
    Capacities for medical plastic systems and prefilled syringes
    Start of construction Q2/2019, start of MPS production H2/2020

11/04/2019      Q1 2019 Earnings                                            6
Q1 2019 Earnings Presentation - Dietmar Siemssen, CEO Rainer Beaujean, CFO Duesseldorf, April 11, 2019 - Gerresheimer
Adding new technologies in the electronic & “connected” space
to scale up our product competencies

                                                                           A D VA N C E D T E C H N O L O G I E S
     Flow measurement
     Data gathering
     Data management
                                                                                                     Electronics     +    ... /…

                                                                     Sensile Medical
                                                                                               +     Connectivity
                                                                                                     respimetrix
     Biosimilar/
     Biotech Companies                                        +        OEM /     ODM2

     Other therapeutic                                                    business
     areas
     Precision injections
                                        PLASTICS & DEVICES

     Large Pharma &                             Gerresheimer
     Generics                            Medical Plastic Systems
     Chronic Diseases
                                               CMO / CDMO1
                                                  Business

                              Today                                       +                                   ~ 5 Years       ~ 10 Years
1. CMO / CDMO: Contract Manufacturer Organization, Contract Development Manufacturer Organization.
2. OEM / ODM: Original Equipment Manufacturer / Original Design Manufacturer.

11/04/2019         Q1 2019 Earnings                                                                                                        7
Q1 2019 Earnings Presentation - Dietmar Siemssen, CEO Rainer Beaujean, CFO Duesseldorf, April 11, 2019 - Gerresheimer
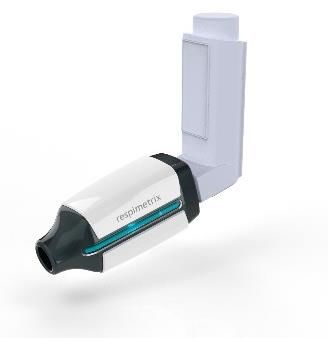
Assessment of inhalation – respimetrix
Enhancing Advanced Technologies Division
    Patented flow sensor to accurately assess every single inhalation
    Connects to inhalers or can be integrated in inhalers to monitor drug delivery, efficacy, changes in respiratory status
    Provides respiratory information for patients, physicians, disease management companies, pharmaceutical industry
    Development of protoypes and clinical studies intended for the mid term
    Early stage project

             Robust, high-dynamic measure of                                        Proprietary algorithms analyze the
              breathing airflow, recording 100       Patient-centric app             dynamic flow data and interpret
                 airflow values per second.                                             them in a clinical context.

11/04/2019          Q1 2019 Earnings                                                                                      8
Agenda

      1          Dietmar Siemssen
                 Q1 2019 highlights

      2          Rainer Beaujean
                 Q1 2019 financial review

      3          Dietmar Siemssen
                 Conclusion & outlook

      4          Appendix

11/04/2019   Q1 2019 Earnings               9
Q1 2019 FXN Revenues growth up 6.3%

EUR m                                                                                       FXN1 growth YoY: +6.3%
FXN1                                                                                        Excluding inhalation impact

                                                                                                                       6.8            6.6                               307.4
                                 1.8                                                                 5.6
  300         290.4                               292.2
                                                                                  289.1                                                                  (0.7)

  275                                                            (3.1)
  250

  225

  200
             Q1 2018           Currency        Q1 2018 @       Impact 2018 Q1 2018 FXN              Δ P&D              Δ PPG        Δ GAT        Δ Internal Sales      Q1 2019
             reported           impact        2019 budget     lost inhalation Guidance Base                                                                             FXN
                                               rate (FXN)     contract (P&D)

           FXN P&D Q1 2019 performance review
                                                                         FXN PPG Q1 2019 performance review                      FXN GAT Q1 2019 performance review
         + 3.6% (excl. 2018 impact loss inhalation)
                                                                                      + 5.0%                                                EUR 6.6m
                 +1.6% (including impact)

         — Good take up in Syringes                                  — US injectable business with strong growth YoY           — Revenues for Sensile Medical in line with
         — Satisfying quarter for Plastic Packaging                                                                              expectations
                                                                     — Strong growth in Cosmetics
                                                                                                                               — Almost exclusively development revenues
         — US prescription business temporarily down due to          — European pharma glass up YoY
           tough comparables in Q1 2018 (flu season)
                                                                     — Good quarter in Emerging Markets
         — Contract Manufacturing impacted by loss of
           inhalation contract in 2018
         — Tooling higher YoY

1. See page 105 of annual report FY 2018 for currency assumptions regarding FY 2019.

11/04/2019              Q1 2019 Earnings                                                                                                                                         10
Q1 FXN Adj. EBITDA at EUR 145.5m including EUR 92.3m of
derecognition of liabilities
EUR m
FXN1
                                                                                                                                                                90.8            145.5

                                                                                                                                                             Including
                                                                                                                                                             OOI
                                                                                                                                                             Derecogntion
         52.6              0.8            53.4                                             52.3                                 4.6             1.0          of liabilities
                                                                            -
                                                            (1.1)                                          (3.2)
       Q1 2018          Currency          Q1 2018   Impact 2018       Impact 2018 Q1 2018 FXN              Δ P&D               Δ PPG           Δ GAT            Δ HQ          Q1 2019 FXN
       adjusted          impact           adjusted Loss Inhalation      Network    base for 2019
        EBITDA                           EBITDA @ contract (P&D)     Charges (PPG)   guidance
       reported                         2019 budget                  & Triveni put
                                         rate (FXN)                  option (P&D)

             P&D Q1 2019 performance review
                                                                          PPG Q1 2019 performance review                                   GAT Q1 2019 performance review
          EUR -3.2m YoY (excl. 2018 impact loss
                                                                                 EUR 4.6m YoY                                                        EUR 1.0m
        inhalation) or EUR -4.3m including impact

         — Lower revenues contribution from US prescription          — Higher contribution across all PPG business units as           — Adj. EBITDA development in line with expectations
           business impacts Q1 2019 profitability YoY (timing)         a result of higher revenue growth, operating leverage            given the nature of revenues
         — Contract Manufacturing impacted by loss of                  and capacity utilization
           inhalation contract in 2018
         — Other business units delivering in line with
           expectations

1. See page 105 of annual report FY 2018 for currency assumptions regarding FY 2019.

11/04/2019           Q1 2019 Earnings                                                                                                                                                       11
Reported revenues up 6.3% in Q1 2019, adjusted EBITDA at EUR
145.9m. Small currency tailwinds
Group Q1 2019 review
  EUR M                                             Q1 2019                   Q1 2018                Change in %

  Revenues                                           308.5                     290.4                    +6.3%

  - of which FX effect                                1.1                      -1.8

  Adj. EBITDA                                        145.9                     52.6                    +177.2%

  - of which FX effect                                0.4                      -0.8

  - Adj. EBITDA margin %                            47.3%                      18.1%                     N.A.

P&D Q1 2019 review                                    PPG Q1 2019 review                            GAT Q1 2019 review
                          Q1       Q1     Change                        Q1         Q1     Change                     Q1     Q1    Change
  EUR M                                                EUR M                                        EUR M
                         2019     2018     in %                        2019       2018     in %                     2019   2018    in %

  Revenues               160.7    157.3    2.2%        Revenues        141.9      133.1   +6.6%     Revenues        6.6     -      N.A.

  Adj. EBITDA            34.2     37.6    -9.2%        Adj. EBITDA     25.2       20.31   +23.9%    Adj. EBITDA     1.0     -      N.A.

  - Adj. EBITDA                                        - Adj. EBITDA                                - Adj. EBITDA
                         21.3     23.9    -260bps                      17.8       15.3    +250bps                   15.5    -      N.A.
  margin %                                             margin %                                     margin %

11/04/2019         Q1 2019 Earnings                                                                                                        12
Adjusted net income after non-controlling interests EUR 51.1m
higher than 2018
EUR m                                                                                    2.4
                          93.3(1)                           4.5                                    thereof
                                                                                                   Impact US tax
                                                                                                   reform Q1
                                          0.0                             (6.1)                    2018 (43.6m)      99.3                                       109.2
                         thereof
                         FX-effects
                         -0.4m                                                                       (44.0)                        10.3           (0.4)
             49.2                                                                                                                                                              58.1

         Net income      Delta Adj.      Delta           Delta Total      Delta        Delta Net   Delta Income    Net income   Total one-off Adjusted NI     Adjusted NI    Adjusted NI
          Q1 2018         EBITDA      Depreciation      one-off items   Amortization    finance        taxes        Q1 2019      items (incl. attributable to after non-      after non-
                                                                           FVA         expense                                  Amortization non-controlling controlling     controlling
                                                                                                                                    FVA)         interests    interests in   interests in
                                                                                                                                                                Q1 2019        Q1 2018

                                                                                                                    Change in Adjusted net income after
                               Change in net income Q1 2019 YoY
                                                                                                                   non-controlling interests Q1 2019 YoY
                                         EUR +50.1m
                                                                                                                                EUR +51.1m

              — Higher Adj. EBITDA due to derecognition of contingent purchase                     — Adjusted net income after non-controlling interests is EUR 51.1m
                price liabilities Sensile Medical EUR 92.3m                                          higher as in Q1 2018
              — Limited one-off items in Q1 2019. Q1 2018 one-off items mostly                     — Adjusted EPS after non-controlling interests at EUR 3.48 in Q1
                relating to severances costs for board members                                       2019 versus EUR 1.85 in Q1 2018
              — Increase in amortization of fair value adjustments as a result of
                acquisition of Sensile Medical
              — Lower interest expenses due to redemption of bond in May 2018
              — Higher income taxes variation, mainly due to US tax reform in 2018
                (EUR 43.6m positive one off in Q1 2018)

1. Incl. EUR 92.3m from derecognition of liabilities.

11/04/2019            Q1 2019 Earnings                                                                                                                                                      13
Net Financial Debt increase led by a further payment related to
Sensile Medical acquisition and temporarily higher NWC
EUR m
                              Operating CF                                                                                 FCF     Acquisition
                                  Adj. EBITDA                                                   Other cash out
                                excluding effect                    Net                          (incl. Interest,                  Purchase
             Net Financial Debt from derecogn.     Derecogn.       Working          Capital     Taxes, Pension,     Derecogn.      price pay.      FX-     Net financial Debt
                 Nov 2018          Liabilities     Liabilities     Capital        Expenditure          etc.)        Liabilities        SM        effetcs        Q1 2019

                                                                                        Non cash

                                                      92            (49)            (17)             (17)
                  (886)               54                                                                             (92)           (25)           1            (939)

                                       EUR +80m                                    EUR -29m

                                           Operating and Free Cash Flow                                                           Acquisitions

                         — Derecognition of liabilities in relation with the Sensile Medical           — EUR 25m paid in December in conjunction with the Sensile
                           acquisition is a non-cash item                                                Medical acquisition
                         — Higher net working capital consumption in Q1 2019 mainly
                           driven by increase in inventory
                         — Other mainly includes cash outflow related to Pensions,
                           Taxes and Interest payments

11/04/2019              Q1 2019 Earnings                                                                                                                                        14
Adjusted EBITDA Leverage temporarily at 2.4x. Capital structure
remains solid

         NET FINANCIAL DEBT AND ADJ. EBITDA LEVERAGE

              Net Financial Debt            886.4             939.1

              Adj. EBITDA leverage (x)
                                                                               EXPIRY DATE MAIN FACILITIES
                                             3.1x
                                                               2.4x            500      450.0                                     RCF
                                                                               450                                                Promissory loans
                                                                               400
                                                                               350                        305.5
                                         Nov 30, 2018      Feb 28, 2019        300
                                                                               250            189.5
                                                                               200
                                                                               150                                      109.0
      Net Financial Debt Summary                                               100                                                             45.5
                                                                                50                                              25.5
       IN EUR M                               Nov 30, 2018      Feb 28, 2019     0
                                                                                      FY     FY     FY     FY     FY     FY     FY      FY     FY
       Drawn portion of RCF                      264.4                318.5          2019   2020   2021   2022   2023   2024   2025    2026   2027

       Promissory loans (2017)                   250.0                250.0

       Promissory loans (2015)                   425.0                425.0

       Local borrowings and leasing                 27.6              30.5

       Cash and cash equivalents                 (80.6)               (84.9)

       Net Financial Debt                        886.4                939.1

11/04/2019        Q1 2019 Earnings                                                                                                                    15
Agenda

      1          Dietmar Siemssen
                 Q1 2019 highlights

      2          Rainer Beaujean
                 Q1 2019 financial review

      3          Dietmar Siemssen
                 Conclusion & outlook

      4          Appendix

11/04/2019   Q1 2019 Earnings               16
FY 2019 guidance updated, FY 2020-2022 indications unchanged.
Focus on execution
                                                  At Group level & FXN1
   METRICS                                                    EXPECTED FY 2019 (FXN1)
   Revenues                                                   ~ EUR 1.40bn to EUR 1.45bn
                                                              ~ EUR 295m (plus/minus EUR 5m) + EUR 92.3m leads to following upgrade:
   Adj. EBITDA incl. derecognition of liabilities (Q1 19)
                                                              ~ EUR 387m (plus/minus EUR 5m)
   Capex (% FXN sales)                                        ~ 12%

                                                        FY 2020 - 2022

    EXPECTED TOP LINE                             EXPECTED ADJUSTED                        EXPECTED CAPEX
    GROWTH                                        EBITDA MARGIN                            REQUIREMENTS
                                                  DEVELOPMENT
    4% to 7% FXN1 revenue growth                                                           Temporary increase of capex
    per annum for the financial years             ~ 21% in FY 2020                         to revenues in 2019 and 2020
    2020 – 2022 based on                          ~ 23% for the financial years            up to 12%
     Market volume growth                        2021 – 2022                              Thereafter back to 8% of
     Gx market outperformance                                                             revenues
     Growth projects
     Sensile Medical

1. See page 105 of annual report FY 2018 for currency assumptions regarding FY 2019
11/04/2019          Q1 2019 Earnings                                                                                                   17
Agenda

      1          Dietmar Siemssen
                 Q1 2019 highlights

      2          Rainer Beaujean
                 Q1 2019 financial review

      3          Dietmar Siemssen
                 Conclusion & outlook

      4          Appendix

11/04/2019   Q1 2019 Earnings               18
Development of net working capital

                                                                                                      FEB 28, 2019   Nov 30, 2018   FEB 28, 2018
                                                                                                        EUR M          EUR M          EUR M

 Inventories                                                                                              190.0         171.5          168.0
    thereof prepayments made                                                                               5.5           4.7            2.7
 Trade receivables                                                                                        227.2         273.5          221.3

 Trade payables                                                                                           163.82       207.42          130.6

 Payments received on account of orders                                                                      -          34.9           34.7

 Net working capital                                                                                      253.4         202.7          224.0

 Average NWC in % of LTM revenues1                                                                        17.8%         17.3%          16.7%

1. In percentage of FXN revenues.
2. Including EUR 0.4m of non-current trade payables as of February 28, 2019 (EUR 0.1m as of November 30, 2018).

11/04/2019          Q1 2019 Earnings                                                                                                               19
GXI Key Data

 in EUR per share                 2008         2009          2010         2011         2012          2013   2014    2015    2016    2017    2018
 Dividend                         0.40            –          0.50         0.60          0.65         0.70   0.75    0.85    1.05    1.10    1.15
 Dividend yield                   1.5%            –         1.8%          1.9%         1.7%          1.4%   1.7%    1.2%    1.5%    1.6%    1.8%
 Payout ratio                     22%             –          26%          25%          25%1          23%    26%     25%     25%     27%     20%
 Share price high                38.20         27.05        29.85         36.62        41.34        50.14   56.42   76.32   76.86   78.01   79.80
 Share price low                 23.99         13.24        22.09         28.30        31.00        37.60   42.31   41.99   57.10   61.03   59.75
 Share price at FY end           27.10         23.05        28.20         31.17        39.41        49.67   44.44   73.90   68.85   67.06   62.90
 Book value per share            15.26         15.29        16.86         17.59        17.14        17.94   19.25   22.23   24.31   25.14   28.35
 P/E ratio2                      14.81         17.20        14.46         12.77       15.041        16.13   15.38   21.67   16.31   16.51   11.09
 Market cap in EUR m               851          724          886           979         1,238        1,560   1,395   2,320   2,162   2,106   1,975
 MDAX weighting year
                                11.48%3       1.33%         1.24%        1.40%        1.47%         1.33%   1.01%   1.42%   1.33%   1.00%   0.87%
 end
 Number of shares in
                                  31.4         31.4          31.4         31.4          31.4         31.4   31.4    31.4    31.4    31.4    31.4
 million

1. Retrospective restatement due to the early adoption of IAS 19 (amended in 2011) from December 1, 2012.
2. Based on adj. EPS after non-controlling interests.
3. SDAX weighting at year end.

11/04/2019          Q1 2019 Earnings                                                                                                                20
Financial calendar and contact details

 FINANCIAL CALENDAR

 June 6, 2019                       AGM

 July 11, 2019                      Interim Report 2nd Quarter 2019

 October 10, 2019                   Interim Report 3rd Quarter 2019

 CONTACT DETAILS
 Name                               Corporate Investor Relations

 Phone                              +49 211 6181 257
 Fax                                +49 211 6181 121
 E-mail                             Gerresheimer.ir@gerresheimer.com
 IR website                         www.gerresheimer.com/ir

11/04/2019       Q1 2019 Earnings                                      21
Overview of Abbreviations and Definitions

ABBREVIATIONS AND DEFINITIONS

Adj. EBITDA             Net income before income taxes, net finance expense, amortization of fair value adjustments, depreciation and amortization, impairment losses,
                        restructuring expenses and one-off income and expenses
Adjusted EPS            Adjusted earnings per share after non-controlling interests, divided by 31.4m shares
Adjusted net income Net income before non-cash amortization of fair value adjustments, non-recurring effects of restructuring expenses, portfolio adjustments, the balance of
                    one-off income and expenses – including significant non-cash expenses – and the related tax effects
CAGR                Compound Annual Growth Rate
Capex                   Investments in tangible and intangible assets
EBIT                    Earnings before interest and taxes
EBITA                   Earnings before interest, taxes and amortization
EBITDA                  Earnings before interest, taxes, depreciation and amortization
FXN                     "Foreign currency neutral" - based on budgeted FX-rates
Gx ROCE                 Adjusted EBITA divided by capital employed (total assets minus investments, investments accounted for using the equity method and other loans, minus
                        cash and cash equivalents, minus pensions (without pension provisions), deferred tax liabilities, and income tax liabilities, minus prepayments received,
                        trade payables, and other non- interest bearing liabilities)
Gx RONOA             The ratio of adjusted EBITA to average net operating assets, comprising the sum of property, plant and equipment and net working capital
Adj. EBITDA Leverage The relation of net financial debt to adjusted EBITDA of the last twelve months, according to the credit facility agreement currently in place
Net financial debt   Short and long term debt minus cash and cash equivalents
Net finance expense     Interest income and expenses related to the net financial debt of the Gerresheimer Group. It also includes net interest expenses for pension provisions
                        together with exchange rate effects from financing activities and from related derivative hedges.
Net working capial
(NWC)                   Inventories plus trade receivables minus trade payables plus/minus prepayments

Op. CF margin           Adjusted EBITDA plus/minus the change in net working capital, minus capex and in relation to revenues
Operating cash flow     Adjusted EBITDA plus/minus change in net working capital, minus capex
P/E Ratio               Company's share price divided by the adj. EPS
RCF                     Revolving credit facility
yoy                     year-on-year

11/04/2019           Q1 2019 Earnings                                                                                                                                               22
Our Vision
Gerresheimer will become the leading global partner
for enabling solutions that improve health and well-being.
Our success is driven by the passion of our people.
You can also read