Siltronic AG Investor Presentation - Q2 2020 - July 30, 2020
←
→
Page content transcription
If your browser does not render page correctly, please read the page content below
Siltronic AG
Investor Presentation – Q2 2020

July 30, 2020

                                  © Siltronic AG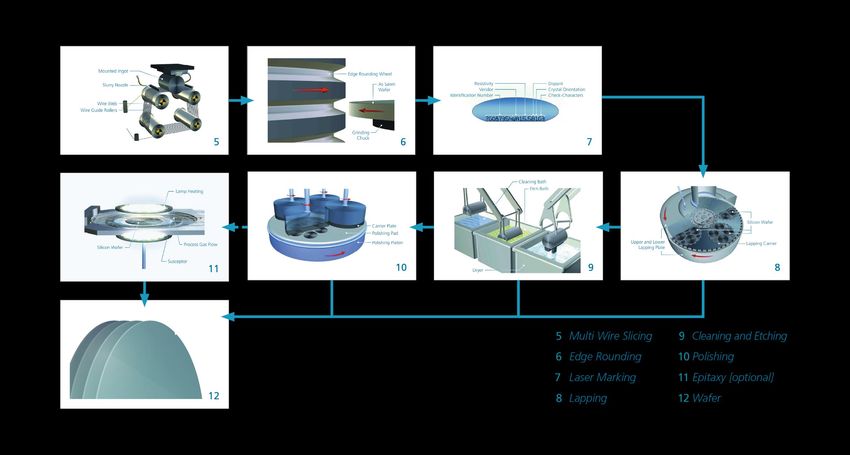
Increasing demand for electronic devices and new applications
drive semiconductor growth, which in turn fuels silicon demand

Electronics value chain 2019

                  Electronics
              USD 1,680 bn

                      Semiconductors
                               USD 400 bn

           Semiconductor silicon wafers
                                            USD 11.2 bn

                   Silicon for electronic applications
                                                               USD 1.1 bn
                                               Source: Electronics (IC Insights), Semiconductors (WSTS, only silicon-based), Silicon wafers (SEMI SMG), Electronic applications (estimate)

           Siltronic AG – Investor Presentation Q2 2020
           July 30, 2020
                                                                                                                                                                                2 of 33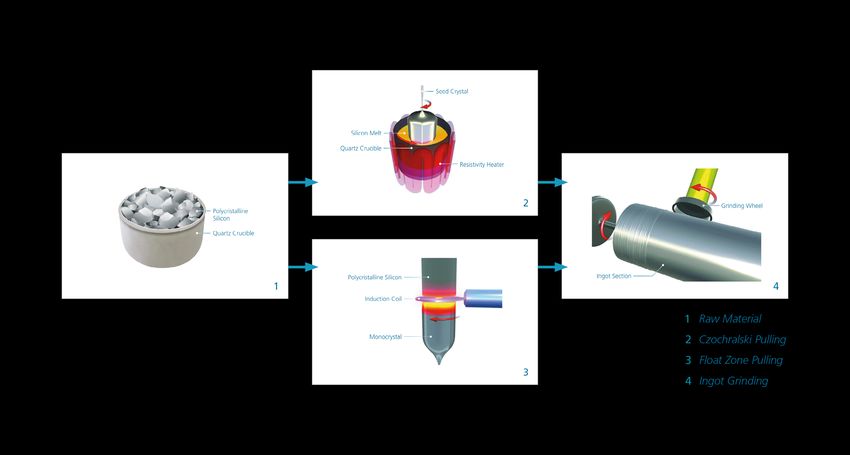
Siltronic has a relevant global market share…

Top 5 wafer producers serve more than 90% of market across all diameters

                                                         17%          12%

                                                                                  13%

                                              25%

                                                                        33%

                                       SK Siltron        Siltronic   Shin Etsu   Sumco   GlobalWafers

                                                                                                Sources: reported company revenues Q1 2020, converted to USD million

          Siltronic AG – Investor Presentation Q2 2020
          July 30, 2020
                                                                                                                                                           3 of 33
... and an international manufacturing network

                                                                                Freiberg         CP*   300 mm

                                                                    Germany
                  Portland                  200 mm

United States

                                                                                Burghausen       CP*   300 mm     SD*

►   Central R&D hub in Burghausen

►   High volume facilities for 300 mm
    in Germany and Singapore

►   Among world’s newest & largest                                              SSW        CP*    300 mm    SSP     200 mm
    fabs in Singapore
                                                                    Singapore

*CP = Crystal Pulling | *SD = 150 mm and smaller

                     Siltronic AG – Investor Presentation Q2 2020
                     July 30, 2020
                                                                                                                        4 of 33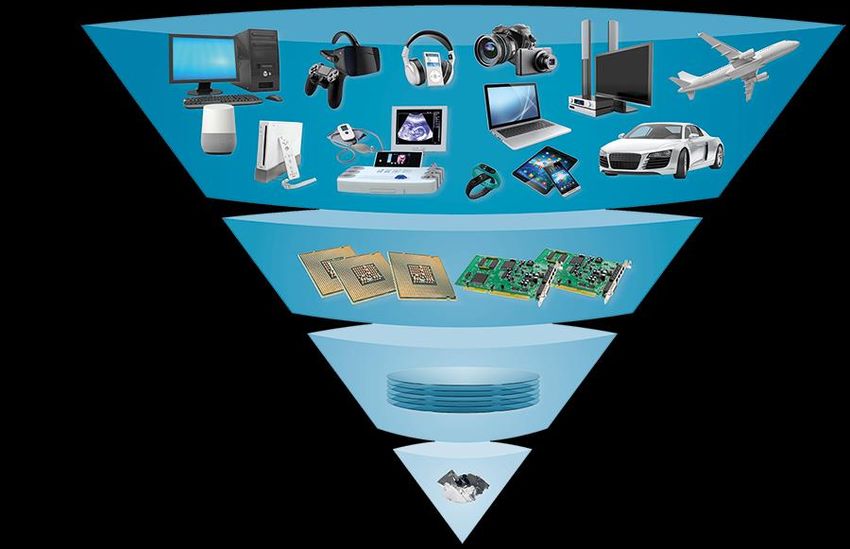
Siltronic is focused on growing 300 mm and attractive 200 mm
business.

Development of Total Wafer Demand per Diameter, in mn 300 mm equivalents per month

                                                                      Strong
7                                                                     demand
     300 mm        200 mm             SD (pol/epi)                       &
6                                                                     growth

5

4

3                                                                    Stable &
                                                                     attractive
2

1                                                                     Mid-term
                                                                      decline
0
 2010 2011 2012 2013 2014 2015 2016 2017 2018 2019 2020
                                                                     Source: SEMI up to June 2020

         Siltronic AG – Investor Presentation Q2 2020
         July 30, 2020
                                                                                        5 of 33
Cost-competitiveness a pre-requisite
Major cost items Cost development 2020
Productivity
improvement
Labour
Supply savings
Recycling
Energy efficiency
Supplies COLA (cost
of living Lower success
adjustment)
sharing
Automation
Depreciation
Freight
Costs
Polysilicon
Energy
Unit cost increase Cost roadmaps
Siltronic AG – Investor Presentation Q2 2020
July 30, 2020
6 of 33Overview Financials
Adjusted financial figures
(EUR million)
2016 2017 2018 2019 H1 2020
Sales 933.4 1,177.3 1,456.7 1,270.4 623.3
EBIT 27.0 235.7 497.7 298.3 120.2
EBIT margin in % 2.9 20.0 34.2 23.5 19.3
EBITDA 146.0 353.1 589.3 408.7 184.7
EBITDA margin in % 15.6 30.0 40.5 32.2 29.6
Earnings per share 0.40 6.18 12.44 7.52 3.12
Capex 88.8 123.2 256.9 363.0 94.3
Free cash flow 1 19.0 169.6 416.4 36.4 29.2
Net cash flow 1 39.6 124.8 240.4 81.3 67.7
-
Dividend - 75.0 150.0 90.0
1 In 2018, Siltronic started reporting the key figure „net cash flow“ instead of „free cash flow“. Net cash flow represents free cash flow without the time shifts created by inflow and
return of customer prepayments which, due to the size, impairs the meaningfulness of free cash flow.
Siltronic AG – Investor Presentation Q2 2020
July 30, 2020
7 of 33Creating value for all stakeholders
... its customers and suppliers … its shareholders
Quality & Innovation Long-term value enhancement
Technology leadership Attractive return
Customer service On-going cost reduction
Siltronic
offers
… its employees ... the environment and society
Occupational health & safety Conservation of resources & recycling
Human Resources Development Compliance & Human Rights
Equality Social commitment
Siltronic AG – Investor Presentation Q2 2020
July 30, 2020
8 of 33Clear commitment to sustainability
Sustainability at Siltronic AG
Claim: We understand sustainability not only as responsible action, but also
want to generate competitive advantages through our sustainable actions.
Strategy: We plan resource-saving right from the start, based on product and
production safety as well as health and environmental protection.
Voluntary commitments: We follow the principles of the Responsible
Business Alliance (RBA) and Responsible Care initiatives and the United
Nations Global Compact.
Goal: We want to reconcile the effects of our business activities with the
expectations and needs of society.
CDP: Siltronic has been evaluated by CDP since 2018; current evaluation results
CDP Climate Change "B | Management" and Water Security "B- | Management“
ISS-oekom: Siltronic has been evaluated by ISS-oekom since 2017. With the
"Prime" rating, Siltronic is one of the leading companies in the semiconductor
industry in the area of sustainability.
Siltronic AG – Investor Presentation Q2 2020
July 30, 2020
9 of 33Environment - Efficiency as a success factor
Selection of non-financial performance indicators in 2019
Raw Material Energy
Energy consumption
Silicon yield per wafer area
improved by decreased by
4% 4.5%
vs. 2018 vs. 2018
Recycling Occupational Safety
The share of returnable The number of accidents
packaging per wafer at work per 1 million
area was hours worked was
69% 2.5
Siltronic AG – Investor Presentation Q2 2020
July 30, 2020
10 of 33CSR targets until 2030
Consistently sustainable action secures long-term competitive advantages for Siltronic
Reduce specific greenhouse gas emissions
by 20%1
Reduce specific energy consumption
by 20%1
Reduce specific water consumption
by 20%1
Increase water recycling by 25%1
Increase waste recycling by 25%1
1 base value 2015
Siltronic AG – Investor Presentation Q2 2020
July 30, 2020
11 of 33Investor structure well diversified with a strong anchor
shareholder
Identified free float by region
(as of June 2020)
42.2 % 30% 32%
69.2 %
24% 14%
100 %
USA UK Germany Other
57.8 % Significant notifications of voting rights
(as of July 27, 2020)
30.8 % Allianz Global Investors 5.13%
State of Norway 4.93%
BlackRock 3.85%
pre-IPO post IPO since March 15,
2017 Goldman Sachs 3.62%
Wacker Chemie AG Free Float Capital Group 3.01%
Siltronic AG – Investor Presentation Q2 2020
July 30, 2020
12 of 33Siltronic strategy - capitalize on market opportunities while focusing
on 300 mm & technological leadership
Optimize returns,
stay ahead in technology and
grow with the market
Strategic Focus
Grow Ensure Improve Execute
with the market technology & financial performance cost reduction
quality leadership & cash flow roadmaps &
debottlenecking
concepts
We continuously increase the value for our stakeholders by providing best-in-class wafers
at competitive costs.
Siltronic AG – Investor Presentation Q2 2020
July 30, 2020
13 of 33FINANCIALS
Q2 2020
© Siltronic AGQ2 sales improved q-o-q
Sales, in EUR m Ø FX rates Q2/19 Q3 Q4 Q1/20 Q2/20
EUR / 1.12 1.11 1.11 1.10 1.10
USD
EUR / 124 119 120 120 118
JPY
Comments
Q2 sales up q-o-q:
higher wafer area sold
flattish price trend
311.8 323.1
299.8 304.3 300.1
Tailwind from USD y-o-y; no change q-o-q
Q2 2019 Q3 Q4 Q1 2020 Q2
Siltronic AG – Investor Presentation Q2 2020
July 30, 2020
15 of 33Productivity improvements lead to lower costs per wafer area
Cost of sales, in EUR m Gross profit, in EUR m / Gross margin, in %
36.1 34.6 31.8 29.8 30.7
199.4 196.1 207.4 210.8 224.0
112.4 103.7 96.9 89.3 99.1
Q2 2019 Q3 Q4 Q1 2020 Q2 Q2 2019 Q3 Q4 Q1 2020 Q2
Selling, R&D and admin expenses, in EUR m Comment
COGS up
higher production volume
higher scheduled depreciation
Costs per wafer area down q-o-q because of
productivity improvements
Q2 gross margin
33.0 32.7 35.2 33.5 33.4 up q-o-q because of higher wafer area sold
down y-o-y due to lower ASP
Q2 2019 Q3 Q4 Q1 2020 Q2
Siltronic AG – Investor Presentation Q2 2020
July 30, 2020
16 of 33High US-Dollar and Japanese Yen exposure
FX exposure, in % FX sensitivity
~ 10% Sales EBITDA
unhedged
~ 25%
1 USD-cent change ~ EUR 6 million ~ EUR 4.5 million
~ 65% ~ 65% 1 JPY change ~ EUR 2.5 million ~ EUR 2 million
Sales Costs
USD SGD JPY EUR
Other currency effects (mostly hedging), Comment
in EUR m No major impact by FX q-o-q
Positive currency effects 2020 vs. 2019
0.4 H1 2019: expenses of EUR 15.1m
-4.2 -3.4 H1 2020: expenses of EUR 3m
-6.9 -7.7
Q2 2019 Q3 Q4 Q1 2020 Q2
Siltronic AG – Investor Presentation Q2 2020
July 30, 2020
17 of 33Higher production volumes positive for earnings
EBITDA, in EUR m / EBITDA margin, in % Depreciation, in EUR m
32.1 30.5 29.6 31.1
28.1
100.0 91.5 90.0 84.2 100.4
-25.4 -27.9 -33.3 -31.0 -33.5
Q2 2019 Q3 Q4 Q1 2020 Q2 Q2 2019 Q3 Q4 Q1 2020 Q2
EBIT, in EUR m / EBIT margin, in % Comments
Higher production volume helped to compensate
lower ASP q-o-q
23.9 Tailwind from USD y-o-y but no significant change
21.2 20.7 q-o-q
18.6 17.8
Depreciation increased as scheduled q-o-q
74.6 63.6 66.9
56.7 53.3
Q2 2019 Q3 Q4 Q1 2020 Q2
Siltronic AG – Investor Presentation Q2 2020
July 30, 2020
18 of 33Net profit of EUR 61 million
Net profit, in EUR m EPS, in EUR
68.5 59.5 60.8 1.98 1.65 1.80
45.4 46.0 1.21 1.32
Q2 2019 Q3 Q4 Q1 2020 Q2 Q2 2019 Q3 Q4 Q1 2020 Q2
Dividend payment, in EUR m Comments
Net profit of EUR 61 million in Q2
Low tax rate of 8% in H1
deferred tax income and some tax relief relating to
Corona in the USA
150
90 Payment of EUR 90 million dividend on June 30, 2020
75
0
FY 2017 FY 2018 FY 2019 FY 2020
Siltronic AG – Investor Presentation Q2 2020
July 30, 2020
19 of 33Working capital slightly up
Working capital, in EUR m Inventories and contract assets, in EUR m
Working capital ratio to quarterly sales, in %
Inventories Contract assets
69 60
58 55 58
60
40
21.4 19.2 14.6 14.5 14.2
182.4 207.0 179.5 188.6 20
168.3 158.8 164.6 152.8 154.6 160.9
0
Jun 19 Sep 19 Dec 19 Mar 20 Jun 20 Jun 19 Sep 19 Dec 19 Mar 20 Jun 20
Trade receivables, in EUR m Trade liabilities, in EUR m
120.1 135.7 127.7 120.6 130.6
Jun 19 Sep 19 Dec 19 Mar 20 Jun 20 -117.9 -112.5 -126.8 -110.2 -117.1
Jun 19 Sep 19 Dec 19 Mar 20 Jun 20
Siltronic AG – Investor Presentation Q2 2020
July 30, 2020
20 of 33Equity decreased due to dividend payment and higher interest-
related pension obligations
Equity, in EUR m Provisions for pensions, Net financial assets,
Equity ratio, in % in EUR m in EUR m
52,8
47,8
45,4
43,4 42,4
Interest rates IFRS
3.37% 2.99% 2.98% 2.88% 2.46%
USA
Germany 1.29% 0,97% 1.24% 1.92% 1.23%
1.031
930
867
804 809
566 552 592 579 589 588
503 492 509
411
Jun Sep Dec Mar Jun Jun Sep Dec Mar Jun Jun Sep Dec Mar Jun
19 19 19 20 20 19 19 19 20 20 19 19 19 20 20
Siltronic AG – Investor Presentation Q2 2020
July 30, 2020
21 of 33Pension reserves up due to lower IFRS interest rates
in Germany
DBO and pension reserves, in EUR m Comment
DBO of EUR 1,195 million ./. assets of
EUR 643 million = EUR 552 million
1,195 ~875 643 Pension reserves @3% = DBO of EUR
~875 million ./. assets EUR 643 million
USA mostly = EUR ~232 million
funded 156 2.46% 142 3%
101 IFRS interest uses bond yields only;
Germany assets include bonds, equity, real estate +
unfunded
203 1.23% 150 3%
33 derivatives
Wacker pension fund
fully funded under German pension
Funded through fund regulations using 3.54% interest
Wacker
Pension Fund 1.23% 3% rate
836 585 509 asset liability study: probability of return
in next 20 years:
≥3.75% 56%
≥3.0% 80%
DBO Jun, DBO Assets Jun, ≥2.5% 91%
2020 @3% 2020
Siltronic AG – Investor Presentation Q2 2020
July 30, 2020
22 of 33Capex 2020 significantly down vs. 2019
Investment, in EUR m Comment
Capex 2020
Significantly down to around EUR 200m
Capacity expansion projects completed in
Q1
Crystal pulling hall in Singapore to be
finished in Q2
363 Epi expansion in H2 to accommodate
demand and market growth
257
~200 Some delays in invest projects due to Corona
(no travel of engineers to start operation of
123
equipment)
54
Siltronic AG – Investor Presentation Q2 2020
July 30, 2020
23 of 33Net cash flow in Q2 influenced by dividend payment
Operating cash flow (OCF), in EUR m Customer prepayments net (PP), in EUR m
100.7
79.1 74.4 85.6
58.6
3.6
-16.2 -15.5 -21.6 -16.9
Q2 2019 Q3 Q4 Q1 2020 Q2 Q2 2019 Q3 Q4 Q1 2020 Q2
CF Capex, in EUR m Net cash flow (NCF), in EUR m
0.4 8.9 40.9 26.7
-66.3 -48.8 -8.8
-94.9 -98.7 -88.2
Q2 2019 Q3 Q4 Q1 2020 Q2 Q2 2019 Q3 Q4 Q1 2020 Q2
NCF= OCF-PP+CF Capex
Siltronic AG – Investor Presentation Q2 2020
July 30, 2020
24 of 33OUTLOOK
© Siltronic AGNegative corona effects on silicon demand in H2 2020
Development of wafer volume in Q3
300 epi strong - good logic and foundry business
300 pol stable - still elevated raw wafer inventories
200 mm decline - high exposure to automotive industry
SD decline - after strong Q2 back to Q1 level
What to expect in H2
After strong Q2 with inventories at customers most likely up, H2 wafer area slightly below H1
Negative impact on wafer demand of automotive industry in H2
Tightened US sanctions against Huawei/HiSilicon add further uncertainty
Uncertainty about smartphone recovery in H2
Siltronic expects H2 to be weaker compared to H1 2020
Siltronic AG – Investor Presentation Q2 2020
July 30, 2020
26 of 33Siltronic Outlook 2020 (as of July 21, 2020)
Sales mid-single digit %-range below 2019 with a slight sequential decrease in H2 vs. H1; in
case of continuing USD weakness, decline could be somewhat higher
EBITDA margin mid-single digit percentage points below 2019
Depreciation
around EUR 140m
EBIT
significantly below 2019 due to higher depreciation
Tax rate
below 10%
Capex
around EUR 200m, mainly in capabilities and automation
Net cash flow significantly below 2019; around EUR 40 million burden from carry-over of unpaid
2019 investments
Earnings per share significantly below 2019
Siltronic AG – Investor Presentation Q2 2020
July 30, 2020
27 of 33APPENDIX
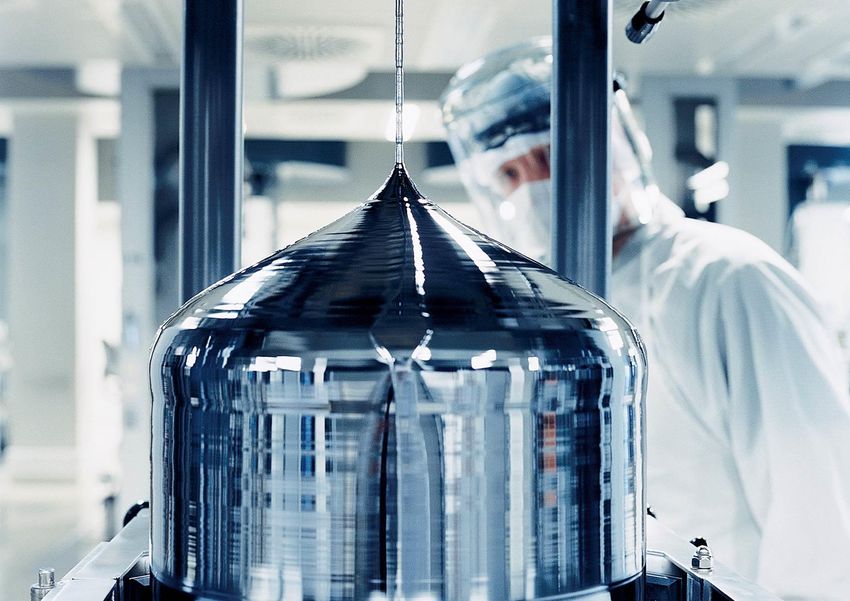
© Siltronic AGProduction process - ingot growing
Siltronic AG – Investor Presentation Q2 2020
July 30, 2020
29 of 33Production process - wafering
Siltronic AG – Investor Presentation Q2 2020
July 30, 2020
30 of 33Contact and Additional Information
Issuer and Contact Additional Information
Siltronic AG ISIN: DE000WAF3001
Hanns-Seidel-Platz 4 WKN: WAF300
D-81737 München Deutsche Börse: WAF
Listing: Frankfurt Stock Exchange
Investor Relations:
Prime Standard
Petra Mueller
email: petra.mueller@siltronic.com
Tel. +49 89 8564-3133
Financial Calendar 2020
Q3 Quarterly Statement October 29, 2020
Siltronic AG – Investor Presentation Q2 2020
July 30, 2020
31 of 33Disclaimer
The information contained in this presentation is for background purposes only and is subject to
amendment, revision and updating. Certain statements contained in this presentation may be
statements of future expectations, future financial performance and other forward-looking statements
that are based on management's current views and assumptions and involve known and unknown risks
and uncertainties. In addition to statements which are forward-looking by reason of context, including
without limitation, statements referring to risk limitations, operational profitability, financial strength,
performance targets, profitable growth opportunities and risk adequate pricing, words such as "may”,
“will”, “should”, “expects”, “plans”, “intends”, “anticipates”, “believes”, “estimates”, “predicts”, “continue”,
“projects” or “seeks”, “potential”, “future”, or “further” and similar expressions may identify forward-
looking statements. By their nature, forward-looking statements involve a number of risks, uncertainties
and assumptions which could cause actual results or events to differ materially from those expressed or
implied by the forward-looking statements. These include, among other factors, changing business or
other market conditions, currency and interest fluctuations, introduction of competitive products, poor
acceptance of new products and services, change of the corporate strategy and the prospects for
growth anticipated by the management. These and other factors could adversely affect the outcome and
financial effects of the plans and events described herein. Statements contained in this presentation
regarding past trends or activities should not be taken as a representation that such trends or activities
will continue in the future. Siltronic AG does not undertake and does not intent to undertake any
obligation to update or revise any statements contained in this presentation, whether as a result of new
information, future events or otherwise. In particular, you should not place any reliance on forward-
looking statements which speak only as of the date of this presentation.
Siltronic AG – Investor Presentation Q2 2020
July 30, 2020
32 of 33SILTRONIC AG | Hanns-Seidel-Platz 4
81737 Munich
Germany
© Siltronic AGYou can also read