1st Half-Year 2016 Presentation for investors, analysts, media - 17 August 2016
←
→
Page content transcription
If your browser does not render page correctly, please read the page content below
1st Half-Year 2016
Presentation for investors, analysts, media
17 August 2016
Highlights in H1 2016

Peter Pauli, Chief Executive Officer
Significant improvement of all key financials
compared to previous years

    Increase in incoming orders H1 2016                                             Order backlog as at 30 June 2016

    +20%                                                                            MCHF 307.4
    to MCHF 268                                                                     Solid base for net sales in H2 2016

    Net sales H1 2016 growing
                                                                                    H2 2016 expectations positive
    +75%                                                                            On track to reach and actually exceed
    to MCHF 218                                                                     targets of solid growth in net sales and
                                                                                    break-even at the EBITDA level for fiscal
    Positive EBITDA                                                                 year 2016

    MCHF 6.2
    achieved in H1 2016

    Positive cash flow operating activities

    MCHF 15.4
    in H1 2016

3     Meyer Burger Technology Ltd, Presentation for investors, analysts and media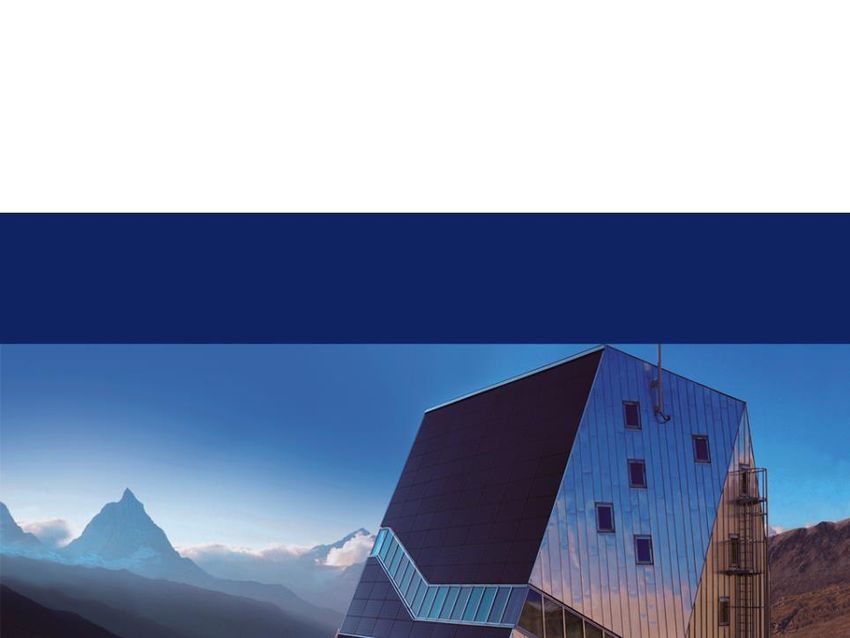
Good order basis
Capacities at PV Tier 1 and 2 producers very
well utilised in H1 2016
Good incoming orders across all of our
PV technologies
Large contract from customer for diamond
wire and cell upgrade technology for
MCHF 40
Various contracts for MB PERC technology
upgrades → customers mostly in China,
investment security at established providers
Contract for Heterojunction / SWCT
technologies from Hevel LLC
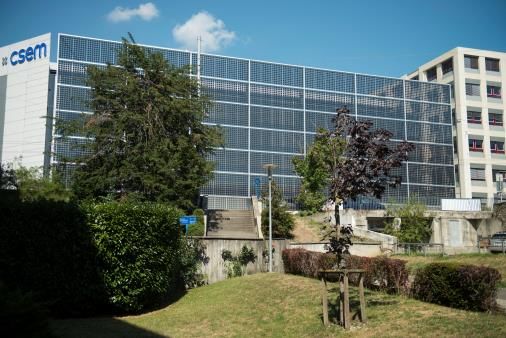
Innovation push for new market participants Heterojunction/SmartWire/Bifacial Façade
Market introduction of high efficiency HJT / CSEM, Neuchâtel, Switzerland
SWCT solar modules in Swiss reference
market
‘Proof of Technology’ - successful
installations in Swiss reference market (Migros,
Swiss Krono, CSEM and others)
Cell connection process
SmartWire/HJT
4 Meyer Burger Technology Ltd, Presentation for investors, analysts and media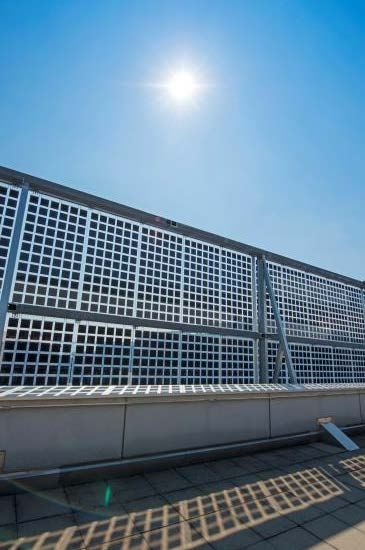
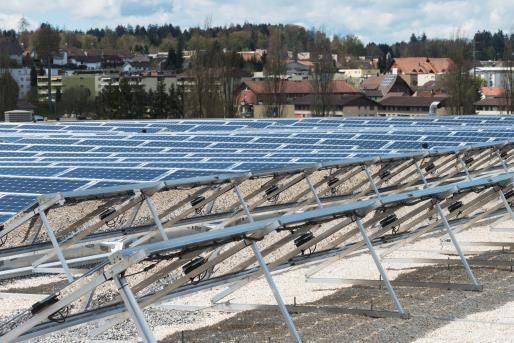
Heterojunction/SmartWire/Bifacial
Application example: Migros Aare, Switzerland
First bifacial, high efficiency, integrated solar system in Switzerland
2
2,500 high efficiency photovoltaic modules covering a total surface area of about 4,200 m
Centerpiece of the solar system is the 500 high performance bifacial heterojunction (HJT) /
SmartWire Technology (SWCT) modules
All production steps for the production of the modules along the entire value chain were done on
Meyer Burger‘s high-tech equipment
Resulting solar energy plant generates up to 900 MWh clear solar electricity annually, which
Migros Aare uses directly in its local facility
Migros Aare is making an important contribution to the Swiss Energy Strategy 2050 as well
securing its own local independent energy supply for its distribution center in Schönbühl (Bern) in
Switzerland with this solar energy system
5 Meyer Burger Technology Ltd, Presentation for investors, analysts and media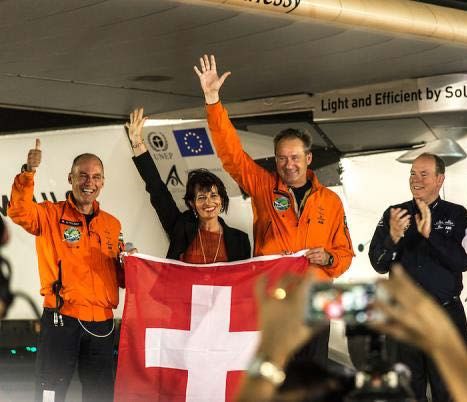
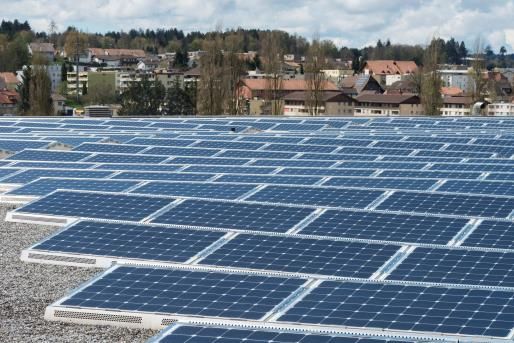
High efficiency modules
Glass-Glass/SmartWire
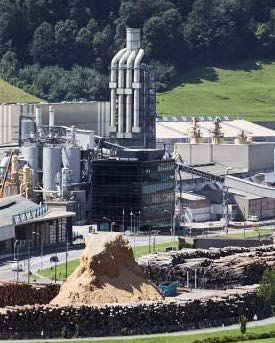
Application example: SWISS KRONO, Switzerland
SWISS KRONO, a global leader in the production of engineered wood products with its
headquarters in Menznau (LU) in Switzerland, has equipped its new office building on all sides
with an active building skin
Photovoltaic is setting new standards as an active and architecturally integrated construction
material
Meyer Burger manufactured and delivered the high performance solar modules for the wood and
glass building
Solar façade (30 x 18 m) is made up of 406 high efficiency glass-glass solar modules in 23
different formats
100% of the solar energy generated will be used on the company site
6 Meyer Burger Technology Ltd, Presentation for investors, analysts and media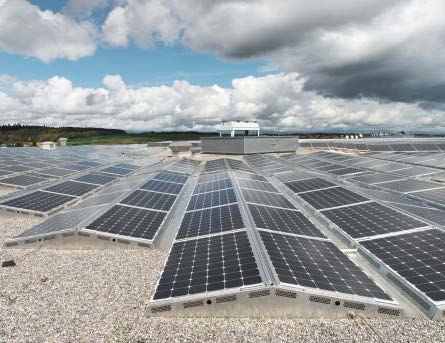
Pionieering achievement: Solar Impulse
Picture: Solar Impulse | Descloux | Rezo.ch Picture: Solar Impulse | Descloux | Rezo.ch Picture: Solar Impulse | Bertrand Piccard
Outstanding pioneering achievement by Solar Impulse travelling around the world in a solar
powered aircraft
Cell connection technology from Meyer Burger connected 17,000 solar cells on the 269.5 m2
wing panel
Successful global circumnavigation highlights the possibilities for solar energy and will drive
further projects for sustainable energy sources
7 Meyer Burger Technology Ltd, Presentation for investors, analysts and media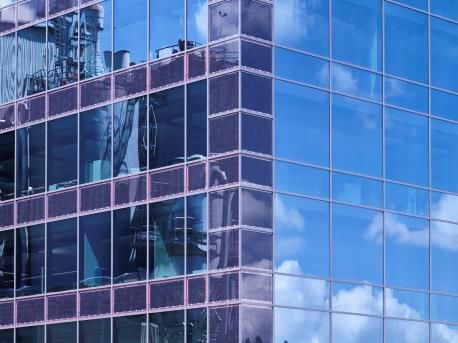
Long-term growth opportunities in the
Solar market remain positive
Cumulated PV capacity increasing annually by 26% to 2020
Long-term megatrends (increase in primary
End market installed PV capacity
energy demand, evolution in energy market
800
with increasing PV share) consistently remain CAGR high 26% / low 16%
700
positive 600
New Global Market Outlook Study by 500
GW
400
Solar Power Europe confirms between 490- 300
716 GW of installed PV capacity (end market) 200
in 2020 100
0
1) 1) 1) 1) 1)
Meyer Burger addresses this growth potential
with a unique, diversified technology and 1) estimate
Historical Low scenario High scenario
product portfolio for high-end solutions in Source: SolarPower Europe 2015-2020
photovoltaics and other selected high-tech
Energy Market 2040 – increasing primary energy demand
industries
Close proximity to our customers and
positioned with a good footprint in our
markets
Increased flexibility in order to quickly and
proactively respond to the challenging global
PV market environment
Source: International Energy Agency
8 Meyer Burger Technology Ltd, Presentation for investors, analysts and media
Financial statements 1st Half-Year 2016
in detail
Michel Hirschi, Chief Financial Officer
Incoming orders / order backlog
Incoming orders first Half-Year
Incoming orders H1 2016 MCHF
Incoming orders +20% compared to H1 2015 300 +20% 268
250 223
Substantial increase of incoming orders confirms trend 200 157
for further increase in production capacities
150
respectively upgrade of existing production lines, at 83
100
wafer and cell manufacturers
50
Capacities at Tier 1 and 2 producers very well utilised 0
in H1 2016 H1 2013 H1 2014 H1 2015 H1 2016
Incoming orders in “normal business” also increasing
Incoming orders Half-Years 2014 - 2016
Substantial number of orders continuously being
MCHF
worked on 300 268
Book to bill ratio 1.23 (H1 2015: 1.79) 250 223
196
200 157 169
150
Order backlog 30 June 2016 100
Order backlog MCHF 307.4 50
(31.12.2015: MCHF 257.5) 0
H1 2014 H2 2014 H1 2015 H2 2015 H1 2016
Order backlog as at 30 June 2016 consists of:
Order backlog last 5 Half-Years
- PV & Alternative Materials MCHF 271.4
MCHF
- Specialised Technologies MCHF 36.0 350 +19% 307
300 261 258
Solid base for sales growth in H2 2016
250 211
190
200
150
100
50
10 Meyer Burger Technology Ltd, Presentation for investors, analysts and media 0
30.06.2014 31.12.2014 30.06.2015 31.12.2015 30.06.2016Incoming orders per month
“normal business” / “large orders”
H1 2015 MCHF 223 H2 2015 MCHF 196 H1 2016 MCHF 268
MCHF
90
80
70
60
54
50 22
31
28
40
37 18
22
30 23
20 39
29 30 28 29 30 29 28 32
10 20 23 22 22 24
18 18 19
11
0
J F M A M J J A S O N D J F M A M J
Orders "normal business" Larger orders
Further increase of activities for larger orders → H1 2016 MCHF 93 (H1 2015: MCHF 82)
“Normal business” also increasing → Ø Run rate H1 2016 MCHF 29 (H1 2015: MCHF 23.5)
Total amount of incoming orders often doubles in those months in which larger incoming orders are received,
larger orders will continue to have a substantial influence on the total incoming orders (irregular timing)
11 Meyer Burger Technology Ltd, Presentation for investors, analysts and mediaNet sales
Net sales +75% to MCHF 217.8
(H1 2015 MCHF 124.4); slightly positive currency Net sales first Half-Year
translation effects (especially Euro) of MCHF
+2.5% in H1 2016
250 +75% 218
Adjusted for currency translation effects and the
200
divestment of R&R Ortner (in August 2015), the
organic sales growth like-for-like was 84% 150 129 124
Asia with 70% of net sales (esp. China) remained most 90
100
important region
50
0
H1 2013 H1 2014 H1 2015 H1 2016
Change in net sales by region Net sales Half-Years 2014 – 2016
MCHF
Europe 250 218
+43% 187 199
200
150 129 124
100
Asia
America +151% 50
-46% 0
H1 2014 H2 2014 H1 2015 H2 2015 H1 2016
12 Meyer Burger Technology Ltd, Presentation for investors, analysts and mediaSplit of net sales MCHF 217.8
By region By type of sales By currencies
1% 5%
7% 11% (7%) (11%)
(24%) (14%) 8% 21%
(21%)
79% (35%)
23% 9% (53%)
(27%) (27%)
70%
(49%) 66%
PV equipment & Alternative Materials (33%)
Asia CHF
Specialised Technologies EUR
Europe
USD
Services, spare parts (PV)
America Other
Consumables
Note: Comparative figures reflecting H1 2015 are shown in brackets
13 Meyer Burger Technology Ltd, Presentation for investors, analysts and mediaOperating income after costs of
products and services
Margin in H1 2016 of 49.2% Op. income a c o p a s first Half-Year
(H1 2015: 57.0%) MCHF
57%
Only few events that had a marginal one-time effect on 120
59% 51% 107
the results for H1 2016 49% 50%
100
Events that had a positive influence on the exceptionally 80 71
47%
66
high margin for H1 2015: 53
60
− Recognised net sales in conjunction with GTAT claim
40
with positive effect in H1 2015
20
− One-time positive cost effects on materials
0
− Change in product mix H1 2013 H1 2014 H1 2015 H1 2016
Normalised margin for H1 2016 was 48.3%
(H1 2015 about 48%) Op. income a c o p a s Half-Years 2014 – 2016
MCHF
57%
120 51% 83 107
100 49% 50%
67 47%
80 66 71 42%
36%
60
40
20
0
H1 2014 H2 2014 H1 2015 H2 2015 H1 2016
Operating income Op. Income margin
Normalised margin
14 Meyer Burger Technology Ltd, Presentation for investors, analysts and mediaOPEX (1) – Personnel
Employees
H1 2016 small increase +22 FTE to 1,547 (at balance Number of employees
sheet date) mainly at technology centre Hohenstein- FTE
Ernstthal and in Services Asia; on the other hand small 44 188 +7 189
1800 182
+22
decrease in Switzerland
Small increase also for temporary employees +7; 1200
movements between the different manufacturing sites 1752 1645 1525 1547
600
Personnel expenses 0
Personnel expenses H1 2016 declined by MCHF 5.7
compared with H1 2015 to MCHF 74.9 (H1 2015: MCHF
80.6)
At constant exchange rates (H1 2015) personnel expenses Personnel expenses Half-Years 2014 – 2016
would even have declined by MCHF 6.9 MCHF
Cost savings mainly from the reduction measures 100
96
respectively optimisations in 2015 84 81
80 74 75
− Costs structures at site Thun and DMT optimised
60
− Specialised Technologies also has lower personnel
expenses compared to H1 2015. Sale of Roth & Rau 40
Ortner companies in August 2015 20
0
H1 2014 H2 2014 H1 2015 H2 2015 H1 2016
Employees (permanent positions)
Temporary employees
15 Meyer Burger Technology Ltd, Presentation for investors, analysts and mediaOPEX (2) / EBITDA
Other operating expenses
Total other operating expenses MCHF 26.1 EBITDA first Half-Year
(H1 2015: MCHF 23.1) MCHF
Only moderate increase by about 13% in other operating 40
expenses despite the growth in net sales of +75% and 20 6 3%
the substantially increased business volume
0
-20
-26%
-40 -33
Positive EBITDA of MCHF 6.2 – Turnaround achieved -60 -43%
-60 -55
H1 2016 MCHF 6.2; positive margin of 2.9% -80 -66%
(H1 2015 MCHF -32.7) H1 2013 H1 2014 H1 2015 H1 2016
First time since 2012 that positive EBITDA in the first
half-year period was achieved (last H1 profit at EBITDA EBITDA Half-Years 2014 – 2016
level was in 2012 with MCHF 4.6) MCHF
Substantial improvement of EBITDA situation due to 40
higher net sales and optimised cost base 20 6
3%
0
-12%
-20
-40 -22% -26% -23
-33
-40
-60 -43%
-55
-80
H1 2014 H2 2014 H1 2015 H2 2015 H1 2016
EBITDA EBITDA margin
16 Meyer Burger Technology Ltd, Presentation for investors, analysts and mediaEBIT
Depreciation and amortisation continue to decline. EBIT first Half-Year
For H1 2016 at MCHF 27.0 (H1 2015 MCHF 35.8) MCHF
100
Scheduled depreciation and amortisation 50
Property, plant and equipment 0
− Depreciation of MCHF 9.0 -21
-10%
-50
Intangible assets
-100 -69 -55%
− Amortisation of intangible assets of MCHF 18.0 -97 -88 -68%
-150 -107%
mainly related to M&A activities in 2011 and
H1 2013 H1 2014 H1 2015 H1 2016
previous years
EBIT Half-Years 2014 – 2016
EBIT also headed towards break-even (half-year trend) MCHF
100
50
0
-10%
-50 -21
-30%
-74 -39% -55% -60
-100
-68% -69
-88
-150
H1 2014 H2 2014 H1 2015 H2 2015 H1 2016
EBIT EBIT margin
17 Meyer Burger Technology Ltd, Presentation for investors, analysts and mediaFinancial result / Taxes
Financial result
Financial result, net, of MCHF -7.9 (H1 2015 MCHF -25.3)
− Financial income:
− Interest income MCHF 0.2
− Valuation of intercompany loans to foreign subsidiaries as at 30 June 2016 without major changes in
unrealised foreign currency translation effects; neither positive nor negative
− Other unrealised positive foreign currency translation effects of MCHF 0.4
− Financial expenses:
− Interest expenses MCHF 3.3 for 5 % straight bond and MCHF 2.9 for 4 % convertible bond (coupon and
effective interest), MCHF 0.3 for bank loans, MCHF 0.5 for loan secured by mortgage certificates on building
in Thun
− Other financial expenses MCHF 1.5 (amongst others amendment fees and bank guarantees)
Taxes
Tax income of MCHF 3.2 (H1 2015 tax income of MCHF 0.8)
− Current income taxes MCHF 0.2 (H1 2015 MCHF 0.1)
− Deferred income taxes MCHF 3.0 (H1 2015 MCHF 0.7); mainly MCHF 3.1 of deferred income taxes due to
reduction of deferred tax liabilities on intangible assets as well as foreign currency translation effects
18 Meyer Burger Technology Ltd, Presentation for investors, analysts and mediaNet result
Net result Net result first Half-Year
Net result H1 2016 MCHF -25.6 MCHF
(H1 2015 MCHF -93.0) 100
Attributable to the shareholders of MBTN 50
MCHF -25.4 0
Minority interests MCHF -0.2 -50 -26
-100 -81 -88 -93
-150
Earnings per share in the first Half-Year H1 2013 H1 2014 H1 2015 H1 2016
Losses substantially reduced; already achieved
positive EPS on Cash EPS basis Net result Half-Years 2014 – 2016
MCHF
EPS CHF -0.28
100
(H1 2015 CHF -1.03)
50
Ø Number of outstanding shares
0
90,550,630 (H1 2015: 90,070,839)
-50 -26
Cash EPS CHF +0.17 -47
-100 -76
(H1 2015: CHF -0.31) -88 -93
-150
H1 2014 H2 2014 H1 2015 H2 2015 H1 2016
19 Meyer Burger Technology Ltd, Presentation for investors, analysts and mediaIncome statement in detail TCHF H1 2016 in % H1 2015 in% Net sales 217 759 100.0% 124 425 100.0% Other income 2 955 6 063 Income 220 714 130 488 Changes in inventories of finished products and work in process 20 439 30 012 Costs of products and services -136 594 -92 106 Capitalised services 2 667 2 513 Operating income after costs of products and services 107 226 49.2% 70 907 57.0% Personnel expenses -74 862 -80 591 Other operating expenses -26 117 -23 064 EBITDA 6 247 2.9% -32 749 -26.3% Depreciation and impairment property, plant and equipment -9 010 -13 879 Depreciation and impairment intangible assets -18 039 -21 872 EBIT -20 802 -9.6% -68 500 -55.1% Financial result -7 915 -25 309 Earnings before taxes -28 717 -13.2% -93 810 -75.4% Income taxes 3 158 800 Result -25 559 -11.7% -93 009 -74.8% 20 Meyer Burger Technology Ltd, Presentation for investors, analysts and media
Balance sheet
Small increase in total assets of MCHF TCHF 30.06.2016 in % 31.12.2015 in %
13.5
Cash and cash equivalents 113 514 101 457
Trade and other receivables 64 556 45 200
Liquidity increased by MCHF 12.1 Inventories 128 001 117 829
mainly through positive cash flow from Other current assets 8 045 15 009
operating activities
Total current assets 314 116 53.6% 279 495 48.8%
Other long-term receivables 1 907 2 045
Equity ratio of 25.6% Property, plant and equipment 113 993 120 318
Intangible assets 60 628 77 888
Financial liabilities: Deferred tax assets 95 135 92 558
− MCHF 130 5% straight bond 2017 Total non-current assets 271 663 46.4% 292 809 51.2%
Total assets 585 779 100% 572 304 100%
− MCHF 30 loan secured by mortgage
Current financial liabilities 160 409 702
certificates 2017
Trade payables 50 897 36 138
− MCHF 89 4% convertible bond
(equity component of MCHF 11 Customer prepayments 68 919 46 241
recognised in equity as this reflects Current provisions 8 480 10 028
the convertible bond‘s conversion Other current liabilities 48 136 44 270
right) Total current liabilities 336 841 57.5% 137 380 24.1%
− Straight bond and loan secured by Non-current financial liabilities 91 582 250 111
mortgage certificates were Non-current provisions 3 011 5 101
reclassified to current liabilities
Deferred tax liabilities 2 028 2 364
Other non-current liabilities 2 217 2 345
Working on various alternatives, and Total non-current liabilities 98 838 16.9% 259 920 45.4%
having intensive discussions and Equity incl. minority interests 150 100 25.6% 175 003 30.6%
negotiations with relevant parties
Total liabilities and equity 585 779 100% 572 304 100%
regarding bond maturing in 2017
21 Meyer Burger Technology Ltd, Presentation for investors, analysts and mediaAnalysis Net Working Capital
Increase in receivables by TCHF 30.06.2016 31.12.2015 31.12.2014
about MCHF 19.4 (mainly Trade and other receivables 64 556 45 200 61 425
high amount of invoices in
Inventories (gross) 221 986 201 655 189 808
June and VAT receivable
./. Allocated customer prepayments -93 985 -83 826 -55 389
Germany)
Inventories (net) 128 001 117 829 134 418
Other current assets (excluding cash and cash equivalents) 8 045 15 009 4 936
Increase in inventories Current assets excluding cash and cash equivalents 200 602 178 038 200 780
again financed through Current financial liabilities 160 409 702 305
higher customer
Trade payables 50 897 36 138 35 771
prepayments
Customer prepayments 68 919 46 241 50 926
Reclassification of 5% Provisions 8 480 10 028 16 777
straight bond 2017 (MCHF Other current liabilities 48 136 44 271 40 914
130) and loan secured by Current liabilities 336 841 137 380 144 693
mortgage certificates
Net working capital -136 239 40 658 56 087
(MCHF 30) from
Without reclassified financial liabilities (bond + mortgage loan) 159 837 N/A N/A
non-current to current
liabilities. Non-cash item! Net working capital 23 598 40 658 56 087
Increase in incoming
orders also reflected in the
In H1 2016, change in NWC of MCHF -17.1
substantial increase of
Decline in NWC despite increase in production volumes (inventories gross
customer prepayments
MCHF +20.3 on NWC) and despite increase in trade receivables (MCHF +19.4 on
NWC) mainly due to strong increase in customer prepayments (MCHF -32.8 on
NWC) and higher trade payables (MCHF -14.8 on NWC).
22 Meyer Burger Technology Ltd, Presentation for investors, analysts and mediaCash flow
TCHF H1 2016 H1 2015
CF from operating activities MCHF +15.4
Result -25 559 -93 009
Turnaround in operating CF achieved
Non-cash items 22 554 57 684
After a substantial reduction of the CF from op. activities before changes in NWC -3 005 -35 325
operating cash drains in FY 2015, MBT
now achieved positive operating cash Change in NWC (cash related) 18 450 7 322
flow of MCHF 15.4 in H1 2016 Cash flow from operating activities 15 445 -28 003
Investments in property, plant, equipment, net -2 428 -2 790
CF from investing activities Investments in intangible assets, net -486 -82
Normal conservative investments in Cash flow from investing activities -2 914 -2 872
non-current assets of MCHF 2.9
Capital increases (incl. premium) 43 -
Purchase shares of MB (Germany) after change control -485 -1 406
CF from financing activities
Repayment current financial liabilities -36 -34
No particular financing activities in H1
Cash flow from financing activities -478 -1 440
2016
Cash, cash equivalents at beginning of period 101 547 169 768
Purchase of further shares in Meyer
Burger (Germany) AG (former Roth & Change in cash, cash equivalents 12 053 -32 314
Rau AG) Currency translation effects on cash, cash equivalents 4 -3 525
Cash, cash equivalents at end of period 113 514 133 929
23 Meyer Burger Technology Ltd, Presentation for investors, analysts and mediaCash flow from operating activities
Turnaround of cash flow from operating activities Cash flow from operating activities first Half-Years
First time since 2011 that positive CF from operating MCHF
activities was achieved during the first half-year period 100
(last positive CF from operating activities during H1
was in 2011 with MCHF +178) 50 15
The executed cost reduction measures positively 0
influence the cash flow -50 -28
Substantial increase in customer prepayments
-100 -82
received and trade payables that are not yet due and -99
not yet paid had a positive influence on the cash flow -150
H1 2013 H1 2014 H1 2015 H1 2016
Positive cash flow from operating activities also CF from operating activities Half-Years 2014 – 2016
expected for H2 2016
MCHF
100
50 15
0
-50 -28 -24
-54
-100
-99
-150
H1 2014 H2 2014 H1 2015 H2 2015 H1 2016
24 Meyer Burger Technology Ltd, Presentation for investors, analysts and mediaGrowth path for coming years
Road 2020/21 targets
H1 2016 2016 – 2020/21 2020/21
Achievements H1 2016 Targets
Net sales growth 75% to Sales growth of between 20% and
40% per annum (different growth
Net sales of CHF 1.3 billion
MCHF 217.8
rates in the different years)
Costs under control Break-even with positive EBITDA in
EBITDA margin 13-15%
EBITDA positive MCHF 6.2 2016, afterwards continuous
improvement of EBITDA margin
High cash flows from
CF from op. activities Achieving positive cash flows
operating activities
positive MCHF 15.4
Fiscal year 2016 started in line with expectations.
Strong increases in incoming orders and net sales, and substantial improvements in financial
results expected for the entire Fiscal Year 2016 (compared to FY 2015).
On track, to reach and actually exceed targets of solid growth in net sales and break-even at
EBITDA level.
PV market offers good growth potential.
25 Meyer Burger Technology Ltd, Presentation for investors, analysts and mediaDisclaimer
Information in this presentation may contain “forward-looking statements”, such as guidance, expectations, plans, intentions or
strategies regarding the future. These forward-looking statements are subject to risks and uncertainties. The reader is cautioned
that actual future results may differ from those expressed in or implied by the statements, which constitute projections of
possible developments. All forward-looking statements included in this presentation are based on data available to Meyer
Burger Technology Ltd as of the date that this presentation is released. The company does not undertake any obligation to
update any forward-looking statements contained in this presentation as a result of new information, future events or otherwise.
This presentation is not being issued in the United States of America and should not be distributed to U.S. persons or
publications with a general circulation in the United States. This presentation does not constitute an offer or invitation to
subscribe for, exchange or purchase any securities. In addition, the securities of Meyer Burger Technology Ltd have not
been and will not be registered under the United States Securities Act of 1933, as amended (the "Securities Act"), or any state
securities laws and may not be offered, sold or delivered within the United States or to U.S. persons absent registration under
an applicable exemption from the registration requirements of the Securities Act or any state securities laws.
The information contained in this presentation does not constitute an offer of securities to the public in the United Kingdom
within the meaning of the Public Offers of Securities Regulations 1995. No prospectus offering securities to the public will be
published in the United Kingdom. Persons receiving this presentation in the United Kingdom should not rely on it or act on it in
any way.
In addition, the presentation is not for release, distribution or publication in or into Australia, Canada or Japan or any other
jurisdiction where to do so would constitute a violation of the relevant laws or regulations of such jurisdiction, and persons into
whose possession this document comes should inform themselves about, and observe, any such restrictions.
26 Meyer Burger Technology Ltd, Presentation for investors, analysts and mediaYou can also read