Institutional presentation - Tegma RI
←
→
Page content transcription
If your browser does not render page correctly, please read the page content below
Institutional presentation
INDEX
 1. Tegma history and overview

 2. Market overview

 3. Business segments
 4. Consolidated financial and
    governance review

INSTITUTIONAL PRESENTATION
One of the largest logistics companies of
     Brazil

     Founded in 1969

     Located in São Bernardo do Campo – SP

     Annual revenues of R$1.5 billion

     1.8k employees in 31 bases in 11 states

     Asset light business model

     Listed on B3 since 2007/ Novo Mercado |
     Ticker: TGMA3.bz

     High level of governance: Fiscal Council,
     Audit Committee, 2 independent members
     (1 independent chairman) in the board of
     directors

INSTITUTIONAL PRESENTATION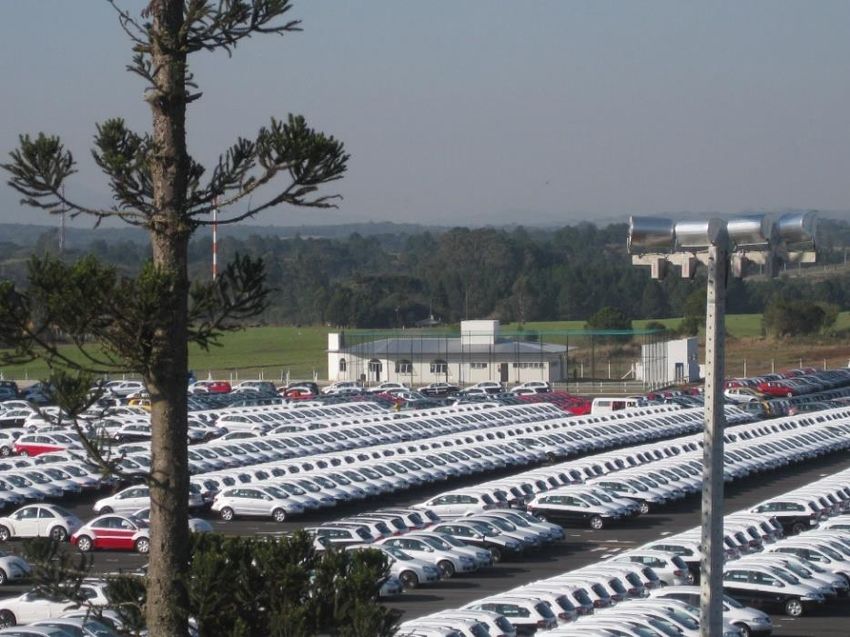
1969                                                                                                   2001
            Vehicle logistics                                        1998
                                                                                                                Acquisition of Translor
          operation start up as           Unification of Sinimbu, Transportadora Schlatter Ltda.
                                                                                                                   Veículos Ltda.
        Transportadora Sinimbu            and Transfer Transportadora Ferroviária de Veículos
           Ltda. (“Sinimbu”)              Automotores Ltda., with the entry of Axis Holding Ltda.;
                                          constituted Axis Sinimbu Logística Automotiva Ltda.

     - Acquisition of 100% of Tegma Cargas Especiais Ltda.;                                                                                  2002
  - Acquisition of 100% of Tegma Logística Integrada S.A. and                                              - Incorporation of Autotrans partner;
             PDI Comércio Indústria e Serviço Ltda.;                                   - Change the company name of Axis to Tegma Gestão
               - Creation of Tegma Venezuela S.A,;                                     Logística Ltda., as a result of the acquisition of the part
                    - Tegma´s IPO – TGMA3                                             held by Allied Holdings (Coimex Group and the Itavema-
                               2007                                                         Sinimbu Group) - Axis do Brasil unlinked the group

                                                                                            2004
                                                             2006
            Acquisition of 100% of                                                  Acquisition of 49% of
                                              Constitution of Tegmax Comércio
            Nortev Transportes de                                                    Catlog Logística de    Creation of a JV for bonded
                                                e Serviços Ltda. (automobile
            Veículos Ltda.                                                            Transportes S.A..     warehouse GDL Gestão de
                                                           auction)
            2008                                                                                               Desenvolvimento em
                                                                                                                   Logística S.A.
                                                      - Direct sale to 8M/B2W.                                         2018
           Acquisition of Direct Express                                            - Sale of Tegma Venezuela
         Logística Integrada S.A. and Trans       -     Discontinuation of Trans
                                                                                                S.A,
         Commerce Transporte de Cargas                   Commerce operations
                                                                                                2017
                 Ltda. (e-commerce)                              2014
                   2011 and 2012

INSTITUTIONAL PRESENTATION
% 2018 Revenues   % 2018 EBITDA

                                         Leader in the logistics of brand new vehicles in
                                         Brazil (~26% market share) serving all
                                         automakers in the country
                                                                                                 85%              86%
                                         Asset light model with outsourced fleet and high
                       AUTOMOTIVE        resilience of results

                       LOGISTICS         Low requirement of investments

                                         Logistic operator for chemical, glasses and
                                         household appliances industry
INTEGRATED LOGISTICS

                                         Integrated inbound transport management,
                                         optimizing and planning routes according
                                         demand                                                  12%
                                         Solid raw material storage/shipping and in-
                                         house liquid management
                       INDUSTRIAL
                                         Reduced inventory levels in the client supply
                       LOGISTICS         chain
                                                                                                                  14%
                                         26 thousand square meters of warehouses in
                                         São Paulo and Rio de Janeiro providing
                                         Inventory, labeling and assembly of kits
                                         The country's largest bonded area for the
                                                                                                  3%
                                         management of imported vehicles in the CLIA
                                         Cariacica-ES
                       WAREHOUSE

            INSTITUTIONAL PRESENTATION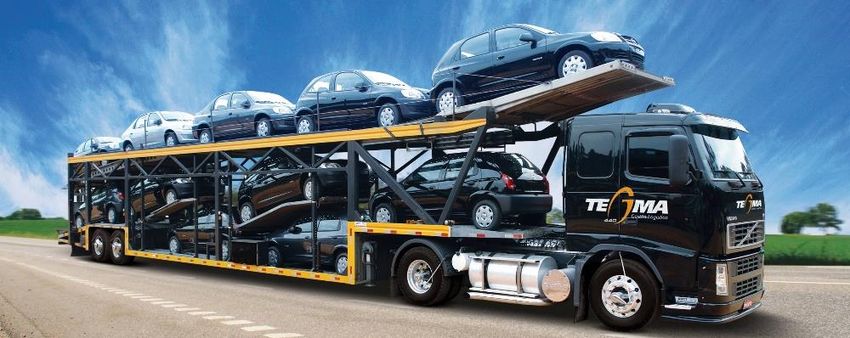
Major        Major clients      3 lst yrs    Growth drivers
                                         competitors                       revenue
                                                                           change
                                                                                       Sales of brand new
                                                          Most of all
                                                                                       vehicles in
                                                        automakers in
                                                            Brasil         +44%        Brazil/Mercosul and
                       AUTOMOTIVE                                                      average distance of
                                                                                       trips
                       LOGISTICS
INTEGRATED LOGISTICS

                                                       Home appliances,                Inbound
                                                        Personal care      +4%         outsourcing among
                                                           and glass                   industries in Brazil
                                                          industries.
                       INDUSTRIAL
                       LOGISTICS
                                                                                       Increase of
                                                          Consumer                     inventories
                                                            goods                      management
                                                          companies,                   outsourcing of
                                                        food, eletronics   N/A         consumption goods
                                                         and cosmetic                  retailers
                                                          companies
                       WAREHOUSE

            INSTITUTIONAL PRESENTATION
#                               Asset
                                              Fleet                       KPI´s / SLA´s
                                                        employees                         intensity

                                         1.5 thousand                - Transit time of
                                                                        deliveries;
                                             (93%         1.0k      - Level of vehicle     Low
                       AUTOMOTIVE        outsourced)                     damage.
                       LOGISTICS
INTEGRATED LOGISTICS

                                         65 carriers                  -   Inventory
                                           owned                             level;
                                                          0.2k      - Manufacturing       Medium
                                          82 trucks
                                                                    plant interruption
                       INDUSTRIAL        outsourced
                       LOGISTICS

                                                                    - Processing NF's
                                                                       on the same
                                                                       issuing day;
                                               -          0.5k      - Stock accuracy -     Low
                                                                         99.98%
                       WAREHOUSE

            INSTITUTIONAL PRESENTATION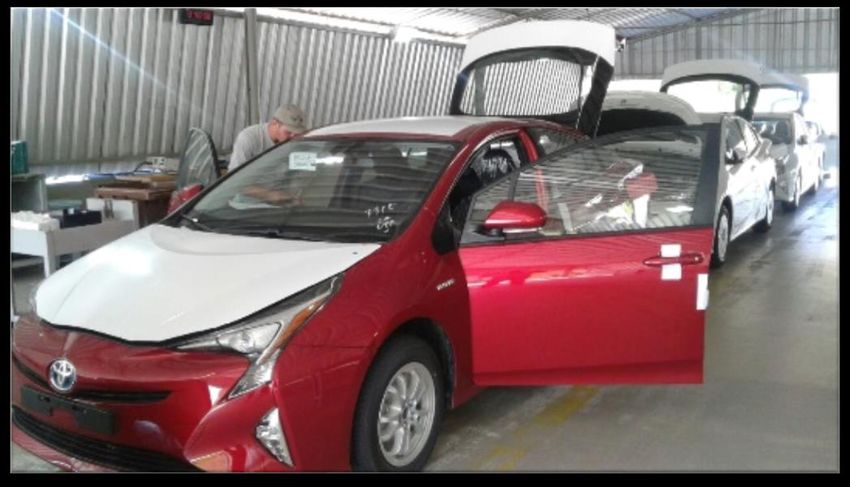
INDEX
 1. Tegma history and overview

 2. Market overview

 3. Business segments
 4. Consolidated financial and
    governance review

INSTITUTIONAL PRESENTATION
Brazilian automotive market:
    65 industrial units / 11 states

    31 assemblers / 616 autoparts
                                                     North/Northeast/Centerwest
    8th largest domestic market                      Production: 14%
    4.0% national GDP                                Consump.: 29%
                                                                  -15%
    5.592 dealerships

    5.2 inhabitants per vehicle

    22% of production is exported (2018)
                                                                       Southeast/South
    14% of national sales is imported (2018)                           Production: 86%
                                                                       Consump : 71%
    Installed capacity: 5 million vehicles
                                                                                   +16%
    High concentration of production in
    South/Southeast – demanding logistics
                                               * Considering FY 2018
Source: ANFAVEA and FENABRAVE                  Source: ANFAVEA

  INSTITUTIONAL PRESENTATION
4,0
                                                                                                                                  2019E:
                                                                                                                                 +39% vs
          3,5                                                                                                                      2016

          3,0
Million

          2,5

          2,0
                                                                                                                           2016:
          1,5                                                                                                             -45% vs
                                                                                                                            peak
          1,0
                                                                                                  -35% vs
                                                                                                    peak
          0,5
                                                              -43% vs peak
          0,0
                1957   1961   1965     1969   1973   1977   1981   1985      1989   1993   1997    2001     2005   2009   2013   2017

                                                             Domestic  vehicle sales
                                                              Vehicles Sales

2019E: +11% vs 2018
Source: ANFAVEA

          INSTITUTIONAL PRESENTATION
Used vehicle sales (and ratio vs Vehicles production Vehicles exports
new vehicle sales)
0.7
10.7 10.7 3
10.1 10.0 10.0 3.5
9.4 2.3 0.6
2.7 2,7 0.5
2.1 0.5
2.6 0.4
5.0 4.9 0.3
4.3
4.0
3.0
2.6
2013 2014 2015 2016 2017 2018 2012 2013 2014 2015 2016 2017 2018 2013 2014 2015 2016 2017 2018
Vehicles fleet Domestic sales Domestic sales
and average age per region per category
42 9,6
100%
56%
41 9,4
41 9.4 80%
40 9.3
9,2
39 9.1 53%
60%
9,0
8,8
38 8.9 40%
8,6
50%
8.6
8.5
8,4
20%
8,2
47% 8,0 0%
2013 2014 2015 2016 2017 2018 2014 2015 2016 2017 2018 2014 2015 2016 2017 2018
Southeast Ex-Southeast Rent a car Sales ex-rentacar
Source: ANFAVEA, SINDIPEÇAS, ABLA and FENABRAVE
INSTITUTIONAL PRESENTATIONINDEX
1. Tegma history and overview
2. Market overview
3. Business segments
4. Consolidated financial and
governance review
INSTITUTIONAL PRESENTATIONServices rendered:
Transfer and distribution of brand new vehicles;
For all automakers installed in Brazil
Yard management and storage of vehicles;
PDI (Pre-Delivery-Inspection);
For rent-a-car and corporate fleet
INSTITUTIONAL PRESENTATIONOEM
Local or
central hub PDI* RAC/ fleet
deliveries
Domestic
(storage)
Port
Autodealer
Local or
central hub
(storage)
deliveries
Export
Port
OEM
*Pre-delivery-inspection
Attending 16 OEM´s and importers
A logistics optimization program that integrates the 781 thousand vehicles hauled per year
demands of automakers and resellers across multiple regions to 754 thousand trips per year
streamline and avoid empty journeys using real-time truck tracking 791 million km per year per vehicle
and load composition software, focused on vehicle visibility, damage 21 hubs in Brazil
control and environmental management of the entire operation Deliveries in more than 2.9 thousand
autodealers in Brazil
INSTITUTIONAL PRESENTATIONMonitoring 100% of trucks;
Electronic control of speed and
work journey
GPS delivery confirmation
Tegma’s entire fleet location
GPS mapping of a delivery
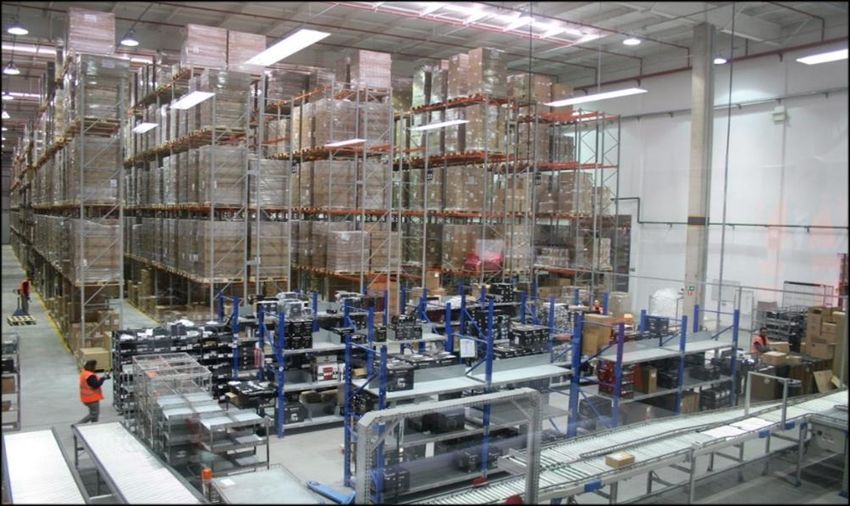
INSTITUTIONAL PRESENTATIONServices rendered:
Yard management
Control the vehicle’s input / output
from yards;
Integrate vehicle’s information with
the transport system;
Vehicle handling in the yard;
Yard in São José dos Pinhais – Parana State
Operational control center
Vehicle storage
INSTITUTIONAL PRESENTATIONServices rendered:
Inspection, preparation, installation
of components for rent-a-car and
companies fleet;
Nationalization of imported vehicles;
Inspection process
Inspection process
Inspection process
INSTITUTIONAL PRESENTATIONSão José dos Campos With Yard Camaçari
Area: 81 thou sqm Area: 64 thou sqm
Manaus
Belém
DC Toyota
Suape
Camaçari
São Bernardo do
São José dos Pinhais Igarapé
Juiz de Fora
Campo
Indaiatuba Cariacica
Area: 160 thou sqm Sorocaba
Piracicaba Caju
Area: 260 thou sqm
Sumaré
SJ Resende
C
SBC
SJP Paranaguá
Araquari
Total yard area: Guaíba
Itajaí
1.8 million sqm Gravataí
Rio Grande
Chuí
• Southeast region: • North region: • South region: • Northeast region:
• SBC – SP • Itajaí – PR • Camaçari – BA
• Cariacica – ES • Manaus – AM • São José dos Pinhais – PR
• SJC – SP • Paranaguá – PR • Suape – PE
• Resende – RJ • Belém – PA • Gravataí – RS
• Itirapina - SP • Guaíba - RS
• Rio de Janeiro - • Chuí – RS
• Indaiatuba – SP • Rio Grande – RS
RJ • Araquari - SC
• Sorocaba - SP
• Piracicaba - SP
INSTITUTIONAL PRESENTATIONTegma’s main yards
Highlights vehicle logistics: Average distance
of trips
Revenue depends on the # of from SP DC
vehicles transported and on the distance
for delivering them upon a fee (R$/total
distance)
Freight costs and other variable
costs (81% of COGS) depend as well on
the # of vehicles transported and on the
distance for delivering them
Tegma manages vehicles for all
automakers in Brazil
SLA´s (Services Level Agreements)
include the transit time and damage on %
of vehicles handled
Prices (with OEM´s and truckers)
are annually readjusted (april-may)
INSTITUTIONAL PRESENTATIONVehicles transported (Thou) Gross Sales Adj EBITDA Adj EBITDA Mg.
300 18%
Market Share
16%
15% 16%
1,186 250
14%
1,699 13%
14%
1,026 1,557 206
200 12%
1,348 175 10% 10% 172
766 754 781
1,149
10%
681 1,129 150
940 118 8%
95
28% 29% 28%
100
78
6%
29%
27% 4%
25% 50
2%
0 0%
2013 2014 2015 2016 2017 2018 2013 2014 2015 2016 2017 2018
2013 2014 2015 2016 2017 2018
Average of 50 days of receivables / 15 days of payment;
Average of 81% of variable costs (% of total COGS);
High resiliency of margins and FCF;
Low demand for expantion investments.
INSTITUTIONAL PRESENTATIONMain clients:
Home
appliances,
Personal care
and glass
industries.
Inventory management, transportation and
storage;
Gross sales: BRL 143 mm py;
Assets employed: chemical carriers, general
carriers (the trucks are all outsourced);
Warehouses in Cubatao and Indaiatuba (all
rented) Tegma warehouses
INSTITUTIONAL PRESENTATIONPLANNING
TEGMA
PORT OPERATION TRANSPORT WAREHOUSE ROAD IN HOUSE
UNLOADING RETROPORT STORAGE TRANSPORT OPERATION
110,000 TONS/ 52,000 TONS / 78,000 TONS /
6 SHIPS/ MONTHS 45 TRUCKS / SHIP
MONTH MONTHS MONTHS
Supplier of the largest powder Inventories covering 24-48 hrs of
detergent factory in the world, production
operating 24 x 7 Inventories 100 miles from plant
Other Home´n care and glass Resulting in client inventory
industries clients reduction
INSTITUTIONAL PRESENTATIONInbound process advantages
Tegma web portal with visibility of the control of the
São Carlos
packaging;
Investment and management carried out by
Curitiba Tegma;
Supplier collection information available 1 day in
advance;
40% increase
KPIs online in the web portal. in vehicle
ocupation
After Tegma Order:
Demand Material planning
Driven
Supplier C
Milk-run
ETOS MRP PSFT
Parts System
Supplier B
Supplier A
Empty OEM
packages
Follow Up
INSTITUTIONAL PRESENTATIONMain clients
Consumer goods
companies, food,
eletronics and cosmetic
companies
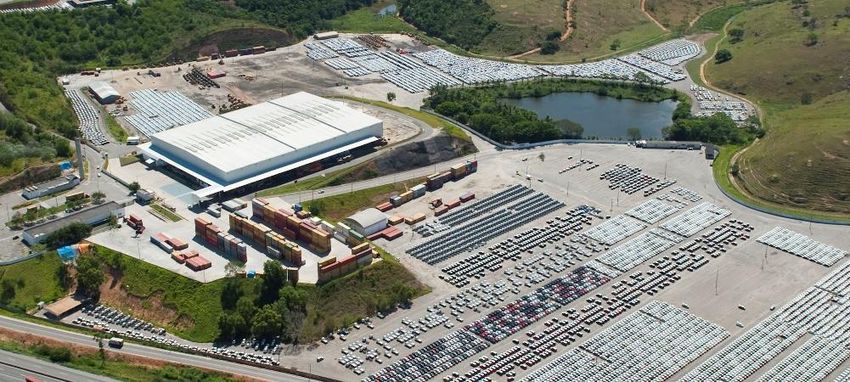
Castello Branco warehouse
Bonded and general warehouses, inventories
management, labeling and assembly of kits;
Gross sales: BRL 47 mm py;
Assets employed: internal warehouse structures (the
warehouses are rented);
27 thousand sqm of warehouses in Rio de Janeiro,
São Paulo and Espirito Santo. Tegma warehouses
INSTITUTIONAL PRESENTATIONGross Sales Adj EBITDA Adj EBITDA Mg.
288 28
238 243
230
17 18%
200 201
191
13
11
7%
10%
4
7%
-6
2%
-3%
2012 2013 2014 2015 2016 2017 2018 2013 2014 2015 2016 2017 2018
Recent developments provide more previsibility;
Industrial logistics with high resiliency of sales and results;
Warehouses have more fixed costs;
Constant cost control and active pipeline of new clients.
INSTITUTIONAL PRESENTATIONINDEX
1. Tegma history and overview
2. Market overview
3. Business segments
4. Consolidated financial and
governance review
INSTITUTIONAL PRESENTATIONGross Revenue (BRL billion)
Adjusted EBITDA (BRL million) Net income (million)
1.86 250 25%
104 108
1.63 200 200
1.54 200
189 20%
1.33
1.23 1.18
150
135 15%
49
16%
13% 99
100 13% 89 12% 10%
14
10
10%
9%
50 5%
0 0% (23)
2013
2014
2015
2016
2017
2018
2013
2014
2015
2016
2017
2018
2013
2014
2015
2016
2017
2018
Free cash flow (BRL million) ROE and ROIC
28%
Shareholder return
74 72 28%
61 0.99
21% 100% 0.93
51 23% 24%
0.71
15% 16%
35 61%
29 17% 11% 60% 60%
53%
6%
0.08 0.12
3% 4%
2013
2014
2015
2016
2017
2018
2013
2014
2015
2016
2017
2018
2013
2014
2015
2016
2017
2018
ROIC% ROE% Dividends per share Payout %
INSTITUTIONAL PRESENTATIONIndebtness (BRL million) Debt Schedule Tegma’s Rating
Amortization
170
150
4,7
150
Outlook: Stable
130
3,7
107 Dec
110
99 B1 2017
2,7
90
74 75 78 78
May
B2
70
2016
0.4 1,7
50
1,1 B1 Nov
35 32 2015
30
0,6 25
0,4 0,7
0,2 0,1 Sep
10 10 10 Ba3
2014
10
3
-10 -0,3
Sep
Ba2
2023
2019
2020
2021
2022
2024
TTM 12M
Jun/19
2015
2016
2017
2018
1Q19
2Q19
2013
Cash
FCF*
Net debt Net debt / Adjusted
EBITDA
INSTITUTIONAL PRESENTATIONManagement, People and
Board of Directors Governance Committee
2 2 2 2 1
Mopia/Cabana Coimex Independents Indicated by Independent
controlling
representants representants 1 chairman
shareholders
Management Fiscal Council Auditing Comitee
Gennaro Oddone
CEO/DRI
2 1 2 1
Ramón Pérez - CFO Indicated by Indicated by Indicated by Independent
controlling minorities controlling
shareholders shareholders
INSTITUTIONAL PRESENTATIONOpacity
Legal compliance (General)
(black smoke emission) (m-¹)
91.4 92.5 93.1
90% lower 87.4 88.2
than the legal Environmental
0.48
limit Tegma’s own
0.43 70.5 compliance in 2018
0.39 Vehicular
0.36 inspection;
0.31 0.32 Environmental Legal
0.27 0.26 Requirements
Trucks not
0.20 97.6%
0.16 attending legal
limit are forbidden Environmental
to transport; licenses
93.1%
2013 2014 2015 2016 2017 2018
Projects that also Main certifications:
aim at socio-environmental benefits
Wanderléia Carrier Vaporization system in washers
-11% in CO2 emissions;
85% reduction in effluent
-10% in accident occurrence; generation in Cubatão
90% reduction in water
consumption in Cubatão and 96%
in Araquari / SC;
Water reuse system SBC site
INSTITUTIONAL PRESENTATION140,0
2M
Brazilian auto market strong growth Brazilian auto market strong decline Brazilian auto market growth
Jair Bolsonaro
Direct Express E-commerce
105,0 acquisition and Business losses
ahead in pools
USD ADTV E-commerce and Direct
& election
Int´n Financial Crisis business expansion Express Sale Michel Temer Presidency
2018 70,0 Brazilian Fiscal Crisis,
unemployment spike
Impeachment Dilma
Rousseff
1.8M 35,0
USD ADTV 0,0
2019
-35,0
Truckers Strike
-70,0
Ownership structure Social security
reform approval
-105,0
Jul-07 Jul-09 Jul-11 Jul-13 Jul-15 Jul-17 Jul-19
Cabana Coimex TGMA3 IBOV
7% 20%
Historical TGMA3 EV/EBITDA and PE
MOPIA Free Float 20
25% 48% 18
16
14
Shareholder agreement 12
10
8
6
4
1Q17 3Q17 1Q18 3Q18 1Q19 3Q18
EV/EBITDA PE
INSTITUTIONAL PRESENTATIONIR website
Detailed Statement of changes in beneficial
ownership of securities history
Financial historical in .xls with indicators, sell
Tegma awarded by two renowed magazines side and industry estimatives, dividends and
as one of the best IR professional and CEO of explanatory notes
Brasil and Latam in 2018
INSTITUTIONAL PRESENTATIONCorporate startup accelerator (Corporate Venture)
Tegma open innovation arm
First accelerator specialized in logistics in Brazil
Focus on solutions First round:
for the following 64 companies applied
What we are looking
areas: 4 winners for:
1 investment
Companies that introduce
Cargo transport;
Second round: innovative solutions in digital
Yards and warehouses;
logistics, transportation and
Customer Service 14 approved mobility;
Automation;
Fleet management; Near of economic
E-commerce (B2B equilibrium, with customers and
platforms); recurring revenue;
Technology for Logistics
Companies that aggregate
(Blockchain, IoT, BigData,
value to our services, forming
I.A.).
longstanding partnerships.
TegUp coworking
INSTITUTIONAL PRESENTATIONInvestor relations https://ri.tegma.com.br/en/ RI Contacts: Ian Nunes – ian.nunes@tegma.com.br - + 55 11 4397 9423
You can also read