Presentation - Third Quarter 2019 - Grupo Bimbo
←
→
Page content transcription
If your browser does not render page correctly, please read the page content below

Presentation

               Third Quarter 2019
Control Group: 75%
                                                                        Today                                                                                                                   Float: 25%

   Market cap(1)           US $8.6 Bn
                                                                    North America                                               Mexico                        Latin America                                EAA
       Sales(2)            US $15.1 Bn
                                                                 U.S.                            Canada
  Adj. EBITDA(2)           US $1.7 Bn

     Countries                    32

       Plants                    197

       Routes                 ≈54,000

  Points of sale              ≈3.1 mm

  Sales centers                ≈1,700

    Associates               ≈135,000

      Products                ≈13,000

______________
(1) As of September 30h, 2019. Expressed in US$ at the FX of $19.73 Ps./US. (2) Net sales and Adjusted EBITDA were Ps. 293,224 million and Ps. 33,241 million, respectively. Converted to US dollars using an average FX rate of the
period of Ps. 19.41/US$. Adj. EBITDA excludes the non-cash charges related to the VSP and organizational restructuring initiatives implemented in the U.S. and Canada.
                                                                                                                                                                                                                                   2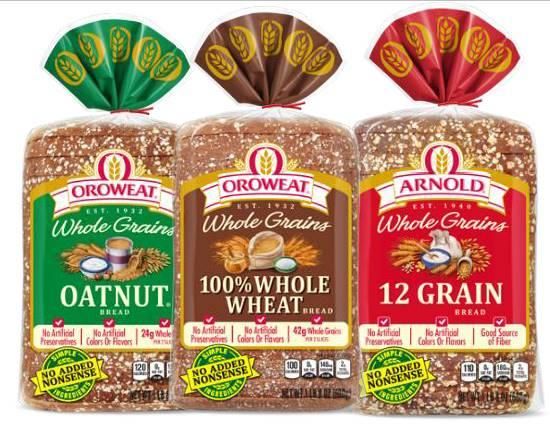
in the Baking Industry
    North America(1)                     Top 3 market share                             EAA(3)                          Top 3 market share
    Sales: 50%
                                                                                                                                                                        Sales Split by Market
                                         within 6 categories                            Sales: 9%                       within 6 categories in
    •    25K associates                                                                 •     13K associates            most countries(5)
    •    78 plants                                                                      •     48 plants                                                         Emerging
                                                                                                                                                                 Markets
                                                                                                                                                                  43%

                                                                                                                                                                                                           Developed
                                                                                                                                                                                                           Markets(4)
                                                                                                                                                                                                             57%

                                                                                                                                                                   Non-Investment-
                                                                                                                                                                        Grade
    Mexico                                                                                                                                                               7%

    Sales: 31%
    •    76K associates
    •    38 plants

           Top 3 market share
                                                          Latin America(2)                     Top 3 market share
           within 8 categories                                                                                                                                                                            Investment-
                                                          Sales: 10%                           within 4 categories                                                                                           Grade
                                                          •     21K associates                                                                                                                                93%
                                                          •     33 plants

____________
Figures for the last twelve months ended as of September 30 th, 2019. Market share information from Nielsen, IRi and Company Information for the countries and categories where Grupo Bimbo participates.
(1) Includes operations in the U.S. and Canada. (2) Includes operations in Central and South America. (3) Includes operations in Europe, Asia and Africa. (4) Developed markets include U.S., Canada and Europe
(5) Buns and rolls category excludes U.K and India. Cakes excludes China, Morocco and U.K., Bagels only in the UK market. and Confectionery by a distributor

                                                                                                                                                                                                                        3
Global Undisputed
                                  represents 4.2% of the US$481 Bn Global Baking Industry1
 Over 2x second player & 5x third player(2)
 Market has over 68k small Artisanal and Private labels representing 85% of industry sales2

                             Industry Fundamentals                                                                                        Competitive Dynamics
                             • Highly fragmented industry                                                                                               • Resilience to economic downturns
                             • Short shelf life of products                                                                                                  • Non-discretionary consumer
                               makes industry local                                                          1                                           2     products
                                                                                                                                                             • High consumption frequency

                                Success Drivers                                                                                                                    Unlocked Value Drivers
                              •   Scale and diversification        4                                                                                     3  • Emerging Markets: higher
                              •   Strong franchise and brand equity                                                                                           disposable income
                              •   Product quality                                                                                                      • Asia and the Middle East: taste shift
                              •   Innovation capabilities                                                                                              • Developed Markets: greater variety of
                              •   Distribution efficiency                                                                                                premium and healthier products

 High Growth Momentum in Snacks: Increased Sales 2.1x Industry Average in the last 5 years3
 ____________
 (1) GlobalData as of 2018, includes Bread and Rolls, Sweet Biscuits (cookies), Savory Biscuits (crackers), Cereal and Energy Bars, Morning Goods, Cakes and Pastries. (2) Euromonitor International, Packaged Food 2020 edition, Baked goods, current price, retail value sales
 (RSP). (3) Euromonitor, Packaged Food 2020 edition, Snacks, current price, retail value sales (RSP)
                                                                                                                                                                                                                                                                                   4
Portfolio Across Geographies,
Categories, Products & Channels
                     By Geography                                             By Categories & Products                                        By Channel

  Sales by Geographic Region                                            10+ Different Categories                                   Modern
                                                                                                                                   Supermarkets, convenience stores,
     North America                                                                                                                 among others
          50%
                                                                         Sliced      Buns &      Salty              English
                                                                                                          Bagels
                                                                         Bread        Rolls     Snacks              Muffin
                                                                                                                                   Traditional
                                                                                                                                   “Mom & pops”
                                                                        Cookies   Cakes       Pastries   Tortillas Confectionery

            EAA                                                                                                                    QSR
            9%                                                          Over 100 Brands
                                                 Mexico                                                                            Quick Service Restaurants
                                                  31%
                 Latin
                America
                 10%                                                                                                               Others
                                                                                                                                   Foodservice, vending machines,
        We have one of the world’s largest
        DSD networks
                                                                                                                                   wholesale, among others

        •      +1.5 mm daily store visits
        •      Our distribution team travels every day
               the equivalent of 108 laps around the
               World

____________
Figures for the last twelve months ended as of September 30 th, 2019.
                                                                                                                                                                       5
Segmenting and Building

                                     sales
                                             >US $1
                                                billion
     Brands

                                     sales
                                             >US $500
                                                 million
     Brands
                                     sales

                                             >US $250
                                                 million
     Brands
                                     sales

                                             >US $100
                                                 million
     Brands
____________
Source: Internal information on estimated retail sales by brand considering the last twelve months as of September 30 th, 2019
                                                                                                                                 6
A Key to Success

  A brand of                      Clean Label &
   ancient                     compostable packaging
 ingredients

                                                                                No Added Nonsense
                                                             Snacks expansion
                                                                                (Simple ingredients)

Made with five 100% natural       No preservatives and
ingredients. No sugar added                                  100% natural          Organic bread
                                artificial colorants added
                                                                                                       77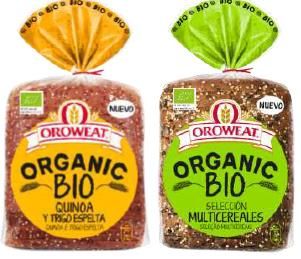
Committed to ESG Initiatives
▪ Sustainability: 90% in Mexico and committed to reach 100% renewable
  electric energy in U.S. by 2020
▪ Food Waste reduction: 50% by 2025
▪ Recyclable, reusable or compostable packaging by 2025
▪ Minimize our agricultural footprint
▪ Promote health and wellness

                                       Our Innovation

                                                         ▪ Investment in promising start ups
                                                         ▪ Leveraging disruptive technology
▪ Transforming our distribution models
▪ Engaging in disruptive product innovation
▪ Identifying and leveraging new
  technologies for business improvement
▪ Connected externally in the search for
  innovation
                                                                                               8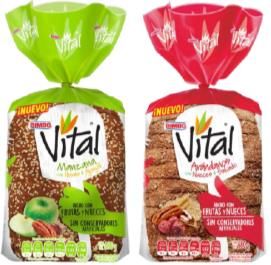
3Q19
Recent Events                       Grupo Bimbo
                                     Net sales grew 3.2% year-over-year
  Grupo Bimbo priced its offering    ✓ Low to mid single digit top line growth
  of US$600,000,000 aggregate          across every region
  principal amount of 4.00%
                                     Adjusted EBITDA increased 10.1%
  notes, due 2049
                                     ✓ Margin expansion of 80 basis points
                                     ✓ All regions posted higher adjusted EBITDA
                                       margin than in the prior year with exception
  Agreed to acquire the “Paterna”      of Latin America
  plant from Cerealto Siro Foods
  in Valencia, Spain. This plant
  produces sliced bread and buns
                                     Mexico
  for Mercadona, under the brand     ✓ Better trends vs. 2Q19
  Hacendado.                         ✓ Sales increased 2.1%
                                     ✓ Volume growth across most categories and
                                       channels
                                                                                      9
with Potential to Continue

                                         SALES                                                                                          ADJ. EBITDA(1)
                                         CAGR: 9.9%                                                                                              CAGR: 13.2%
                                                                        288.3         293.2                                                                                       33.2
                                                         267.5                                                                                                           31.7
                                         252.1                                                                                                      29.3
                                                                                                                                                              27.3
                           219.2                                                                                                          23.4
           187.1
                                                                                                                               18.4

            2014            2015           2016           2017           2018        LTM 3Q19                                   2014      2015      2016      2017       2018    LTM 3Q19

     Adj. EBITDA margin                            2014                         2015                            2016                   2017                 2018                LTM 3Q19
     Grupo Bimbo                                   9.8%                        10.7%                          11.6%                    10.2%               11.0%                 11.3%
     Mexico                                       16.7%                        17.6%                          19.1%                    17.7%               18.2%                 17.9%
     North America                                 6.2%                        8.3%                           9.4%                     9.2%                9.0%                  9.9%
     Latin America                                 3.9%                        2.1%                           1.0%                     1.9%                2.6%                  0.6%
     EAA                                          -0.9%                        -4.4%                          1.4%                     -8.4%               0.4%                  4.0%
Note: Figures in billions of Mexican pesos and CAGR using a 4.75 year period (1) Operating income plus depreciation,     Record margin levels in North America and EAA                      10
amortization, impairment of long-lived assets and provision for multi-employer pension plans and other non-cash items.
Proven Ability to
Net Debt/Adj. EBITDA
(2)
3.1 (3)
3.0
(1)
2.9
2.7 2.7 2.7
2.6 2.6 2.6
2.2
2.0
1.9
2008 2009 2010 2011 2012 2013 2014 2015 2016 2017 2018 LTM
3Q19
2Q19
US$ 2.4 Bn US$ 709 mm CAD$ 1.8 Bn US$ 650 mm
____________
(1) The acquisition of Weston Foods was consummated in January 2009. Leverage ratio giving pro-forma effect to the Weston Foods acquisition as if such acquisition (and the incurrence of the indebtedness thereof) was
consummated on December 31, 2008.
(2) The acquisition of Canada Bread was consummated in May 2014. Leverage ratio giving pro-forma effect to the Canada Bread acquisition as if such acquisition was consummated on May 31, 2014 and Adjusted EBITDA includes
5 months of the EBITDA reported by Canada Bread for such year.
(3) The acquisition of East Balt was consummated in October 2017. Leverage ratio giving pro-forma effect to the East Balt acquisition includes 9.5 months of the EBITDA reported by East Balt for such year (Ps.1,060 million or $56
million converted at the exchange rate of Ps.18.92 per $1 dollar which is the average of the daily exchange rates published by Banco de Mexico for the year ended December 31, 2017). Our Adjusted EBITDA for the year ended
December 31, 2017 was Ps.27,289 million 11Conservative Debt Profile and
Total Debt: US$5,192 mm(1) Debt Split by Currency (2)
Avg. Tenor: 13.8 yrs.
Avg. Cost: 6.0%
100% Fixed Rate MXN
Ratings: BBB/Baa2/BBB 36%
S&P/Moody’s/Fitch
USD
US$2.0 Bn 59%
in undrawn committed revolver facilities CAD
5%
600 800 800
650 600
392 491 500
200
2019 2020 2021 2022 2023 2024 2025 2026 2027 2028 2029 … 2044 … 2047 … 2049
USD Global Bonds MXN Cebures(3)
____________
Note: Figures in US$ mm as of 3Q’19. Amortization profile does not include US$ 190mm debt at subsidiary level
(1) Includes US$600mm of debt maturing in 2020 due to debt repayment in Oct-08. (2) Considers derivatives. (3) “Certificados Bursátiles or Mexican Law Bonds” 12Key Investment
Global consumer food company, leader in the
baking industry, with diversified portfolio of Growth opportunity within a
categories, channels and geographic fragmented industry
presence
Global brands with top of mind awareness Proven sustained growth with history
of margin expansion
World class distribution, efficient production
capabilities and a leading innovation platform Strong and consistent cash flow
generation proven track record of
deleveraging
Experienced management team and strong
corporate governance Strong financial position with solid
balance sheet and investment grade
credit metrics
Solid revenue base with higher exposure to
developed markets
13The Management Team has
Positioned Grupo Bimbo as
Outstanding Corporate Governance
• Corporate Governance aligned with shareholders’ interests
• 35% of board members are independent
• 3 corporate committees
• For the fifth consecutive year, Merco distinguishes Grupo Bimbo as the “Company
with the Best Responsibility and Corporate Governance”
• Daniel Servitje was rewarded 1st place as the leader with the best corporate
reputation by Merco for three years in a row and one of the world’s greatest leaders
by Fortune
Focused on Sustainability
• For the third consecutive year, Grupo Bimbo was named “One of the most ethical
companies in the world” in 2019 by the Ethisphere Institute
• The most committed Company in Mexico to the use of renewable energies and
sustainability – MIREC
• Grupo Bimbo one of the 10 most important companies in Mexico according to the
Expansion Magazine Raking
• Daniel Servitje received in the name of Grupo Bimbo the recognition of
Sustainability granted by Baking & Snack, a leading global publication in the Grain –
Based Food industry
14Coming Soon…
www.grupobimbo.com
15
ir@grupobimbo.com 15Disclaimer
The information contained here in has been prepared by Grupo Bimbo, S.A.B. de C.V. (the “Company") solely for use at this presentation.
This presentation does not purport to contain all of the information that may be required to evaluate any investment in the Company or
any of its securities and should not be relied upon to form the basis of, or be relied on in connection with, any contract or commitment or
investment decision whatsoever. No representation or warranty, either express or implied, is made as to the accuracy, reliability or
completeness of the information presented herein. This presentation has been prepared solely for informational purposes and should not
be construed as containing any offer, invitation or recommendation to purchase, sell or subscribe for any securities in any jurisdiction and
neither the issue of the information nor anything contained herein shall form the basis of or be relied upon in connection with, or act as an
inducement to enter into, any investment activity. This presentation should not be regarded by recipients as a substitute for the exercise of
their own judgment in connection with any investment activity. The merit and suitability of an investment in the Company should be
independently evaluated and any person considering such an investment in the Company is advised to obtain independent advice as to
the legal, tax, accounting, financial, credit and other related advice prior to making an investment.
Any opinion expressed herein is subject to change without notice, and the Company is under no obligation to update or keep current the
information herein. The Company accepts no liability whatsoever for any loss or damage of any kind arising out of the use of all or any
part of this presentation. This presentation includes forward-looking statements. Such forward-looking statements are based on certain
assumptions and current expectations and projections about future events and trends that may affect the Company’s business and are
not guarantees of future performance. Investors are cautioned that any such forward-looking statements are and will be, as the case may
be, subject to many risks, uncertainties and other unknown factors, including those relating to the operations and business of the
Company. These and various other factors may adversely affect the estimates and assumptions on which these forward-looking
statements are based, many of which are beyond our control. Forward-looking statements speak only as of the date on which they are
made. The Company expressly disclaims any obligation or undertaking to update or revise any forward-looking statement, whether as a
result of new information, future events or otherwise. The Company’s independent public auditors have neither examined nor compiled
this presentation and, accordingly, do not provide any assurance with respect to any information included herein. In light of the risks and
uncertainties described above, the future events and circumstances discussed in this presentation might not occur and are not
guarantees of future performance. Neither this presentation nor anything contained herein shall form the basis of any contract or
commitment whatsoever. The information included in this presentation may not be reproduced or redistributed, passed on, or the contents
otherwise divulged, directly or indirectly, to any other person or published in whole or in part for any purpose or under any circumstances
without the Company’s prior written consent.
16You can also read