H1FY19 Investor Presentation - Mark Coulter CEO Mark Tayler CFO - Temple & Webster Group
←
→
Page content transcription
If your browser does not render page correctly, please read the page content below
H1FY19 Investor
Presentation
Mark Coulter CEO
Mark Tayler CFO

                   Page 1
H1 Summary                                                                                                                                                             Pre Audit

            H1FY19 Revenue                                        H1FY18 Revenue
                                                                                       • Temple & Webster is the
           $49.3m                                                $35.2m                  online market leader in
          40% Growth YoY                                                                 furniture & homewares

             H1FY19 EBITDA                                         H1FY18 EBITDA       • $13.6b total market, ~4%
             $0.9m                                              ($0.5m)                  moved online

                                                                                       • Business is now trading
                Dec-18 Cash                                            Jun-18 Cash
                                                                                         profitably with strong top-
            $11.5m                                                  $9.9m                line growth and a debt free
                                                                                         balance sheet

FY19 metrics contained in this presentation are pre-audit.                              Sources: Euromonitor International Limited; Home Furnishings and Homewares System 2017 edition.
FY18 numbers have been adjusted to include the impact of new revenue standard AASB15    IBISWorld Industry Report OD4176 Online Household Furniture Sales in Australia.
                                                                                                                                                                                          Page 2
H1 Summary Cont.

                               •   40% year on year revenue growth
                               •   Shift to online driven by demographic changes independent of
 High growth, even in a weak       macroeconomic factors
       housing market          •   Temple & Webster positioned as “affordable beauty”, appealing to value
                                   conscious shopper

                               •   Furniture & homewares is a $13.6b market (excluding appliances and DIY)
  Market leader in a large,    •   Temple & Webster is the online market leader
     growing market            •   Allows us to forge closer partnerships with our suppliers and invest in key
                                   differentiating areas e.g. technology, experience, content

                               •   $11.5m in cash, with no debt
   Strong balance sheet,
                               •   Trading profitably and cashflow positive
    profitable business        •   Negative working capital model as ~80% of sales do not require holding inventory

                               •   Room ideas (shop the look) & product recommendations (launched)
      Good progress on         •   Pilot bulky delivery service (launched)
     strategic initiatives     •   New Zealand expansion (testing)
                               •   Trade & Commercial Sydney Showroom (underway – Q3 launch)
                               •   Mobile app (underway – Q4 launch)

                                                                                                                      Page 3
Temple & Webster is the leading online retailer for furniture & homewares

Page impressions (MONTHLY)                                                                           Active customers (LTM)
~11m                                                                                                          ~231k

Website users (MONTHLY)                                                                                    Product listings
~1.2m                                                                                                         ~120k

Email subscribers (WEEKLY)
                                                                                                           Sub-categories
~1.6m                                                                                                           ~190
Social media reach                                                                                Average time to dispatch
~510k                                                                                                     ~2 days

Source: www.templeandwebster.com.au only. Google analytics, Social media platforms, T&W systems
                                                                                                                              Page 4
Our core furniture and homewares category is a $13.6
billion dollar market, with only ~4% migrated online
Furniture and Homewares Market (AUS)                                                                   Furniture and homewares online penetration rates by country

                                                                      2017 Data                                                                                                                                           2017 Data

                                                                                                         16%
                                                                                                                                                                                                      14.2%
                                                                                                                                                                   13.7%
                                                                                                         14%

                                                                                                         12%

                                                                                                        10%

                                                                                                          8%

                                                                                                          6%
                                                                                                                               3.9%
                                                                                                          4%

                                                                                                          2%

                                                                                                         0%
                                                                                                                            Australia                               US                                  UK
                                                                                                                                                                CY17

Source: Euromonitor International Limited; Home Furnishings and Homewares                 Source: Euromonitor International Limited; Home and Garden system 2017 edition. Internet sales as a percentage of the total retail sales
System 2017 edition. Sales in 2017 in retail value (inc. sales tax), current terms, and   value (inc. sales tax) for home furnishings and homewares in Australia, UK and US. Current terms..
is to scale.

                                                                                                                                                                                                                                      Page 5
Demographic and structural changes will
drive strong market growth for years to come

1    Millennials are now entering
     our core demographic                      2      Structural changes
                                                      in our favour

Hypothetical distribution of homewares         •   Faster internet and mobile speeds
and furniture spend by age                         eg. NBN, 5G

                                               •   New market entrants accelerating
                                                   online shopping take-up
                                                   eg. Amazon

                                               •   New technologies improving
                                                   experience and conversion
  Millennials                                      eg. augmented reality
  Age 22 - 35
                                               •   Offline exits/store closures

                 35                      65

                                                                                       Page 6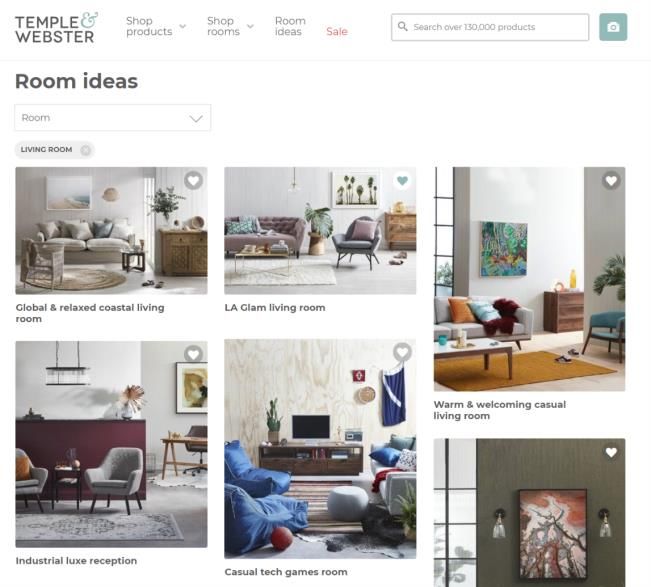
Our strategy is based on range, inspiration and service

    Our Core Belief       •   We believe everyone wants to live more beautifully.

       Our Vision         •   Our vision is to make the world more beautiful, one room at a time.

                          •   Our mission is to deliver beautiful solutions for our customers’ homes and work
      Our Mission             spaces, and for all of our other stakeholders including suppliers and shareholders.

                          •   We want to be famous for having the largest range in our category, the most
  Our Strategic Pillars
                              inspirational content and the best delivery experience & customer service.

                          •   Our foundations are built on data-driven marketing, world-class technology and
                              exceptional execution by an amazing team.

                          •   We believe if we can deliver the above, Temple & Webster will become the first
       Our Goal
                              place Australians turn to when shopping for their homes and work spaces.

                                                                                                                    Page 7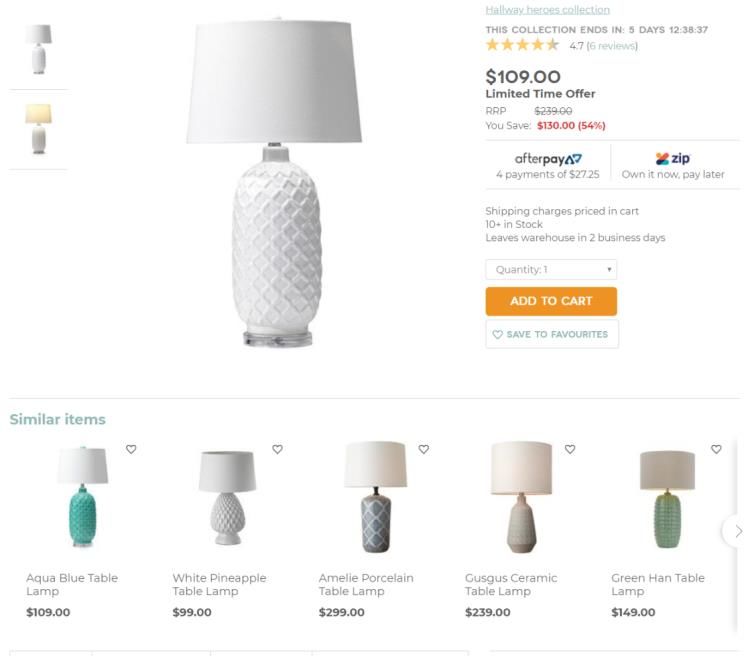
It’s all about the customer

                                                          Net Promoter Score
                                                          (score range: -100% to 100%)

                                                          70%

                                                          60%

                                                          50%

                                                          40%

                                                          30%

                                                          20%

                                                           10%

                                                           0%

Key initiatives to further                               Enforcing quality
                                Taking more control                            Category experts within
drive customer satisfaction                              standards across
                              over delivery experience                          customer care team
                                                           supplier base

                                                                                                         Page 8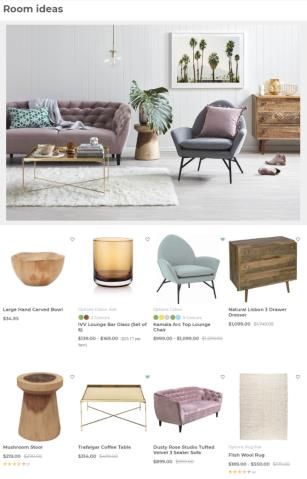
Active customers grew 32% year on year
                                                                                                                                                                                                   ↑13%

                             Active Customers                                                                              Repeat and First Time Orders

250,000

230,000

                                                                                                             60,000
210,000

                                                                                                             50,000
190,000

                                                                                                             40,000
170,000
                                                                                                             30,000

150,000
                                                                                                             20,000

130,000                                                                                                      10,000

110,000                                                                                                            0
          31-Mar-17 30-Jun-17 30-Sep-17 31-Dec-17 31-Mar-18 30-Jun-18 30-Sep-18 31-Dec-18                               2Q17     3Q17     4Q17    1Q18      2Q18    3Q18    4Q18     1Q19   2Q19

                                                                                                                               First Time Customer Orders          Repeat Customer Orders

    NB. Active customers are the number of unique customers who have transacted in the last twelve months (LTM). All numbers are Temple & Webster only and exclude Milan Direct.
                                                                                                                                                                                                    Page 9
Customers metrics have all improved year on year

            Year 1 Marketing ROI                                                        Revenue per Active Customer3                             Conversion Rate4

                                                                                                                                          3.0%
                                                                               $390
                                         $114                                                                                             2.5%
                                                                               $370

                                                                               $350
                                                                                                                                          2.0%
             $56                                                               $330

                                                                                $310                                                      1.5%

                                                                               $290
                                                                                                                                          1.0%
                                                                               $270

       Marketing spend                                                         $250                                                       0.5%
                                  Margin per Active
        per First Time
                                   Customer2 ($)
        customer1 ($)

1. Marketing spend per First Time Customer = Total marketing spend for H1 FY19 divided by number of First Time customers during H1 FY19
2. Margin per Active Customer = Revenue / Active Customer as at 31 Dec 2018 x Delivered Margin % for H1 FY19
3. Revenue per active customer = Last 12 months revenue divided by Active Customers
4. Conversion rate = number of transactions divided by number of unique visitors (source: Google Analytics)

NB: All numbers are for Temple & Webster only and exclude Milan Direct.

                                                                                                                                                                    Page 10
Our business is now scaling profitably Pre Audit
FY16 FY17 FY18 H1FY18 H1FY19
Revenue 100% 100% 100% 100% 100%
Gross Margin 39.9% 42.7% 44.2% 44.2% 44.6%
Delivered Margin (after all
21.7% 27.6% 31.0% 30.8% 30.5%
distribution costs)
Customer Service Staff &
4.9% 4.7% 3.3% 3.1% 3.1%
Merchant Fees
Costs which scale with revenue
Advertising Costs 19.5% 12.6% 11.3% 11.5% 10.9%
Contribution Margin (2.7%) 10.3% 16.5% 16.1% 16.5%
Annualised Fixed Costs Investment in people (buying,
(people, property, tech, other in $13.3 $13.4 $12.6 $12.4 $14.5 marketing and B2B)
$m)
FY16 comparison is performed on a pro forma basis which includes the assumption that Milan Direct and ZIZO were part of the group but exclude any costs associated with the
acquisition and restructure of Milan Direct and ZIZO and any costs associated with the Group's IPO.
FY16-FY18 numbers have been adjusted for the impact of new revenue standard AASB15
Page 11Our Trade and Commercial (B2B) division grew 35% year on year
Our B2B Customer Proposition B2B Sales
$’000s.
$1,600
$1,200
$800
$400
$0
Repeat and First Time Orders
1,400
1,200
1,000
800
600
400
200
0
First Time Trade & Commercial Customer Orders
Repeat Trade & Commercial Customer Orders Page 12We continue to innovate our offering
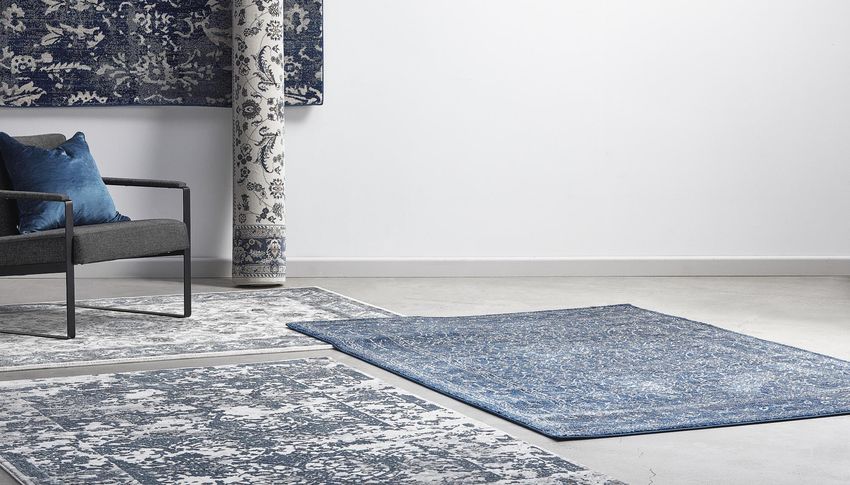
Product Recommendations Room Ideas / Shop the Look
Using AI and machine learning Leveraging back catalogue of proprietary imagery
Page 13H1FY19
Financial
Results
Mark Tayler CFO
Page 14Profit and loss Pre Audit
• H1 growth rate of 40% (numbers reflect the adoption of AASB15)
H1FY18 AASB 15 H1FY18 H1FY19
A$m Pre Adj Adjustment Post Adj Adoption of AASB 15 (Revenue from Contracts with Customers) provides a new framework for
revenue recognition, shifting from previous principles of “Risk and Rewards” towards the concept
Revenue 34.4 0.8 35.2 49.3
of “Control”.
Cost of Sales (19.2) (0.4) (19.7) (27.3) Under the previous Australian Accounting Standards, revenue for TPW was recognised on
shipment of goods in line with TPW’s terms and conditions. Under the new standard, revenue is
Gross Margin 15.2 0.4 15.6 22.0 recognised upon receipt of goods by the customer, resulting in more revenue being deferred (~4
days) at the end of the period.
44.2% 44.2% 44.6%
H1FY18 and H1FY19 received a net benefit as deferred revenue from the prior period (H2 prior
Distribution (4.6) (0.1) (4.7) (6.9) year) was higher than deferred revenue for H1 due to higher average sales levels in June vs
December. Importantly, the YoY statutory revenue growth rate of 40% is in alignment with
Delivered Margin 10.6 0.3 10.8 15.1 gross sales pre accounting adjustments for the period.
30.7% 30.8% 30.5% Both current and comparable periods have been adjusted to reflect the above change in the
revenue accounting policy.
Advertising & Marketing (4.1) 0.0 (4.1) (5.4)
Customer Service &
(1.1) 0.0 (1.1) (1.5)
• Savings resulting from better terms with suppliers were passed onto
Merchant Fees customers through pricing and shipping promotions, resulting in margins
Contribution Margin 5.4 0.3 5.7 8.1 that were materially in line with H1FY18
15.7% 16.1% 16.5%
• H1FY19 operating costs (as a % of sales) down 6% YoY, driven by more
Wages (5.1) 0.0 (5.1) (5.9) efficient marketing spend and fixed costs growing at a slower rate than
Other (1.2) 0.0 (1.2) (1.4)
revenue
EBITDA (0.8) 0.3 (0.5) 0.9 • Contribution margin within target range of 15-17%
Share Based Payments 0.3 0.0 0.3 0.6
• EBITDA of $0.9m, up $1.4m from the prior comparative period, driven by
Adjusted EBITDA (0.5) 0.3 (0.2) 1.4
operating leverage as a result of the strong revenue growth
-1.4% -0.6% 2.9%
EBITDA is a non-IFRS measure that, in the opinion of the Directors, is useful in understanding and appraising the Company’s
performance.
Page 15Top-line growth is delivering operating leverage Pre Audit
↑13%
Revenue by Half EBITDA by Half
52,000 4,000
48,000
2,000
44,000
0
40,000
36,000 -2,000
32,000
-4,000
28,000
-6,000
24,000
20,000 -8,000
H1 FY16 H2 FY16 H1 FY17 H2 FY17 H1 FY18 H2 FY18 H1 FY19 H1 FY16 H2 FY16 H1 FY17 H2 FY17 H1 FY18 H2 FY18 H1 FY19
milandirect.com.au
integrated into
templeandwebster.com.au
FY16 comparison is performed on a pro forma basis which includes the assumption that Milan Direct and ZIZO were part of the group but exclude any costs associated with the
acquisition and restructure of Milan Direct and ZIZO and any costs associated with the Group's IPO.
FY16-FY18 numbers have been adjusted for the impact of new revenue standard AASB15
Page 16Balance sheet & cash flow Pre Audit
A$m 30-Jun-18 31-Dec-18
• Strong balance sheet position with no debt
Cash & Cash Equivalents 9.9 11.5 • Inventory and creditor metrics (WOC/DPO/Ageing profile) all continue to track
Inventories 2.3 3.4 within target ranges
Other current assets 1.3 1.5
• Cash flow positive half (+$1.6m) was driven by a positive EBITDA result and
Intangibles, (inc. goodwill) 7.5 7.5
benefits from the group’s cash flow positive business model, offset by
PPE 0.2 0.3 investment into private label owned inventory
Deferred tax assets 0.7 2.9
Total Assets 21.9 27.1 $12,000 Closing Cash by Quarter
Liabilities
$11,500
Trade and other payables 6.2 8.0 $11,000
Employee accruals and provisions 1.7 1.7 $10,500
Deferred revenue 3.6 3.4 $10,000
Total Liabilities 11.5 13.1 $9,500
$9,000
Net Assets 10.4 14.0
Equity $8,500
$8,000
Share Capital 76.6 76.6
$7,500
Reserves 1.6 2.1
$7,000
Retained earnings (67.8) (64.7) Q3FY17 Q4FY17 Q1FY18 Q2FY18 Q3FY18 Q4FY18 Q1FY19 Q2FY19
Total Equity 10.4 14.0
30 June -18 and 31 Dec-18 reflect new revenue standard AASB15
Page 17Strategy
& Outlook
Page 18Our plan to grow our market leadership in
the online furniture and homewares market
Add depth and Leverage scale to Increase brand
breadth across our core obtain cost advantage awareness through
categories, expand and exclusivity on new digital and non-digital
private label offering product ranges channels
Innovate our offering: Continue pilot of Add design help for all
mobile app, our own delivery van customers
personalisation, network to solve (chat, voice,
augmented reality bulky delivery online, in-store)
Page 19We are setting the business up for future growth horizons
Offline New business
Addressable B2B Adjacent lines, new
markets furniture & furniture &
Categories geographies
fitout homewares
Online
furniture &
homewares
Maintain and Accelerate Continue to Broaden current DIY
FY19 Plan offering Trial NZ market
grow market investment into investigate
leadership Trade & offline channel
Commercial through Add further
division through Melbourne trial adjacent categories
launch of first by and launch of over time
appointment design studio in
showroom Sydney
Page 20
NB: Relative sizes of market opportunities are indicative onlyTrading update & outlook
January has started strongly with
trading exceeding H1 FY19’s year on
year growth rate of 40%.
The Company remains confident of
delivering its maiden full year profit in
FY19.
Page 21Q&A
Page 22Disclaimer
This presentation (Document) has been prepared by Temple & Webster Group Limited ACN 608 595 660 (T&W Group or the Company). This Document is a presentation
to provide background information on the Company and its subsidiaries and is not an offer or invitation or recommendation to subscribe for securities nor does it
constitute the giving of financial product advice by the Company or any other person. The information in this Document is selective and may not be complete or
accurate for your particular purposes.
The Company has prepared this Document based on information available to it to date and the Company is not obliged to update this Document. Certain information in
this Document is based on independent third-party research. No representation or warranty, express or implied, is made as to the fairness, accuracy, completeness or
correctness of the information, opinions and conclusions contained in this Document. To the maximum extent permitted by law, neither the Company, nor its directors,
officers, employees, advisers or agents, nor any other person accepts any liability, including, without limitation, any liability arising from fault, negligence or omission on the
part of any person, for any loss or damage arising from the use of this Document or its contents or otherwise arising in connection with it.
This information has been prepared by the Company without taking account of any person's objectives, financial situation or needs and because of that, you should, before
acting on any information, consider the appropriateness of the information having regard to your own objectives, financial situation and needs. We suggest that you
consult a financial adviser prior to making any investment decision.
This document contains certain “forward-looking statements”. All statements, other than statements of historical fact, that address activities, events or developments that
the Company believes, expects or anticipates will or may occur in the future are forward-looking statements. Forward-looking statements are often, but not always,
identified by the use of words such as “seek”, “anticipate”, event or result “may”, “will”, “can”, “should”, “could”, or “might” occur or be achieved and other similar expressions.
These forward-looking statements reflect the current internal projections, expectations or beliefs of the Company based on information currently available to the
Company.
Forward-looking statements are, by their nature, subject to a number of risks and uncertainties and are based on a number of estimates and assumptions that are subject
to change (and in many cases outside of the control of the Company and its Directors) which may cause the actual results of the Company to differ materially from those
discussed in the forward-looking statements. There can be no assurance as to the accuracy or likelihood of fulfillment of any forward-looking statements events or results.
You are cautioned not to place undue reliance on forward-looking statements. Additionally, past performance is not a reliable indication of future performance. The
Company does not intend, and expressly disclaims any obligation, to update or revise any forward-looking statements.
The information in this Document is only intended for Australian residents. The purpose of this Document is to provide information only. All references to dollars are to
Australian dollars unless otherwise stated.
This document may not be reproduced or published, in whole or in part, for any purpose without the prior written consent of T&W Group.
Page 23Page 24
You can also read