Presentation of the Gorenje Group for Investors - Erste Group Investor Conference 2015

Page created by Dawn Alvarez
 
CONTINUE READING
Presentation of the Gorenje Group for Investors - Erste Group Investor Conference 2015
Presentation
   of the Gorenje
   Group for Investors
    Erste Group Investor
    Conference 2015
   Stegersbach, 6 October, 2015

www.gorenjegroup.com
Presentation of the Gorenje Group for Investors - Erste Group Investor Conference 2015
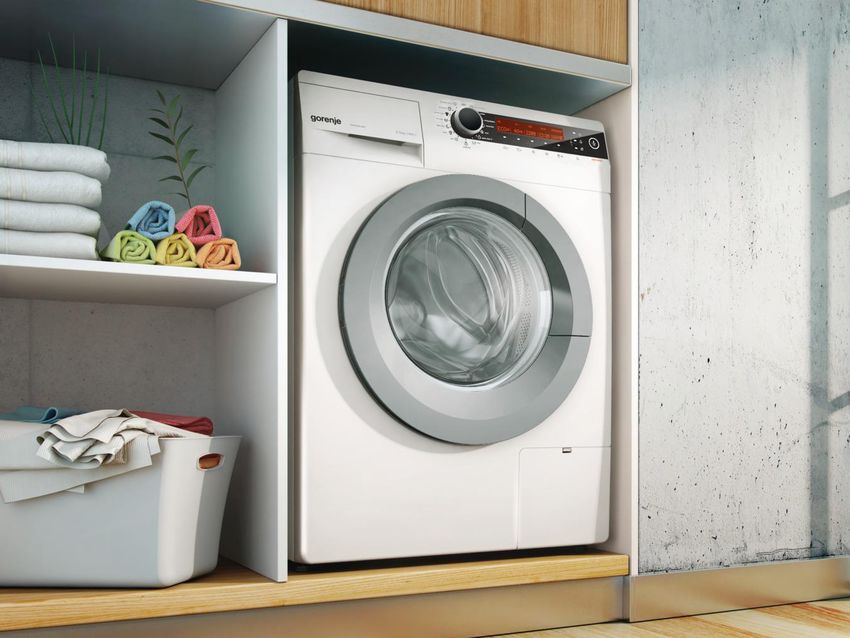
One of Leading European
    Manufacturers of Products for Home

                CORE BUSINESS                               EXPORT
                  Products and                                95%
               services for home                            of sales
               (MDA, SDA, HVAC,
                 kitchen furniture)

        NUMBER OF                         Gorenje                           OWN
        EMPLOYEES                                                      PRODUCTION
          10,468
                                           Group                          Slovenia
                                                                           Serbia
                                                                       Czech Republic

                           CONSOLIDATED                     GLOBAL
                             REVENUE                     PRESENCE
                            EUR 1.25 bn                  90 Countries
                                                          Worldwide,
                                                    mostly in Europe (92%),
                                                    also in USA, Australia,
                                                      Near and Far East
2   www.gorenjegroup.com
Presentation of the Gorenje Group for Investors - Erste Group Investor Conference 2015
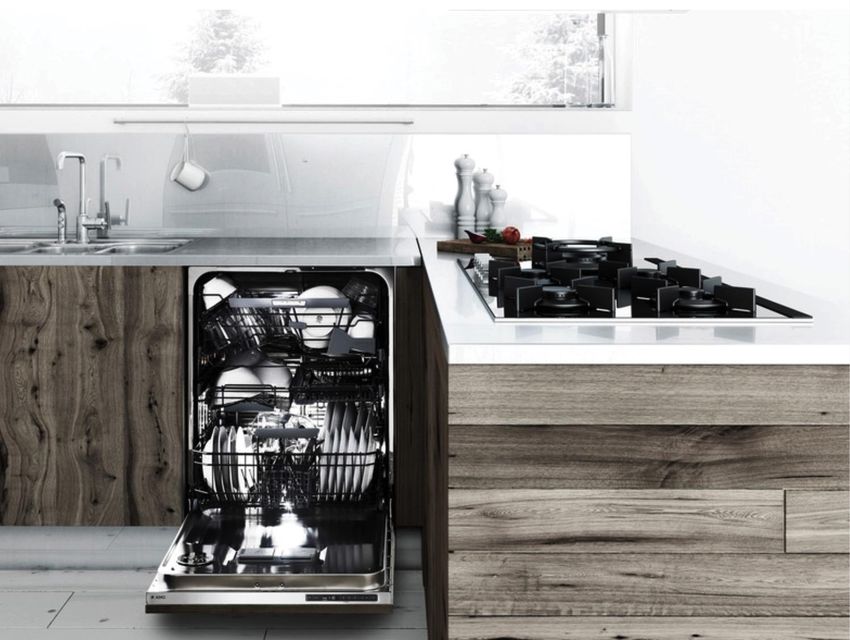
Fast Development in the Last Decade
                                                                                                      2013
                                                                                                   Strategic
                                           2006                          2010                    Alliance with
         1998
                                    New refrigerator                Acquisition of the             Panasonic
     Gorenje, d.d.,
                                     & freezer plant                 company ASKO,              Listing on WSE
      becomes a
                                        in Valjevo,                     Sweden
public company, listing
                                          Serbia
        on the
   Ljubljana Stock
       Exchange

                                                                                                              2014
                                                                                                       Positive effects of
                                                                                                         restructuring

     (…)

                                                    2008                                            2012
                                              Acquisition of the                             Restructuring
                                               company ATAG,                                  of production
                     2005                      the Netherlands             2010            facilities and sales
                Acquisition of                                      IFC, a member of      organization begins,
              the Chech cooking                                      the World Bank,      disposal of furniture
                  appliances                                       enters the ownership      manufacturing
           manufacturer Mora Moravia                                     structure               business
    3              www.gorenjegroup.com
Presentation of the Gorenje Group for Investors - Erste Group Investor Conference 2015
Significant Group Revenue Growth

                           +21%

                                  EUR 1.225m

              EUR 1.015m

                2005              B2015
4   www.gorenjegroup.com
Presentation of the Gorenje Group for Investors - Erste Group Investor Conference 2015
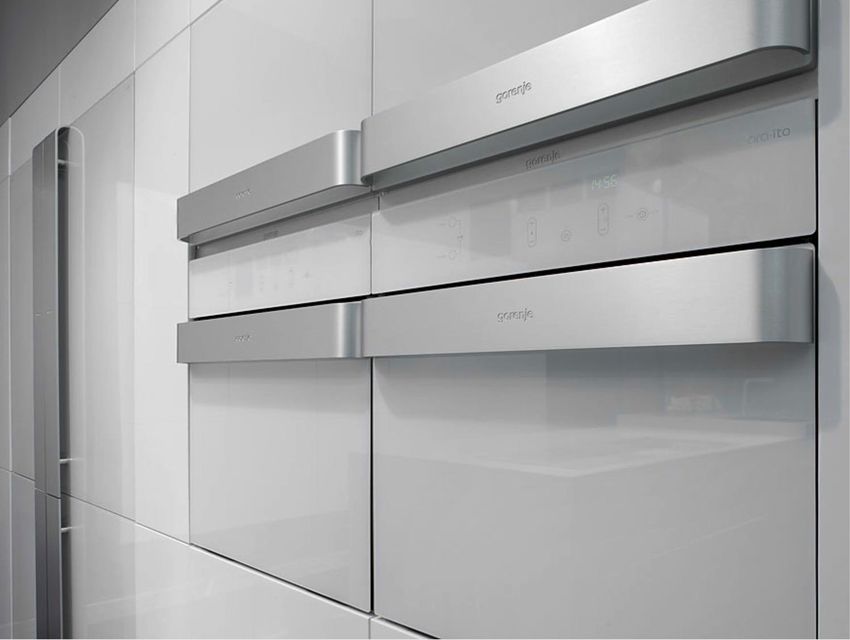
Revenue Growth also in Home Business
    Segment

                           +13%        EUR 1.043m
                            EUR 980m
        EUR 895m

         2006               2010       B2015
5   www.gorenjegroup.com
Ownership Structure
    More than 50% of foreign shareholders

    KAD            IFC      Panasonic   KDPW        Other       Individuals   Employees Treasury
    16.37%         11.80%   9.50%       Fiduciary   financial   13.10%        3.26%     Shares
                                        account     investors                           0.50%
                                        8.05%       37.42%

6   www.gorenjegroup.com
Business Model

                                                              FOCUS
                                                             IN HOME

                                                         DIFFERENTIATION
                                                         THROUGH DESIGN
                                                            INNOVATION

                                                                           STRATEGIC
                                          GLOBALIZATION                    ALLIANCES

                                                    SUSTAINABLE VALUE
                                                       CREATION FOR
                                                                                         BRAND /
                              INTERNATIONALLY         SHAREHOLDERS,                     PRODUCT
                                   DRIVEN             EMPLOYEES AND                    PORTFOLIO
                                                        CUSTOMERS
                               RESEARCH AND                                             NICHES
                               DEVELOPMENT

                 INDUSTRIAL                                             SCALE &
                 KNOW-HOW                       DESIGN                 FLEXIBILITY                 CULTURE

                                         OPERATIONAL EXCELLENCE

7   www.gorenjegroup.com
Brands
    GLOBAL BRANDS                        LOCAL BRANDS

                                                  (Benelux)
                           PREMIUM

                                                   (Benelux)

                             MID

                                      (Nordic)      (Benelux)
                           BUDGET

                                     (E Europe)     (SE Europe)

8   www.gorenjegroup.com
Global brand
(mid and high-mid price segment, design
lines)
MDA and SDA brand
70 % of  MDA revenue
      www.gorenjegroup.com

Majority of revenue: Germany, Russia, SEE, Scandinavia
Global premium brand
                       Sales: EUR 100 m

                       Main markets: USA, Australia, Scandinavia,
                       Russia, Asia (selected markets)

                       Short-term: extend product portfolio and
                       strengthen position on key markets

                       Mid-term: expand to new markets

www.gorenjegroup.com
Business Segments

                            % in revenue 2014:                 86%   14%

                               CORE BUSINESS                               PORTFOLIO
                                Products and                               investments
                                 services for
                                    home

                                                                           Ecology
                                     MDA                                      •
                        (major domestic appliances)                     Tool making
                                                                              •
                                        •                               Engineering
                                     SDA                                      •
                        (small domestic appliances)                   Hotel and catering
                                        •                                     •
                                    HVAC                                    Trade
                    (heating, ventilation, air conditioning)

11   www.gorenjegroup.com
Production Facilities in 3 countries

     Slovenia
     Velenje                                  13%
     Czech Republic
     Mariánské údolí
                                       52%
     Serbia
     Valjevo, Stara Pazova, Zaječar

     • Lowest labour costs
     • Favourable customs conditions         35%
       to Russia

12   www.gorenjegroup.com
Most Important Markets:
     Germany, the Netherlands and Russia
     GERMANY
     RUSSIA
     THE NETHERLANDS
     CZECH REPUBLIC
     SERBIA
     SCANDINAVIA
     (DK, FI, NO, SE)
     SLOVENIA
     CROATIA
     AUSTRALIA
     USA

     UKRAINE
     BIH
     AUSTRIA
     HUNGARY
     POLAND
     BELGIUM
     BIH
     ROMANIA
     SLOVAKIA
     BULGARIA
     MENA REGION
     GREAT BRITAIN
     MONTENEGRO

13   www.gorenjegroup.com
Strategic Alliance with Panasonic
                                            LONG-TERM STRATEGIC ALLIANCE

                         BUSINESS ALLIANCE                                 CAPITAL ALLIANCE
      R&D – joint development projects: (new washing              Panasonic - a minority shareholder in Gorenje
                            machines)                                                     •
     Production: Increased production capacity utilization;     Standstill agreement - Panasonic not to increase its
             Exchange of manufacturing know-how                                stake in share capital
      Sales: Possibility of joint sales-distribution channels                   above 13% till 2018
     Strategic cooperation expanded to new business
           segments: (a) procurement of materials &
         components, (b) manufacturing innovation, (c)
        consumer (aftersales) services, (d) logistics, (e)
      quality assurance, (f) distribution of major and small
            domestic appliances on selected markets

                                 GORENJE BENEFITS FROM THE STRATEGIC ALLIANCE

                                              Better absorption of fixed costs
                                                             •
                                                Improved capital structure
                                                             •
                                        Accelerated investment and R&D activities
                                                             •
                                          Better access to new financial sources
                                                             •
                                 Additional annual revenues of up to EUR 80 m by 2018
            www.gorenjegroup.com
                                                             •
14
                       Gradual improvement of EBITDA of up to EUR 20 m on a yearly basis by 2018
Lowering of gross financial debt

       EUR 483m

                              EUR 397m

                                           EUR 343m

       2010                    2013        B2015
     Optimization of net working capital
15
     Divesting          activities
     www.gorenjegroup.com

     Business performance (EBITDA)
2014
     was the year of
                1. unstable business environment
                •   Ukrainian and Russian crisis
                •   exchange rates volatility
                •   unstable environment in Asia

                2. improved profitability
                •   revenue growth
                •   positive effects of manufacturing restructuring in 2012-2013
                •   better management of raw and processed material costs

                3. greater financial strength
                •   better working capital management
                •   lower net debt
                •   improved maturity profile

                4. strategic partnership with Panasonic

                5. development of new markets and business cooperation
                •   cooperation with the company SubZero in the US
                •   development of the Asko brand
                •   development of innovative appliances for own brands
                •   faster growth in overseas markets

16   www.gorenjegroup.com
2014: Core Financial Indicators
                                            2014
         Group's revenue: EUR 1,245.6m (+0.4%)
         Home revenue: EUR 1,065.9m (+0.1%); organic growth +3.8%
         EBITDA: EUR 86.5m (+10.6%); EBITDA margin: 6.9% (+0.6 p.p.)
         EBIT: EUR 43.5m (+19.8%); EBIT margin: 3.5% (+0.6 p.p.)
         Profit for the period: EUR 1.2m (EUR +26.2m); 2013 loss: EUR -25.0m

      EURm                                             2013      2014    Index

     Revenue                                         1,240.5   1,245.6   100.4
     EBITDA                                             78.2      86.5   110.6
          EBITDA margin (%)                            6.3%      6.9%         /
     EBIT                                               36.3      43.5   119.8
          EBIT margin (%)                              2.9%      3.5%         /
     Profit or loss before tax                         -18.6       4.9        /
     Profit or loss without discontinued operation     -14.4       2.2        /
     Profit or loss of discontinued operation          -10.6      -1.0     9.4
     Profit or loss for the period                     -25.0       1.2        /

17   www.gorenjegroup.com
H1 2015
     1.   Further unstable business environment
          • Macroeconomic and political instability: Russia, Ukraine, Asia.
          • Political and economic events and developments around Greek debt crisis.
          • Exchange rate fluctuations USD / EUR / RUB.
     2.   Concentration of competition in other European markets due to
          loss of sales in Russia and Ukraine (price pressure) - however,
          Gorenje managed to increase average prices by +1%.
     3.   Q2 saw a significant improvement in operating activities in the
          Home segment:
          •   +11% (EUR +25m) Q2 2015 / Q1 2015 revenue growth
          •   June was the strongest month in 2015
          •   Good sales structure in June (ASKO, East Europe, CIS)
          •   Sales volume in H1 is in line with expected annual dynamics.
     4.   Without Russia and Ukraine, revenues equal H1 2014 (and in line
          with the business plan).
     5.   Enhancing the strategic partnership with Panasonic corporation.

18        www.gorenjegroup.com
H1 2015
     6.     Development of innovative appliances and business
            partnerships: SZW, GE, Felix Storch, Franke; development of the Asko
            brand; development of innovative products for own brands.
     7.     Cost and process optimization:
            • Timely purchase of material and raw materials on global markets;
            • Higher supply of components from low-price countries;
            • Optimizing costs of material in production;
            • Lower costs of services (mostly logistics);
            • Limited adjustment of employee benefits expense (lower average number of
              employees);
            • Projects related to improving business process productivity.
     8.     Group loss of EUR -6.9m.
     9.     Higher seasonal debt: management of working capital; planned growth of
            indebtedness, comparable with H2 2014; improved maturity structure of
            sources of financing.

19        www.gorenjegroup.com
H1 2015: Core Financial Indicators

              •      Revenue in Q2 2015 achieved an 11% growth compared to Q1
                     2015.
              •      Revenue in H1 2015 comply with the planned dynamics.
              •      Major impact of USD strengthening on the Group‘s margin
                     (EUR -4.8m).
                                          Q2       Q2      Index    H1       H1      Index     Plan     Plan
     EURm
                                         2014     2015             2014     2015               2015    track
     Revenue                              312.0    289.8    92.9    604.7    557.8    92.2   1.224.1    45.6
     EBITDA                                22.0     17.9    81.3     42.4     33.7    79.4      91.4    36.8
        EBITDA margin (%)                 7.1%     6.2%        /    7.0%     6.0%        /     7.5%        /
     EBIT                                  11.3      6.3    55.4     21.1     10.7    50.8      41.7    25.8
        EBIT margin (%)                   3.6%     2.2%        /    3.5%     1.9%        /     3.4%        /
     Profit or loss before tax              2.7     -4.6       /      4.8     -5.3       /       9.3       /
     Profit or loss for the period          2.1     -4.8       /      3.1     -6.9       /       6.1       /
      ROS (%)                             0.7%    -1.7%        /    0.5%    -1.2%        /    0.5%         /
     Net financial debt                   404.2   408.3    101.0    404.2   408.3    101.0    321.0    127.2
     Net financial debt / EBITDA            4.9      5.3       /      4.9      5.3       /      3.5        /

20                www.gorenjegroup.com
H1 2015: Business Performance

      Sales growth: Czech Republic, Slovakia,
        Poland, Hungary, Slovenia, Bosnia and
        Herzegovina, Macedonia, Bulgaria, Romania,
        the Netherlands, Australia

      Drop in sales: Russia, Ukraine, Germany,
        Scandinavia, Great Britain, North America
        (SZW)

21     www.gorenjegroup.com
H1 2015: Business Performance

            Growth of sales volume innovative appliances
             within the sales structure to: 7.8% (+1.1 p.p.)
            Increased share of sales volume premium
             appliances in the sales structure to: 16.6%
             (+0.1 p.p.)
     Innovative appliances
     … are appliances within individual group of products with the so-called
     »innovative functionalities« which are more energy efficient (efficient storage,
     lower energy and water consumption).
     Premium appliances
     …are appliances of Atag and Asko brands, appliances from the Gorenje
     Design lines (Gorenje Simplicity, Gorenje Ora Ito, Gorenje Pininfarina,
     Gorenje Classico, Gorenje One, Gorenje Karim Rashid, Gorenje Color edition,
     Gorenje +, Gorenje Retro).
22          www.gorenjegroup.com
H1 2015: Effects of foreign exchange rate fluctuations
     ► The impact of exchange differences in Eastern Europe was accompanied by the higher than
       planned loss of sales due to Russia (EUR -28m partly also due to the exchange rate)
     ► Without considering other categories (i.e. exchange rate hedging, adjusting prices to markets,                   Exchange
       product structure, etc.), the impact of foreign currency fluctuations on the Group's organic growth in
       revenue in key markets was as follows:
                                                                                                                            rate
                                                                                                                        differences

                                                                 Actual revenue H1
                                Currency                                                   Actual       Actual
            Home                               Actual revenue     2015 valued at                                    Organic
                               impact on                                                  revenue       growth
            in EURm                               H1 2015        exchange rate H1                                  growth (%)
                                revenue                                                   H1 2014         (%)
                                                                        2014

            West                        -0.3           219.5                    219.8        226.3        -3.0%          -2.9%

            East                       -13.1           201.7                    214.8        224.1       -10.0%          -4.1%

            Other                       2.0              51.6                     49.7         59.1      -12.6%        -15.9%

            TOTAL                     -11.4         472.8                    484.3 509.5 -7.2% -5.0%
          While calculating the impacts of foreign currency fluctuations on the sale's organic growth, we take into account revenue
          generated in the local currency in H1 2015, which are evaluated with the average exchange rates achieved in each
          currency in H1 2014. The calculated revenue in EUR is thereupon compared with the actual generated revenue in EUR
          recorded in the observed period
23             www.gorenjegroup.com
Q2 2015: Investment-related activities

               • In the adopted 2015 business plan, Gorenje Group investments
                 were for Q2 2015 budgeted at EUR 23.9m; actual investments
                 amounted to EUR 20.8m, which is EUR 3.1m less than planned.
               • Investments were consistent with the agreement on
                 adjustment of CAPEX to actual sales.

                                      30.0                                             9.0%
                                                                                       8.0%
                                      25.0
                                                                                       7.0%
                                      20.0                                             6.0%
                                                                                       5.0%
                                      15.0
     mio EUR

                                                                                       4.0%
                                      10.0                                             3.0%
                                                                                       2.0%
                                       5.0
                                                                                       1.0%
                                       0.0                                             0.0%
                                              Q1     Q2     Q3     Q4     Q1     Q2
                                             2014   2014   2014   2014   2015   2015
               Home                           9.3   10.6    9.1   24.8    7.7   18.5
               Portfolio                      2.1    1.0    2.3    2.4    1.6    2.3
               CAPEX margin, %               3.9%   3.7%   3.7%   8.0%   3.5%   7.2%
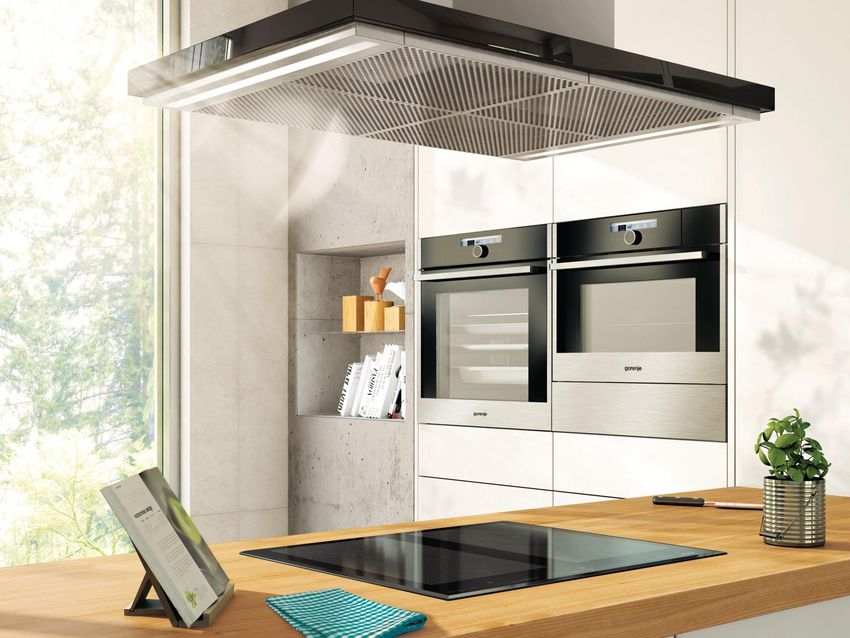
24             www.gorenjegroup.com
H1 2015: Development & new products

                                             Key innovations:
                                                a new generation of built-in
                                                 ovens under the Gorenje
                                                 brand that were launched on
                                                 most of the markets,
                                                the new Essential washing
                                                 machine,
                                                preparation for launching the
                                                 new Magna premium
                                                 collection of cooking
                                                 appliances,
                                                preparation for launching the
                                                 new collection of appliances
                                                 Gorenje by Starck, designed
                                                 by Philippe Starck,
                                                preparation for launching the
                                                 new collection of appliances
                                                 Gorenje Infinity
                                            Increased investments in R&D,
                                            which account for 2.9% in the
                                            Group’s revenue structure (+0.6
     www.gorenjegroup.com
25
                                            p.p.).
H1 2015: Average number of employees
     • The average number of employees in H1 2015 was by 175 lower than in H1 2014

          Total:                10,462 10,253 10,584 10,444 -1.3% 10,549 10,324         10,523 10,348   -1.7%
                     12,000
                     10,000
                      8,000
                      6,000
                      4,000
                      2,000
                           0
                               Q1        Q1      Q2      Q2             Q3      Q4        H1      H1     
                              2014      2015    2014    2015      %     2014    2014      2014    2015    %
                    Home      9,037     8,830   9,144   9,008   -1.5%   9,102   8,888     9,091   8,919 -1.9%
                    Portfolio 1,425     1,423   1,440   1,436   -0.3%   1,447   1,436     1,432   1,429 -0.2%

              H1 2015: 10,348 employees (-175) :
                   The number of employees was partly adjusted to the lower sales
                     volume in production companies (in the parent company, in Mora
                     and in Valjevo, Serbia) and also in individual companies within the
                     Home segment (Scandinavia, Russia, Croatia, and Ukraine).
              Portfolio investments: The number of employees was kept on the same
               level.
26       www.gorenjegroup.com
H1 2015: Revenue by business segment

                       700.0
                       600.0
     EURm

                       500.0
                       400.0
                       300.0
                       200.0
                       100.0
                         0.0                                                                            
                              Q1          Q1      Q2      Q2          Q3       Q4        H1       H1
                                                                 %                                      %
                             2014        2015    2014    2015        2014     2014      2014    2015
                   Home      244.4       224.0   265.1   248.8 -6.2% 273.1    291.4     509.5   472.8 -7.2%
                   Portfolio 48.3        44.0    46.9    41.0 -12.5% 37.2     47.3      95.2     85.0 -10.7%

              100%
               90%                                                                     Lower revenue
               80%
               70%                                                                      generated through the
               60%                                                                      sale of coal and the
               50%
               40%                                                                      changed dynamics in the
               30%                                                                      medical-related field of
               20%
               10%                                                                      business and from
                0%                                                                      machine and tool
                      Q2 2014         Q2 2015             H1 2014   H1 2015
            Portfolio 15.0%            14.1%               15.7%     15.2%              manufacture.
            Home       85.0%           85.9%               84.3%     84.8%
27             www.gorenjegroup.com
H1 2015: EBIT /  EUR 10.4m or -49.2%

                                       25.0                 3.6%                     3.4%              3.5%                4.0%
                                              3.3%                                          3.2%
                   EBIT                                                                                                    3.5%
                                       20.0
                  Margin                                                                                                   3.0%
                                                                    2.2%                                         1.9%      2.5%

                                EURm
                   (%)                 15.0
                                                     1.7%                                                                  2.0%
                                       10.0                                                                                1.5%
                                        5.0
                                                                                                                           1.0%
                                              9.8    4.4    11.3     6.3             10.5   10.9        21.1     10.7      0.5%
                    EBIT                0.0                                                                                0.0%
                  (EURm)                       Q1     Q1     Q2      Q2               Q3     Q4         H1        H1
                                              2014   2015   2014    2015             2014   2014       2014      2015

                                                                                             EBIT H1 2014                         21.1
 Contribution margin: EUR-16.4m 
  Impact of Russia (EUR -4.7m),                             Contribution margin at the       -16.4
  Impact of USD/EUR on margin (EUR -4.8m)                   level of cost of goods and
 Cost of services: -7.1% (EUR -7.3m)                      material                                                 7.2
  adjustment of logistics costs in relation to the          Cost of services
  lower volume.                                                                                                0.9
 Employee benefits expense: EUR -0.9m                     Employee benefits expense
                                                                                                      -1.6
  Rigid labour legislation in Slovenia - partial
                                                            Amortisation and depreciation
  adjustment to lower revenue                                                                                  0.3
                                                            expense
 Other operating income: Decreased due to
  lower amount of subsidies received, and lower             Other operating expenses                  -0.8
  income generated on reversal of provisions.
                                                            Other operating income           EBIT H1 2015               10.7

   28              www.gorenjegroup.com
H1 2015: EBITDA /  EUR 8.7m or -20.6%

                          50.0   7.0%            7.1%               6.9%               7.0%            8.0%
     EBITDA                                             6.2%               6.4%                 6.0%   7.0%
                                         5.9%
     Margin               40.0                                                                         6.0%

                  EURm
       (%)                30.0                                                                         5.0%
                                                                                                       4.0%
                          20.0                                                                         3.0%
                          10.0                                                                         2.0%
                                 20.4     15.8   22.0   17.9        21.5   21.7        42.4     33.7   1.0%
     EBITDA                0.0                                                                         0.0%
     (EURm)                       Q1      Q1      Q2     Q2          Q3     Q4          H1       H1
                                 2014    2015    2014   2015        2014   2014        2014     2015

                                                              Negative result from financing
                                                               activities: EUR 16.0m
     H1 2015: Net Result                         Performance  Income tax expense: EUR 1.6m
                                                               (current and deferred income tax).

                           4.0                                                         3.1             1.0%
      ROS                                        2.10.7%
      (%)                  2.0   1.0                                0.90.3%                  0.5%      0.5%
                                       0.3%
                           0.0                                                                         0.0%
                   EURm

                                  Q1      Q1      Q2     Q2          Q3     Q4          H1      H1
                          -2.0   2014    2015 2014      2015        2014   2014        2014    2015    -0.5%
                                         -2.1 -0.8%                            -0.8%
                          -4.0                                             -2.8                        -1.0%
       PAT
     (EURm)               -6.0                          -4.8                                           -1.5%
                                                            -1.7%                              -1.2%
                          -8.0                                                                  -6.9   -2.0%
29    www.gorenjegroup.com
H1 2015: Financial performance / indebtedness

                 Gross debt: EUR 438.4m (EUR +6.3m)  result complies with
                  interim seasonal dynamics.
                 Net financial debt: EUR 408.3m (EUR +4.1m)
                 Net financial debt / EBITDA: 5.3 (worsen by 0.4)
                 Cash flows from operating and investing activities: EUR -66.4m;
                  EUR -40.3m in H1 2014
                 Important improvement of debt maturity.
                 Movement of total and net financial liabilities in Q2 for the period 2012-2015* (EURm)
                 and the maturity structure of financial liabilities
     470.0

     460.0
             455.0          456.3                                             100%

                                                                  438.4
                                                                              90%
     450.0

     440.0                         431.3         432.1                        80%
                                                                                      41.1%     41.9%               34.2%
     430.0
                  424.4                                                       70%                         52.2%
                                                                              60%
     420.0

     410.0                                            404.2           408.3   50%

                                                                              40%
     400.0
                                                                              30%
                                                                                      58.9%     58.1%               65.8%
     390.0
                                                                              20%                         47.8%
     380.0
                                                                              10%

     370.0
                                                                               0%

              30.6.2012       30.6.2013           30.6.2014       30.6.2015          30.6.2012 30.6.2013 30.6.2014 30.6.2015
             Total financial liabilities        Net financial liabilities
                                                                                     LT financial debt   ST financial debt
                                            * Accounting aspect
30                   www.gorenjegroup.com
H1 2015: Financial performance

       Investments in net working capital

       EURm                          30 Jun 2012 30 Jun 2013 30 Jun 2014                      30 June
                                                                                               2015
       + Inventories                         255.0              267.5             256.0            248.8
       + Trade receivables                   272.4              228.2             229.1            203.9
       + Other current assets                 51.0               58.1              45.5             45.7
       - Trade payables                     -171.2             -183.3            -189.7           -177.6
       - Other current liabilities           -94.3              -90.5             -86.6            -86.9
       = Net working capital                312.9              280.0             254.3              233.9

     Movement of net working capital in Q2 in the 2012-2015 period (EURm)
     400.0
                       312.9
     300.0
                                            280.0                        254.3                       233.9
     200.0

     100.0

       0.0
                    01/01/2012          01/01/2013                   01/01/2014                   01/01/2015
                                     Net working capital = inventories + trade receivables +other current assets –
31      www.gorenjegroup.com
                                     trade payables – other current liabilities
Key managerial actions in                 2015
      Sales
      • growth                       Asko premium brand development
      • improved sales structure
      Cost cutting                   Strategic partnership with
      • services
      • labour
                                     Panasonic
      • material
      Deleveraging                   Risk Management
      • divestments
      • improved working capital     Organizational structure and
        management
                                     corporate governance
      R&D
      • new products development &
        innovation                   Preparation of the 2020 Strategy
      Processes
      • SCM
      • Complexity
      Projects
      • Lean, TQM, forecasting
32   www.gorenjegroup.com
Thank you
     for your attention.

33   www.gorenjegroup.com
Gorenje Representatives

     Mrs. Jožica Turk                                  Mrs. Bojana Rojc
     Executive Director Risk Management & Assistant    Head of IR
     to Board Member

                                                       T +386 3 899 1345
     T +386 3 899 2352
                                                       M +386 51 351 706
     M +386 41 607 329
                                                       E bojana.rojc@gorenje.com
     E jozica.turk@gorenje.com

                                                       Gorenje, d.d.
     Gorenje, d.d.
                                                       Partizanska cesta 12, SI-3320 Velenje, Slovenia
     Partizanska cesta 12, SI-3320 Velenje, Slovenia
                                                       Slovenia
     Slovenia
                                                       www.gorenjegoup.com
     www.gorenjegroup.com

34          www.gorenjegroup.com
Forward-looking statements
     This presentation includes forward-looking information and forecasts – i.e. statements regarding the future, rather
     than the past, and statements regarding events within the framework and in relation to the currently effective
     legislation on publicly traded companies and securities and pursuant to the Rules and Regulations of the Ljubljana
     Stock Exchange. These statements can be identified by the words such as "expected", "anticipated", "forecast",
     "intended", "planned or budgeted", "probable or likely", "strive/invest effort to", "estimated", "will", "projected", or
     similar expressions. These statements include, among others, financial goals and targets of the parent company
     Gorenje, d.d., and the Gorenje Group for the upcoming periods, planned or budgeted operations, and financial plans.
     These statements are based on current expectations and forecasts and are subject to risk and uncertainty which may
     affect the actual results which may in turn differ from the information stated herein for various reasons. Various
     factors, many of which are beyond reasonable control by Gorenje, affect the operations, performance, business
     strategy, and results of Gorenje. As a result of these factors, actual results, performance, or achievements of Gorenje
     may differ materially from the expected results, performance, or achievements as stated in these forward-looking
     statements. These factors include, without prejudice to any not mentioned herein, the following: Consumer demand
     and market conditions in geographical segments or regions and in the industries in which Gorenje Group is
     conducting its operating activities; effects of changes in exchange rates; competitive downward pressure on
     downstream prices; major loss of business with a major account/customer; the possibility of overdue or late payment
     on the part of the customers; decrease in prices as a result of persistently harsh market conditions, in an extent much
     higher than currently expected by the Gorenje Management Board; success of development of new products and
     implementation in the market; development of manufacturer's liability for the product; progress of attainment of
     operative and strategic goals regarding efficiency; successful identification of opportunities for growth and mergers
     and acquisitions, and integration of such opportunities into the existing operations; further volatility and aggravation of
     circumstances in capital markets; progress in attainment of goals regarding structural reorganization and
     reorganization in purchasing. If one or more risks or uncertainties are in fact materialized or if the said assumptions
     are proven wrong, actual results may deviate materially from those stated as expected, hoped for, forecast, projected,
     planned, probable, estimated, or anticipated in this announcement. Gorenje does not intend to assume and will not
     allow for any liability to update or revise these forecasts in light of development differing from the expected events.

35   www.gorenjegroup.com
You can also read