Introduction to Carvana - June 2018 - Investor Relations | Carvana
←
→
Page content transcription
If your browser does not render page correctly, please read the page content below

Introduction to
    Carvana
   June 2018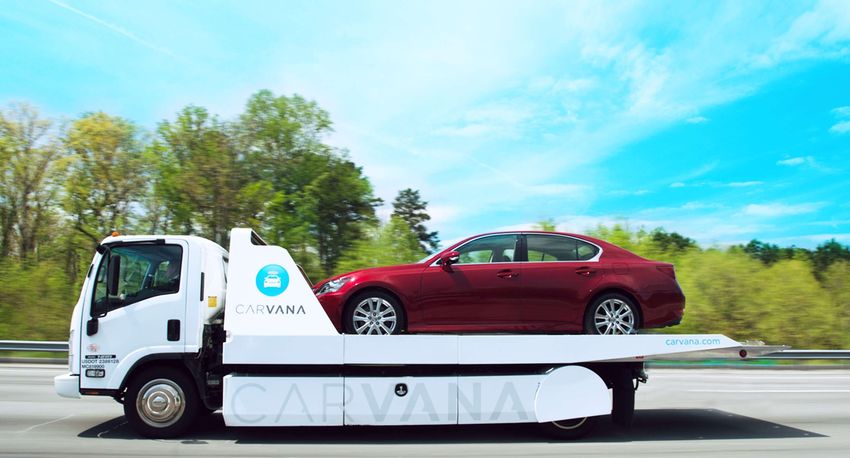
IMPORTANT NOTICE
Forward-Looking Statements
This presentation contains forward-looking statements within the meaning of the Private Securities Litigation Reform Act of 1995. These forward-looking statements reflect                              current expectations and projections
with respect to, among other things, its financial condition, results of operations, plans, objectives, future performance, and business. These statements may be preceded by, followed by or include the words "aim,"
"anticipate," "believe," "estimate," "expect," "forecast," "intend," "likely," "outlook," "plan," "potential," "project," "projection," "seek," "can," "could," "may," "should," "would," "will," the negatives thereof and other words and
terms of similar meaning.

Forward-looking statements include all statements that are not historical facts. Such forward-looking statements are subject to various risks and uncertainties. Accordingly, there are or will be important factors that could
cause actual outcomes or results to differ materially from those indicated in these statements. Among these factors are risks related to the              identified in the            Annual Report on Form 10-K for 2017
and Quarterly Report on Form 10-Q for Q1 2018.

There is no assurance that any forward-looking statements will materialize. You are cautioned not to place undue reliance on forward-looking statements, which reflect expectations only as of this date. Carvana does not
undertake any obligation to publicly update or review any forward-looking statement, whether as a result of new information, future developments, or otherwise.

Non-GAAP Financial Measures
This presentation contains the financial measure EBITDA margin which is not recognized under U.S. Generally Accepted Accounting Principles             . EBITDA margin should not be considered as a substitute for other
measures of financial performance reported in accordance with GAAP. In addition, the             definition of EBITDA margin may not be comparable to similarly titled measures of other companies.
The Company believes that EBITDA margin provides useful information to investors about the Company and its financial condition and results of operations for the following reasons: (i) EBITDA is among the measures
used by the              management team to evaluate its financial and operating performance and make day-to-day financial and operating decisions; and (ii) EBITDA is frequently used by securities analysts, investors and
other interested parties as common performance measures to compare results or estimate valuations across companies in the            industry.
EBITDA has limitations as an analytical tool, and you should not consider this measure either in isolation or as a substitute for gross margin or other methods of analyzing the                      results as reported under GAAP. A
reconciliation of EBITDA to the most directly comparable GAAP financial measure can be found at the end of this presentation.

No Offer
This presentation regarding Carvana shall not constitute an offer to sell or the solicitation of an offer to buy any securities, nor shall there be any sale of these securities in any state or jurisdiction in which such offer,
solicitation or sale would be unlawful prior to registration or qualification under the securities laws of any such state or jurisdiction. Sales and offers to sell Carvana securities will only be made in accordance with the
Securities Act of 1933, as amended, and applicable SEC regulations, including prospectus requirements.

Market and Industry Data
This presentation includes information concerning economic conditions, the             industry, the           markets and the               competitive position that is based on a variety of sources, including information
from independent industry analysts and publications, as well as          own estimates and research.          estimates are derived from publicly available information released by third party sources, as well as data from
its internal research, and are based on such data and the             knowledge of its industry, which the Company believes to be reasonable. The independent industry publications used in this presentation were not
prepared on the              behalf. While the Company is not aware of any misstatements regarding any information in this presentation, forecasts, assumptions, expectations, beliefs, estimates and projects involve risk and
uncertainties and are subject to change based on various factors.
                                                                                                                                                                                                                                               2
OUR MISSION IS
    TO CHANGE THE WAY
    PEOPLE BUY CARS.

5                 5     3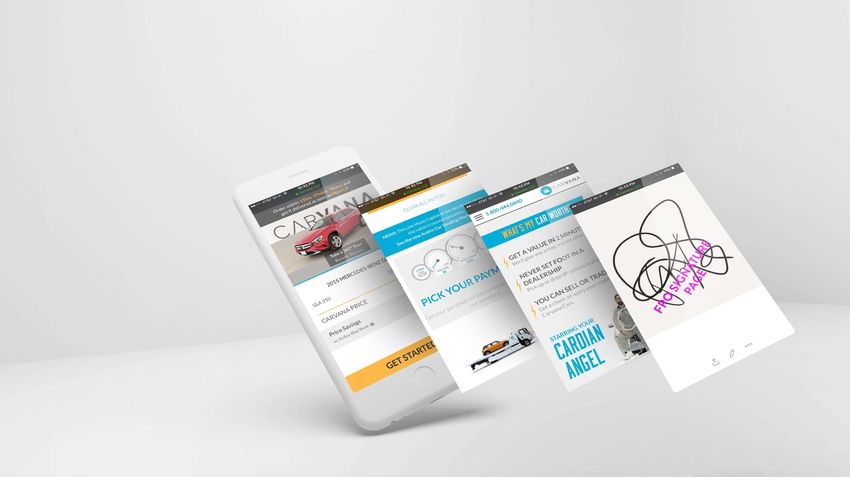
KEY OPERATING METRICS

          SUCCESSFUL EXECUTION
                                                                56
                                                                                                                       44,252
            TOTAL MARKETS                (1)
                                                         44
                                                                                          RETAIL UNITS                                            GROSS PROFIT                                    $1,854
                                         110% YoY                                         SOLD                                  122% YoY          PER UNIT                            $1,539
                                          Growth                                                                                 Growth
                                                                                                                                                                            $1,023
                                               21                                                             18,761                    18,464

                               9                                                                                                8,334                       $206
                                                                                                      6,523
                3                                                                           2,105                                                 ($201)

              2014          2015           2016        2017 Q1 2018                          2014      2015   2016      2017    Q1 2017 Q1 2018    2014     2015             2016         2017 Q1 2018

                                                                 8
                                                                                                                                                  NET LOSS AND EBITDA MARGIN (2)
                                                                                                                       $859                        2014     2015             2016         2017 Q1 2018
            CAR VENDING                                   7                               TOTAL REVENUE
            MACHINES (1)                250% YoY                                          ($M)                                                                                                    (12.4%)
                                                                                                                                127% YoY
                                         Growth                                                                                                                                       (16.9%)
                                                                                                                                 Growth
                                                                                                                                                                            (23.2%)               (14.6%)
                                                                                                              $365                      $360                (25.0%)                    (19.1%)
                                               2                                                                                                  (32.2%)                   (25.5%)
                                                                                                      $130                       $159                       (28.2%)
                               1
                                                                                             $42
                                                                                                                                                  (36.6%)
              2014          2015           2016        2017 Q1 2018                          2014      2015   2016      2017    Q1 2017 Q1 2018             EBITDA Margin       Net Loss Margin

(1) Markets and Vending Machines as of period end   (2) GAAP Reconciliation of EBITDA included in Appendix
                                                                                                                                                                                                            4
KEY INVESTMENT HIGHLIGHTS
    MASSIVE, FRAGMENTED MARKET
    Exceptionally large and inefficient used car market

    SUPERIOR CUSTOMER EXPERIENCE
    Simple, seamless and differentiated used car buying experience

    PROVEN GO-TO-MARKET STRATEGY
    Demonstrated, capital-light market expansion playbook

    VERTICAL INTEGRATION & FULFILLMENT
    Purpose-built vertically integrated platform

    ROBUST FINANCIAL MODEL
    Robust financial model supports growth and margin expansion

                                                                     5
MASSIVE, FRAGMENTED MARKET

          INDUSTRY OVERVIEW

                                                                                     Massive                                             Fragmented                                      & Ripe for Disruption

                                                                                                                                    43,000+
                                                                                                                                     Used Car
                                                                                                                                   Dealerships (7)

                         $1.2 Tn                                               $764 Bn                                                      1.8%                                                      81%
                         in 2017 U.S. Sales (1)                             in 2017 U.S. Used Car Sales (2)                             U.S. Market Share of                                   Consumers Do Not Enjoy
                                                                                                                                       Largest Dealer Brand (2)                                the Car Buying Process (5)

                              21%                                                    2.0%                                                   7.0%                                                       8%
                      of U.S. Retail Economy (1)                                2017    2022 CAGR (3)                                Aggregate Market Share of                           Consumers Rated Car Salespeople
                                                                                                                                   Top 100 Used Auto Retailers (4)                            Highly Trustworthy (6)
(1) U.S. Census Bureau 2017 Retail Sales by Industry       (2) Edmunds.com 2017 Used Vehicle Market report and Publicly-listed dealership filings   (3) Technavio 2017 U.S. Used Car Market report
(4) Publicly-listed dealership filings and Automotive News Top 100 Dealership Groups      (5) DealerSocket 2016 Independent Dealership Action report Represents North American consumers (6) 2015 Gallup Poll   (7) Borrell Associates   6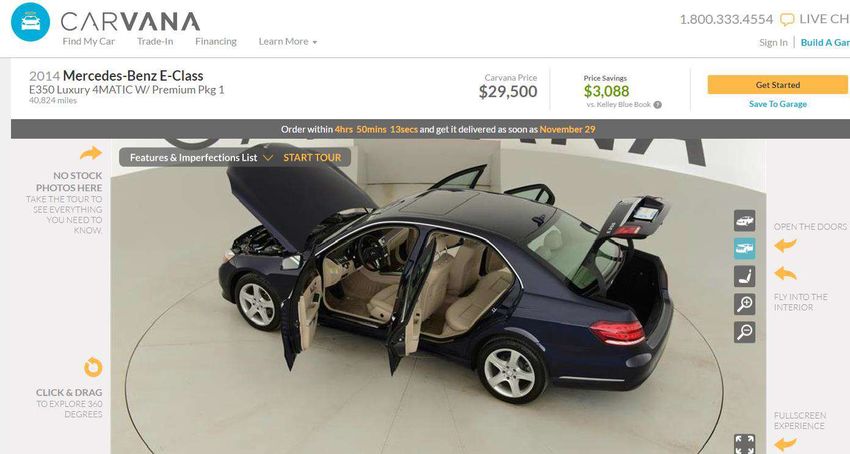
MASSIVE, FRAGMENTED MARKET

   DIGITAL ECONOMY IS
   TRANSFORMING CAR BUYING

                                                  %                                                                           %                %
                       of customer                                                                         would                      test drive
                       purchases                                                                           consider                   only one
                       involve online                                                                      purchasing                 vehicle (3)
                       research (1)                                                                        a car online (2)

(1) Capgemini 2014 Cars Online report   (2) Accenture 2015 Automotive Digital Survey   (3) AutoTrader 2016 Car Buyer Journey report                 7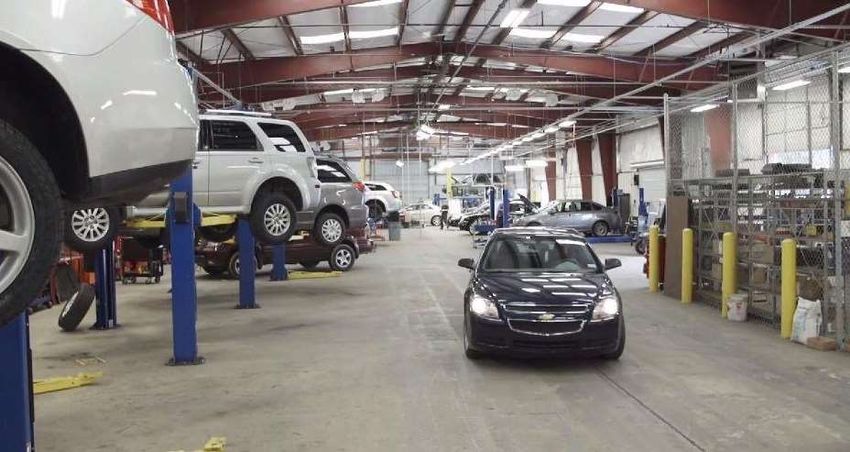
SUPERIOR CUSTOMER EXPERIENCE

  CARVANA'S VISION IS FOCUSED
  ON PROVIDING OUR CUSTOMERS WITH:

             Best
             Experience                                                                                                      Best
             10 minutes time in                                                                                              Value
             which purchase can be                                                                                           $1k+ in average savings
             completed after vehicle                                                                                         per vehicle compared
             selection                                                                                                       to traditional dealers
             As soon as Next Day
             car deliveries in select
             markets
                                                                                            Best
                                                                                            Selection
                                                                                            11,000+
                                                                                            cars available
Note: 11,000+ vehicles available and $1k+ in average selling price savings vs. traditional dealers are as of June 11, 2018
                                                                                                                                                       8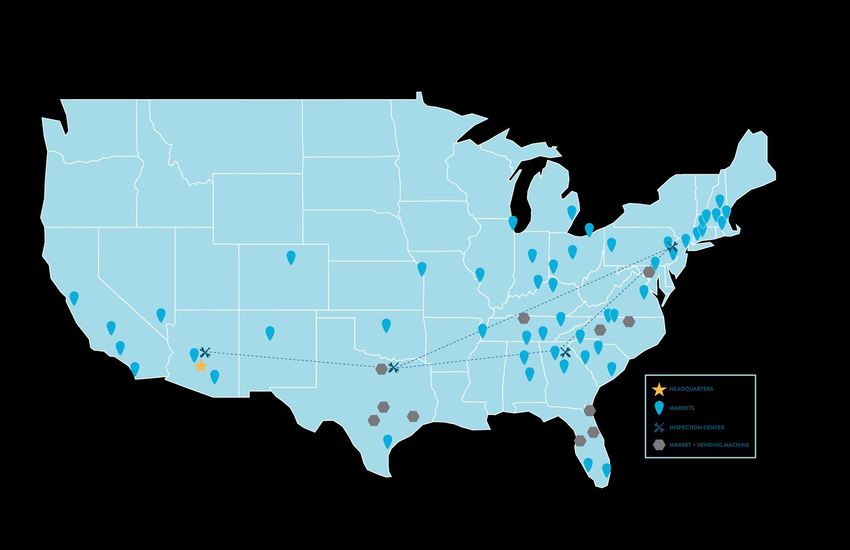
SUPERIOR CUSTOMER EXPERIENCE

    A SIMPLE AND SEAMLESS
    CAR BUYING EXPERIENCE

          Vehicle Search &
Discovery From Any Device
         Intuitive vehicle search with
    11,000+ vehicles available online

  Trade or Sell               All Online
     Nearly instantaneous, firm, fully
           automated trade-in offers

   Real-Time, Personalized
                Financing
          Majority of customers have
      chosen to finance with Carvana

         Seamless Transaction
                  Technology
                          Buy a car without
                        leaving your device

  Note: 11,000+ vehicles available as of June 11, 2018
                                                         9
SUPERIOR CUSTOMER EXPERIENCE

        CREATING DIFFERENTIATED
        FULFILLMENT EXPERIENCES

                                        Carvana Delivery

                                        delivery as soon as the next day
                                        in our markets
                                                               -uniformed
                                        employee in a branded, custom
                                        single-car hauler, in our markets

                                        Vending Machine
                                         with strong branding
                                        11 vending machines currently operational (1)
                                         x+ growth in Nashville market penetration within
                                        two quarters after vending machine launch

                                        customers to share via social media

(1) As of June 11, 2018                                                                     10
SUPERIOR CUSTOMER EXPERIENCE
DELIVERING SUPERIOR
CUSTOMER EXPERIENCES
4.7 17,000+ 95% 84
Rating (1) Customer Would Recommend Net Promoter Score
Reviews on To A Friend (1) (NPS) (2)
Carvana.com (1)
Carvana will I never
change the way Carvana thought car
cars are sold. is the bomb! buying could
be enjoyable.
(1) Through June 11, 2018 (2) Survey performed by Bazaarvoice as of June 11,2018 11GROWING UNITS & REVENUE
PROVEN EXPANSION STRATEGY
Enabling Rapid Expansion of
Repeatable Market Entry Playbook Operating Markets Proven by Success in Our Markets
2.00% Market Penetration by Cohort
56
Activate Team of
Expansion Advocates 1.54%
44
1.50%
Market Launch CapEx Spend
EST. MARKET PENETRATION
$500k for initial delivery-only program
1.00%
Average of $5M for vending machine
launch
0.72%
21 0.58%
Connect to 0.50%
Logistics Network
9 0.19%
0.04%
Turn on Marketing
3 --
1 2 3 4 5 6 7 8 9 10 11 12 13 14 15 16 17 18 19 20
Program 2013 Cohort
QUARTERS IN OPERATION
2014 Cohort 2015 Cohort 2016 Cohort 2017 Cohort
2014 2015 2016 2017 Q1 2018
12VERTICAL INTEGRATION & FULFILLMENT
SUPPORTED BY PROPRIETARY VEHICLE
ACQUISITION ALGORITHM
Auctions Off-Lease Customer
Off-Rental Trade-In
Vehicle Inventory Acquisition
11,000+ Online cars available in all
Auctions & Manheim, Adesa, Smart Auction
markets vs. 11-100 at typical dealers (1)
Enterprise, Hertz
Other Sources Customers
Quality Year, Mileage, No Reported Accidents
Screening
Vehicle reporting
Apply Data Market data
Carvana data (clickstream, historical sales)
Expected pricing, recon, and transport
Optimization Fit with existing inventory
(1) 2016 NIADA Used Car Industry report based on 2015 data
Note: 11,000+ vehicles available as of June 11, 2018 13VERTICAL INTEGRATION & FULFILLMENT
IN-HOUSE INSPECTION,
RECONDITIONING & MERCHANDIZING
Inspection and Reconditioning Photography and Annotation
Ability to buy all car types and recondition 360-degree, interactive exterior and
them to a consistent car quality interior virtual tour of each vehicle
~200k existing annual IRC capacity at full utilization* Proprietary imaging technology
Robust processes and internal expertise Transparency to the customer through
to set up future IRCs as needed annotation of material defects
*Based on 4 IRCs in operation as of December 31, 2017 14VERTICAL INTEGRATION & FULFILLMENT
BACKED BY IN-HOUSE LOGISTICS NETWORK
Premium
June 2018 Fulfillment
Capabilities
Control over delivery
times enables seamless
customer experience
Speed of delivery
drives conversion
Centralized
Carvana inventory powers
broad selection
Logistics
Network Enables vehicle
& reconditioning centers cost arbitrage
across geographies
/ Fulfillment centers
Connected through the hub-and-spoke
Carvana Logistics Network Lower cost than using
third party shipping
Note: As of June 11, 2018. 15GROWING UNITS & REVENUE
RAPID SECULAR GROWTH
$360
18,464
Revenues $859 Retail Units 44,252
($M) 135% YoY Sold 136% YoY
$265
13,517
$225
11,719
$209
10,682
$159
8,334
$365 18,761
5,600
$107
5,023
$99
4,355
$130 6,523
$87
3,783
$73
2,192
$42 2,105
$43
1,776
$36
1,343
$29
1,212
$24
$14
775
$12
579
436
315
$9
$6
Q1 Q2 Q3 Q4 Q1 Q2 Q3 Q4 Q1 Q2 Q3 Q4 Q1 Q2 Q3 Q4 Q1 Q1 Q2 Q3 Q4 Q1 Q2 Q3 Q4 Q1 Q2 Q3 Q4 Q1 Q2 Q3 Q4 Q1
'14 '14 '14 '14 '15 '15 '15 '15 '16 '16 '16 '16 '17 '17 '17 '17 '18 '14 '14 '14 '14 '15 '15 '15 '15 '16 '16 '16 '16 '17 '17 '17 '17 '18
16EXPANDING GPU & OPERATING MARGINS
GROWTH LEVERAGING UNIT ECONOMICS
Gross Profit Key Drivers of Gross
per Unit Profit Expansion
$1,854 Increase number of markets /
Sell more retail units
$1,539
Reduce average days to sale
CarMax, Inc.
$1,023
Gross Profit
Increase conversion
on existing products
per Unit
$206 ~$3,811 (1)
Addition of new products
and services
($201)
2014 2015 2016 2017 Q1 2018 Scale provides cost of sales
efficiencies
(1) FY2018 Gross Profit plus CarMax Auto Finance net income divided by used vehicle units sold; Note: CarMax Gross Profit per Unit is not presented to imply that Carvana will achieve comparable results
17EXPANDING GPU & OPERATING MARGINS
GROWTH SHOWING OPERATING LEVERAGE
EBITDA MARGIN (1) ADVERTISING EXPENSE PER UNIT SOLD
$14,000
2014 2015 2016 2017 Q1 2018
$12,000
(12.4%)
$10,000
CUSTOMER ACQUSITION COST
(16.9%)
$8,000
$6,000
(23.2%)
(25.0%) $4,000
$3,749
$2,000 $2,060
$942
$916 $440
(32.2%)
--
1 2 3 4 5 6 7 8 9 10 11 12 13 14 15 16 17 18 19 20
QUARTERS IN OPERATION
2013 Cohort 2014 Cohort 2015 Cohort 2016 Cohort 2017 Cohort
(1) GAAP Reconciliation of EBITDA included in Appendix
18POSITIVE FEEDBACK LOOP
SUPPORTS GROWTH
Improving Cash Burn on New Market Launches
OPEN NEW
MARKETS
LOWER
TURN TIMES CACx CACx+n GPUx GPUx+n
BETTER MARKET GROW
ECONOMICS SELECTION Reducing Time to Cash Generation
RAISE
GPU
RAISE
CONVERSION
* Graphs are conceptual and do not necessarily reflect actual data. 19PHASES OF INVENTORY STRATEGY
1 2 3
Selection Drives Conversion
INVENTORY
TURN TIME
Conversion
GPU
Inventory
* Graphs are conceptual and do not necessarily reflect actual data.
SALES 20COMPETITIVE ADVANTAGES
INTEGRATION CREATES COMPETITIVE
ADVANTAGES
NATIONAL CONSUMER
FOCUSED BRAND FULLY TRANSACTABLE
LARGE SCALE E-COMMERCE
RECONDITIONING EXPERIENCE
INTERNAL LOGISTICS PROPRIETARY FINANCING
NETWORK PLATFORM
LEADING FULFILLMENT
EXPERIENCE
21COMPETITIVE ADVANTAGES
SIGNIFICANT UPSIDE
IN THE CURRENT MODEL
Grow Current Markets Add New Markets Increase Penetration
2017 Revenue ($M) 41.2% Q4 2017 ATL YoY Growth
$858.9 44%
1.54%
1.54%
19.7%
9.7%
0.22%
3.1%
1.8%
2013 2014 2015 2016 2017 1 2 3 4 5 6 7 8 9 10 11 12 13 14 15 16 17 18 19 20
Carvana Carvana Carvana Carvana
2017 Market Penetration 4Q17 Total U.S. Population Coverage Atlanta Market Penetration
Across Current Atlanta by Year From 1st Quarter Launched to Q4 2017
44 Markets (1) Market Penetration (2)
(1) Market penetration for year ended December 31, 2017
(2) Market penetration of Atlanta for quarter ended December 31, 2017
22COMPETITIVE ADVANTAGES
SIGNIFICANT GROWTH
OPPORTUNITIES
Develop New
Products
Improve Brand
Awareness
Innovate and
Extend Technology
Leadership
Enter New Key
Geographical
Drive Revenue Markets
Growth in Existing
Markets
23FOUNDER-LED, DEEP & EXPERIENCED TEAM
Ernie Garcia Mark Jenkins
Co-founder & Chief Executive Officer Chief Financial Officer
Ryan Keeton Ben Huston Dan Gill Paul Breaux
Co-founder & Co-founder & Chief Product General Counsel
Chief Brand Officer Chief Operating Officer Officer
eCommerce & Technology Data & Analytics Automotive & Logistics Brand & Customer Experience
Josh Dollison Cem Vardar Richard Ball Paul Keister
Director of Principal Optimization Sr. Director of IRCs & Chief Creative
Engineering Engineer Process Engineering Officer
Jon Seitel Jeff McClellan Mike Rennie Teresa Aragon
Product Head of Predictive Director of IRC Director of
Lead Analytics Execution Customer Operations
Alex Devkar Michael Grantham Scott Wood Jenni Stanford
Director of VP of Quantitative Director of Wholesale Director of Market
Analytics Marketing Operations Operations & Expansion
Imran Kazi Brian Boyd Jeff Miller Jessica Querin
Director of Technology Director of Inventory VP of Strategic Partnerships & Director of Post
Services Strategy Vehicle Merchandising Sales Operations
Christina Keiser Stella Wenxing Liu John Piatak Bret Sassenberg
Director of Partnership Data Director of Sr. Director of Real
Growth Scientist Logistics Estate & Development
24KEY INVESTMENT HIGHLIGHTS
MASSIVE, FRAGMENTED MARKET $764B
2017 U.S.
1.8%
Largest dealer brand
Exceptionally large and inefficient used car market
Used Car Sales (1) market share in US (1)
SUPERIOR CUSTOMER EXPERIENCE
Simple, seamless and differentiated used car buying experience
95%
Customers who would
4.7/5.0
Average Customer
recommend to friend Rating
PROVEN GO-TO-MARKET STRATEGY 63
Markets (3)
1.54%
Market Penetration
Demonstrated, capital-light market expansion playbook in Atlanta (2)
VERTICAL INTEGRATION & FULFILLMENT 4
Existing
11
Existing Vending
Purpose-built vertically integrated platform Machines (3)
IRCs (3)
ROBUST FINANCIAL MODEL 135% 90,000+
Robust financial model supports growth and margin expansion 2017 YoY Retail Units Sold
Revenue Growth (2) Since Inception (4)
(1) Edmunds.com 2017 Used Vehicle Market report and Publicly-listed dealership filings (2) Metrics as of December 31, 2017 (3) Metrics as of June 11, 2018 (4) Metric through March 31, 2018 25APPENDIX
26NET LOSS TO EBITDA RECONCILIATION
2014 2015 2016 2017 Q1 2018
Net Loss ($15,238) ($36,780) ($93,112) ($164,316) ($52,672)
D&A $1,706 $2,800 $4,658 $11,568 $4,605
Interest Expense $108 $1,412 $3,587 $7,659 $3,541
EBITDA ($13,424) ($32,568) ($84,867) ($145,089) ($44,526)
Total Revenues $41,679 $130,392 $365,148 $858,870 $360,442
Net Loss Margin (36.6%) (28.2%) (25.5%) (19.1%) (14.6%)
EBITDA Margin (32.2%) (25.0%) (23.2%) (16.9%) (12.4%)
27You can also read