MCAP GTA & SOUTHWESTERN ONTARIO RESIDENTIAL LAND VALUE MARKET REPORT - Spring 2019 - MCAP.Com
←
→
Page content transcription
If your browser does not render page correctly, please read the page content below
MCAP GTA & SOUTHWESTERN
ONTARIO RESIDENTIAL LAND VALUE
MARKET REPORT
Spring 2019

Thursday, June 6, 2019
Q1 GTA LOW-RISE
                                                                                 MARKET OVERVIEW

HIGHLIGHTS
• MCAP expects sales volume to reach +/- 10,000 units as additional
  projects launch or re-launch “right priced” product. Any
  government policy changes that specifically address affordability,
  for example a downward adjustment to the mortgage stress test
  qualification rate, could accelerate the pace of sales through late
  2019 and 2020.
• Markets like Brampton, Whitby, Milton and Oakville have had their
  reset buttons hit by larger scale production builders and will move
  towards sellers’ market conditions. Minor price increases are
  expected in these markets over 2019. Lot values in these markets
  appear to be at or near bottom and we expect lot values to start
  creeping up as new product enters those markets.
• Other markets specifically in York and Durham (excluding Whitby),              (Sources: RealNet)
  with a larger supply of lots, will take longer to reach balanced               Sales will likely remain localized to select markets and projects
  market conditions as they now sit at 17 months of supply and 22                where larger production style builders have product and are ready
  months of supply respectively. Sales prices, and therefore lot                 to launch at well positioned price points. We are already seeing sales
  values, are expected to dip further in these markets as “right                 traction beginning to take hold in markets like Brampton, Oakville,
  priced” product is released over the next 6 months.                            Milton and Whitby. In these markets, MCAP expects to see sales
NEW HOME SALES                                                                   velocity trend positively throughout 2019 as builders bring more
2019 has shown early signs that it will be a year of transition as sales         product on stream.
volumes in Q1 2019 totalled 2,038 units. This represents the best                Much of the Q1 2019 sales traction has been generated by large scale
quarter for new home sales since Q2 2017 (2,547) and compares                    production builders. Specifically, Mattamy Homes represents 36%
favourably to Q1 2018 which achieved only 927 sales. For further                 of Q1 2019 sales. When combined with sales achieved by Great Gulf
context, Q1 2019 sales represent 53% of total low-rise sales achieved            Homes and Treasure Hill Homes in Q1, these three builders represent
in 2018 (3,831) and 26% of 2017 sales (7,714). MCAP is projecting 2019           a 54% market share for the quarter.
sales of +/- 10,000 units. This projection is still off the average of just
above 16,000 homes per year between 2010 and 2016, but if achieved,
it would still represent a substantial increase over 2017 and 2018
sales volume.

                                                                                                                          Semi-
 Builder                                     Project               Municipality         Detached         Towns                             Q1 Sales
                                                                                                                         Detached
 Mattamy Homes                         Hawthorne South                 Milton               121            170               0                291
 Mattamy Homes                       Mount Pleasant North            Brampton               127             76               0               203
 Mattamy Homes                     East Preserve/Preserve             Oakville              154             56               0                210
 Mattamy Homes                         Queens Common                   Whitby                 6             31               0                31
 Great Gulf                               Arbor Peaks                  Milton                20             19               7                46
 Great Gulf                            Whitby Meadows                  Whitby                53             20               0                73
 Great Gulf                                 Westfield                Brampton                35             0                22               57
 Treasure Hill                            Adena Views                 Aurora                107             0                0                107
 Treasure Hill                         Georgina Heights              Georgina                41             0                0                41
 Treasure Hill                            Trendi Towns               Markham                  0             19               0                19
 Paradise Developments                     High Point                Brampton                 0             49               50               99
 Total                                                                                      664            440               79              1183
 (Sources: RealNet)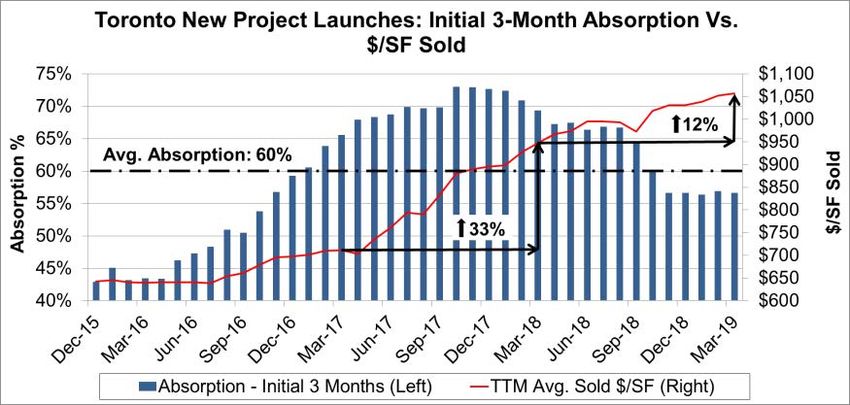
Q1 GTA LOW-RISE
                                                                           MARKET OVERVIEW

These builders have been able to set the markets in which they are         Average asking prices for townhouse product fell slightly over
participating and found price points at which they can generate sales.     the quarter but remained at +/-$900,000. Semi-detached product
Others builders with product in these markets can now assess their         increased back to 2017 levels at +/-$950,000 but represents a very
relative value at launch or re-launch. Moderate price appreciation is      small segment of the market.
expected in these markets over 2019.
Some short term price depreciation is anticipated in other markets
like York and Durham (outside of Whitby) where significant sales
traction has not yet taken place. As homes sold at the peak of the
market in 2017 continue to close in these regions, projects will be able
to re-launch remaining product or launch the next phase of a project
at lower price points. This softening is not expected to last as pent up
demand from historically low sales in 2018 begins to enter the market
fuelled by stable mortgage rates in 2019 and exceptionally high
population growth in Ontario (255,835 people in 2018 and 220,022 in
2017 versus the average from 2006 – 2016 of 95,000 people per year),
the GTA being the largest benefactor of this growth.

NEW HOMES SALE PRICES
The benchmark price of a single family home fell slightly from Q4
2018 to $1,116,640 from $1,143,505. Although the benchmark price has
been hovering just above $1.1MM since early 2018, it is down +/-16%
from its peak in 2017 at just over $1.3MM but remains 8% above Q4          (Sources: RealNet)
2016. This implies single family homes purchased Q1 2017 and earlier
remain in the money while homes purchased at peak values in mid            NEW HOME INVENTORY
to late 2017 through early 2018 represent possible future closing
                                                                           Low-rise lot inventory levels have dropped for the second
risks. Homes purchased in this time frame have begun closing which
                                                                           consecutive quarter since peaking at 5,300 in October 2018, after 6
will continue through early 2020. Based on our experience within
                                                                           straight quarters of increases. Inventory now stands at 5,054 lots,
the MCAP portfolio and conversations with industry experts, some
                                                                           representing a +/- 12 month supply based on the historically low sales
isolated projects are encountering higher than normal closing issues,
                                                                           volume for the prior 12 month period.
but the situation does not appear to be widespread.
Average asking prices for detached homes have remained relatively
flat since early 2018 at +/-$1.4MM. This is down +/-28% from the 2017
peak of +/- $1.9MM. As stated earlier, in the short term we could see
prices come down further as detached homes sold at the peak close
and existing supply is relisted at lower price points.

                                                                           (Sources: RealNet)

                                                                           Compositionally, 49% of the lots are detached lots, 41% are
                                                                           townhouse lots, 9% are semi-detached and 1% of the lots are linked.
                                                                           York currently has a supply of 1,808 lots, Durham has 1,503 lots, Peel
                                                                           has 1,139 lots and Halton has 418 lots.

(Sources: RealNet)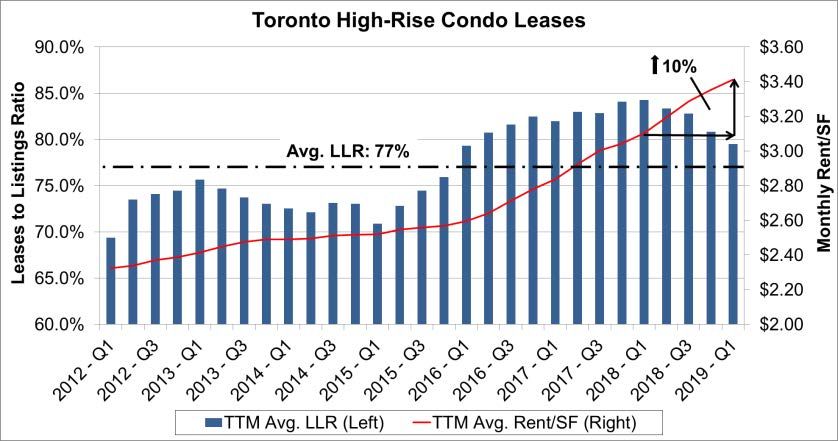
LOT VALUES
                                                                       For the Period Ending June 6, 2019

                                                YORK REGION
 PRODUCT TYPE                   TOWNHOUSE                   30 F.F. to 36 F.F.              40 F.F.

 RICHMOND HILL                $23,000 - $25,000            $22,000 - $23,000           $21,000 - $22,000

 MARKHAM                      $27,000 - $29,000            $21,000 - $23,000           $20,000 - $22,000

 VAUGHAN                      $24,000 - $25,000            $18,000 - $20,000           $17,000 - $19,000

 EAST GWILLIMBURY             $9,000 - $10,000             $8,000 - $10,000            $8,000 - $10,000

                                                PEEL REGION
 PRODUCT TYPE                   TOWNHOUSE                   30 F.F. to 36 F.F.              40 F.F.

 BRAMPTON                     $14,000 - $15,000            $11,000 - $13,000           $11,000 - $12,000

 CALEDON                      $13,000 - $14,000            $12,000 - $13,000           $11,000 - $12,000

                                          DURHAM REGION
 PRODUCT TYPE                   TOWNHOUSE                   30 F.F. to 36 F.F.              40 F.F.

 AJAX                         $13,000 - $15,000             $9,000 - $11,000           $10,000 - $12,000

 WHITBY                       $9,000 - $10,000             $9,000 - $10,000            $9,000 - $10,000

 OSHAWA                        $8,000 - $9,000              $8,000 - $9,000             $8,000 - $9,000

 CLARINGTON                    $7,000 - $8,000              $7,000 - $8,000             $7,000 - $8,000

                                           HALTON REGION
 PRODUCT TYPE                   TOWNHOUSE                   30 F.F. to 36 F.F.              40 F.F.

 OAKVILLE                     $16,000 - $18,000            $16,000 - $18,000           $16,000 - $18,000

 MILTON                       $11,000 - $12,000            $10,000 - $12,000           $11,000 - $12,000

                                                 OUTSIDE GTA
 PRODUCT TYPE                  TOWNHOUSE                  30 F.F. to 36 F.F.               40 F.F.

 KW                           $8,000 - $9,000              $7,500 - $8,500             $6,500 - $7,500

 BARRIE / INNISFIL            $9,000 - $10,000             $6,500 - $7,500             $6,500 - $7,000

 HAMILTON                     $9,500 - $10,500             $7,500 - $8,500             $8,000 - $9,000

 GUELPH                       $7,500 - $8,500              $7,500 - $8,500             $7,500 - $8,500

* Values include all levies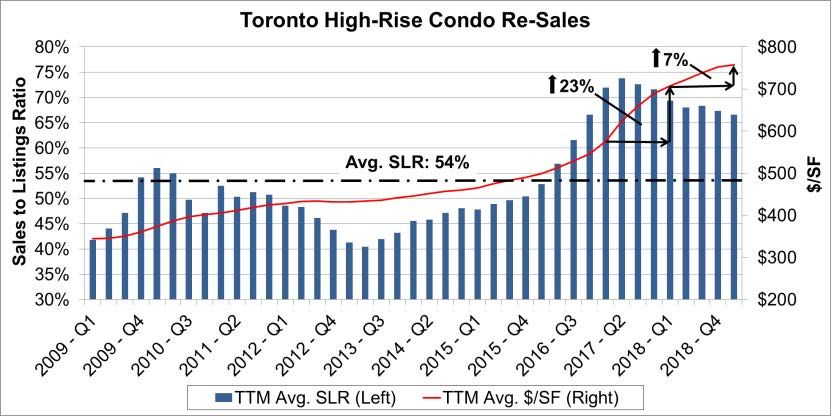
Q1 TORONTO HIGH-RISE
                                                              CONDOMINIUM MARKET
                                                                         OVERVIEW
HIGHLIGHTS
• Re-sale prices have grown 7% YoY after accelerated growth of 23%
  for the year prior. This moderation is expected to continue given that
  the re-sale market is end-user driven and affordability remains the
  primary issue (Bill B20)
• In the new condominium market, moderate growth is expected for
  the remainder of 2019 as investors wait for their rental economics to
  catch up with record high price points
• The lack of new condominium product is helping to buoy the market
  against price declines as investors pull back
• As Bill 180 takes effect, much needed new housing supply could
  begin to enter the market, helping alleviate pressures on supply and
  demand however, this is expected to take time and not materially
  affect the 2019 outlook
                                                                              (Source: Urbanation, TREB)
REMARKS                                                                       For those who either cannot afford or prefer not to purchase a
Housing ownership demand has seen a shift down market from low                home, purpose-built apartments or condominium rentals are the
rise to high rise product, fueled by the erosion of low rise affordability,   two primary housing options available. New purpose-built rental
Toronto’s vertical transformation, and the continued scarcity of rental       construction has seen a resurgence in light of strong rental market
housing. A healthy condo market attracts two distinct purchaser               fundamentals (high rents and low vacancies). This segment of the
groups; owner occupiers and investors, and a frothy condo market              market is dominated by large, institutional developers who have in
adds a third, being speculators.                                              part been able to leverage under-utilized residential and commercial
The re-sale condo market is considered the purest measure of condo            assets already owned thus substantially reducing their land cost. The
supply & demand because it caters primarily to owner occupiers,               reported 12 month average stabilized purpose built vacancy is just
most of whom are unable/unwilling to project their housing needs              0.35%, so the 9,500 units currently under construction and scheduled
4 years in advance. The creation of new condominium product, on               for completion by 2023 will fall far short of servicing demand. Until
the other hand, is dependent on strong investor support during the            that changes, investor-owned condominiums will continue to function
pre-construction phase in order to qualify for financing. As detailed         as Toronto’s de-facto rental market.
below, both the re-sale and new condo markets have been showing               Private condominium investors/landlords have been a key factor in
signs of moderation, which is expected to continue through 2019.              the success of new condominium projects in Toronto by purchasing
Given the rapid price increases over 2017 & 2018, this moderation is          pre-construction units expecting to achieve an acceptable return on
welcomed as that rate of growth was unsustainable and encouraged              their equity based on the unit’s rental economics. Due to the rapid
speculation.                                                                  price appreciation of pre-construction condominiums investors
Strong demand for existing condominium product from mid-2016 to               return on equity (ROE) has been compressed and they have begun to
mid-2017 resulted in an escalation of the Sales to Listing Ratio (SLR)        pull back on new construction purchases.
from 53% to nearly 75% over that same time period. This caused sale           Since March 2017, PSF prices being achieved on new condominium
prices to increase by approximately 23% over the same time period.            launches rose 45%. As prices rose, the absorption rate within the first
However, since the introduction of Bill B-20, the SLR has dropped to          3 months of launch began to decline, from a peak of 73% in October
about 67% and prices have increased relatively moderately by 7% YoY           2017 to 57% as of March 2019. The initial 3 month absorption of a new
with approximately 14,200 units selling at an average price of $760/SF.       condominium project now sits close to the 3 year average of 60%.
With the SLR ratio still above the 10-yr. average of 54%, PSF resale
prices are not expected to decline and low single-digit growth is
expected to continue through 2019.
Q1 TORONTO HIGH-RISE
                                                           CONDOMINIUM MARKET
                                                                      OVERVIEW
                                                                           Such a statistic typically forms the basis of ominous headlines, likely
                                                                           without the caveat that that 88% of all units in active projects are sold
                                                                           (down only 1% YoY).
                                                                           On May 2, the Ontario government announced its new Housing Supply
                                                                           Action Plan (Bill 108). One of the most notable and controversial
                                                                           features of the Bill is the reversion of LPAT’s authority back to that of
                                                                           the OMB, allowing for the Tribunal to once again make decisions based
                                                                           on the best planning outcome. The creation of the LPAT was intended
                                                                           primarily to show more deference to the municipalities in planning
                                                                           decisions, but the new process produced unintended results at a time
                                                                           when the state of Toronto housing was often regarded as a “crisis.” It
                                                                           has been reported that there are currently as many as 1,000 appeal
(Source: Urbanation, Altus)                                                cases, representing about 100,000 housing units in proposed projects
This decline can be attributed to decreased interest from speculators      across Ontario, that are waiting to be heard at the LPAT. Hopefully Bill
looking for a quick return coupled with a loss of investor appetite for    108 will help clear the backlog of cases and bring on much needed
condominium product due to reduced ROE expectations. At current            housing supply to the Toronto market.
rental rates and current condominium launch prices, investor return
expectations have been eroded to nearly 0%. Consequently, investors
should not be relied upon as heavily to drive pre-construction sales
going forward in projects looking to achieve maximum price points.
PSF condominium prices are expected to moderate in 2019 at low
single-digit growth, while condominium investors sit on the sidelines
waiting for rental rates to appreciate to the point where the rental
economics begin to satisfy investor ROE requirements. With the
Leases to Listing Ratio (LLR) at 80% and rents increasing 10% YoY, it’s
expected that investors will not have to wait long for the rental market
to catch up to price points.

(Source: Urbanation, TREB)

Any price declines that could have been created by lower investor
demand are expected to be offset by a lack of new supply in the
market. There were 50 new condominium projects launched in
Toronto over the last 12 months, the lowest 12 month rolling total
since February 2017. Only 4 launches occurred in Q1-2019, which is the
lowest level in Toronto tracking back to December, 2015. This has had
a profound impact on active project sales. 12,700 new condominiums
were sold in the 12 months to Q2-2019, a YoY decline of 4,500 sales.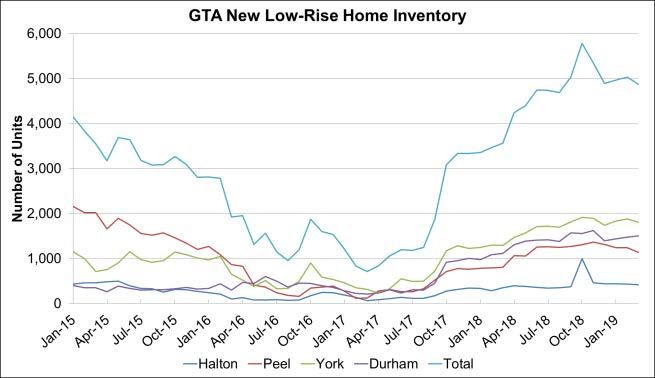
Q1 TORONTO HIGH-RISE
                                                           CONDOMINIUM MARKET
                                                                      OVERVIEW
HIGH-RISE CONDOMINIUM LAND VALUES – JUNE, 2019
The preceding market overview provides the basis for calculating the June, 2019 High-Rise Condominium Land Values. Information from
Urbanation, Altus, Glynn Group, and MCAP is utilized to undertake an extensive residual analysis process to arrive at forward-looking, short-
term estimates of approved land values in the tracked submarkets. The following commentary touches on key aspects of the tracked submarkets
that guided value estimate decisions and provided support to the residual analyses:

DOWNTOWN WEST (DW)                                                         TORONTO WEST (TW)
• Alterra launched “Rush” in November, 2018 and sold all 125 units by      • Three (3) new project launches since October, 2018 that have sold
  April, 2019 at an average of $1,166/SF                                     well to date (60-70%) at an average of $865 to $1,060/SF
• New condominium sales averaged $840/SF in the last 12 months,            • 6.1 months’ of supply remaining
  up 20% YoY                                                               • Value estimates increased modestly with support from residual
• Unsold asking price averaged $1,400/SF in the last 12 months, up           analyses conclusions
  40% YoY                                                                    —— Approximately in-line with TE but with lower high end
• 4.7 months’ of supply remaining, in line with Q1-2018
• Value estimates edged up from December, 2018 given the strong            TORONTO EAST (TE)
  sales performance, rising sale price points, and consistent supply       • Fieldgate launched “The Poet” on Queen St. E. in November, 2018
  level but the magnitude of the increases were tempered by the              and is ~50% sold at an average of $1,030/SF
  relatively high average asking price and the diverse nature of the         —— Two (2) other recently launched projects are well-sold at ~$970/
  submarket                                                                      SF
  —— DW High is now approximately in-line with the DC Low                  • New condominium sales averaged $635/SF in the last 12 months,
                                                                             up 15% YoY
DOWNTOWN EAST (DE)                                                         • Unsold asking price averaged $960/SF in the last 12 months, up 17%
• A project resumed sales in March, 2019 for 1 month only, achieving         YoY
  16 sales during that time at an average of $1,076/SF, 11% higher than    • 5.6 months’ of supply remaining, up from 4.7 months in Q1-2018
  its prior sales achieved in mid-2018                                     • Value estimate increases are reflective of the solid sales figures
• New condominium sales averaged $770/SF in the last 12 months,              reported for recent launches at increasing price points
  up 12% YoY                                                                 —— Low end remains unchanged, given diverse nature of the
• Unsold asking price averaged $1,295/SF in the last 12 months, up               submarket
  42% YoY                                                                    —— High end is increased, now in-line with the Market Value average
• 5.0 months’ of supply remaining, up from 2.5 months in Q1-2018                 for DE & DW
• Values estimates remain unchanged from December, 2018 given the
  diverse nature of the submarket, the rising supply level, and the high   BLOOR-YORKVILLE (BY)
  average asking price                                                     • Lanterra’s “50 Scollard” is the most recent project to launch in BY
  —— Low and High remain approximately in-line with those of DW,             (June, 2018) achieving 10 sales to date at an average of $2,100/SF
       High is now generally in-line with DC Low                             —— End-user purchaser profile
                                                                             —— Represents high end of the market
DOWNTOWN CORE (DC)                                                         • Seven (7) other active projects previously launched in BY are at least
• Cresford launched “YSL Residences” in October, 2018 and is 73%             80% sold
  sold at an average of $1,510/SF                                          • Value estimate increases are supported by residual analyses
  —— First DC project launch since Oct. 2017                                 utilizing the updated sales data
  —— No other new launches, aside from Davpart’s “United BLDG” for           —— Increases are more reflective of availability of data, not sudden
     which sales data has not yet been released                                   changes in submarket conditions
• Value estimates have been heavily influenced by the recent,                —— 50 Scollard used as a benchmark ceiling value
  successful YSL project launch                                              —— Residual analyses provide a consistent range for the Market
  —— Value estimate increases are primarily a reflection of the updated           Value and Low estimates
     sales data used in the residual analyses; previously hesitant to
     increase values at this magnitude given the lack of new project
     launch data
  —— DC High is now at the Low end of the BY range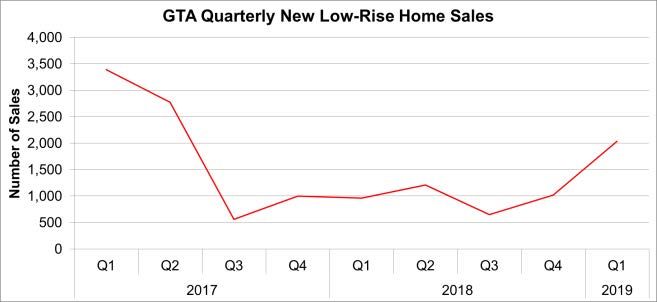
Q1 TORONTO HIGH-RISE
                                                             CONDOMINIUM MARKET
                                                                        OVERVIEW
NORTH TORONTO (NT)
• Tribute launched “Yonge & Soudan” in January, 2019 and is 55% sold
  at an average of $1,066/SF
• New condominium sales averaged $830/SF in the last 12 months,
  up 13% YoY
• Unsold asking price averaged $1,120/SF, up 19% YoY
• 5.6 months’ of supply remaining, up from 4.1 months in Q1-2018
• Market Value and Low estimate edged up from December, 2018;
  High end is now in-line with the DC Market Value average and below
  the Low end of BY

NORTH YONGE CORRIDOR (NYC)
• The 2nd phase of Aoyuan’s “M2M” development, “T1”, launched
  sales in March, 2019 and is 51% sold at an average of $1,005/SF
• New condominium sales averaged $725/SF in the last 12 months,
  up 11% YoY
• Unsold asking price averaged $1,000/SF, up 8% YoY
• 8.6 months’ of supply remaining, down from 15 months in Q1-2018
• Market Value estimate has edged up from December, 2018; High end
  now just above NT Low

HWY. 7 / YONGE CORRIDOR
• No recent new launches in this submarket
• Most recent launch in Richmond Hill is Sequoia Grove Homes’ “Elgin
  East at Bayview – 2nd Phase” which launched in March, 2019 and
  has reported only 11 sales to date at $713/SF (8.5% higher than
  Phase 1 sales achieved in 2018)
• Given a lack of reliable data, we have left the values for this submarket
  unchanged from December, 2018

VAUGHAN
• Cortel Group launched “CG Tower (Expo Phase 5)” in November,
  2018 and is 52% sold at an average of $847/SF (27% higher than
  Phase 4 sales achieved in 2017)
  —— Most recent launch since 2017
• Given a lack of reliable data, we have left the values for this submarket
  unchanged from December, 2018
HIGH-RISE CONDOMINIUM
LAND VALUES
For the Period Ending June 6, 2019
SUB-MARKET LOW $ / SF HIGH $ / SF MARKET VALUE $ / SF
DOWNTOWN WEST $125 $215 $165 - $175
DOWNTOWN EAST $120 $210 $150 - $160
DOWNTOWN CORE $225 $330 $265 - $275
TORONTO WEST $65 $140 $95 - $105
TORONTO EAST $60 $165 $105 - $115
BLOOR-YORKVILLE $300 $430 $350 - $375
NORTH TORONTO $145 $265 $170 - $180
NORTH YONGE CORRIDOR $70 $155 $90 - $100
HWY 7/YONGE CORRIDOR $45 $65 $60 - $65
VAUGHAN $45 $80 $55 - $65
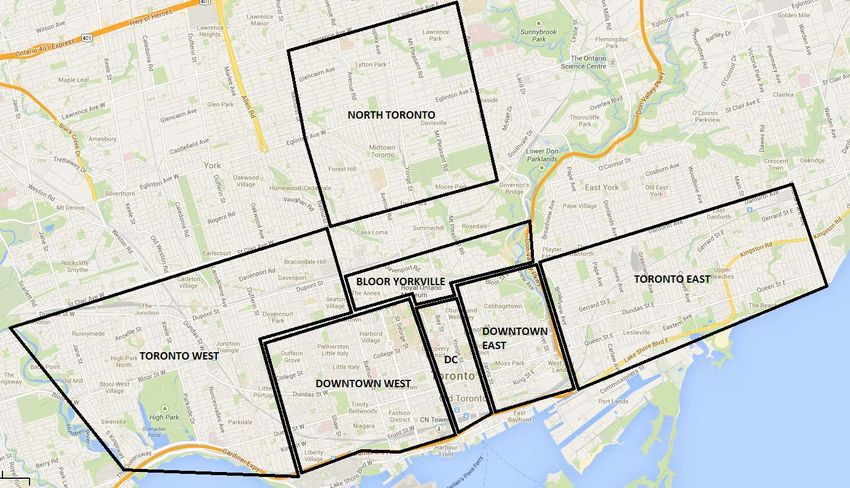
*Values based on Gross Buildable SF (fully approved)SUBMARKET
DELINEATION
SUB-MARKET
DOWNTOWN WEST
DOWNTOWN EAST
DOWNTOWN CORE
TORONTO WEST
TORONTO EAST
BLOOR-YORKVILLE
NORTH TORONTO
NORTH YONGE CORRIDOR
HWY 7/YONGE CORRIDOR
VAUGHAN2019 LOW-RISE &
HIGH-RISE LOANS
June 6, 2019
MCAP’s strength is working with developers
and builders to create unique value-added LAND DEVELOPMENT & HIGH-RISE MEZZANINE LOAN
CONSTRUCTION LOAN CONSTRUCTION LOAN
financing solutions to meet their individual
project needs. We offer a variety of loan types 20 DETACHED UNITS, 234 HIGH RISE UNITS, 122 MID RISE UNITS,
and loan structures to suit a wide range of MARKHAM SCARBOROUGH TORONTO
development initiatives:
$25,000,000 $65,025,000 $3,400,000
LAND LOANS
Land financing so you can acquire the right
property for your project. We offer end to end
support, working with you every step of the way. LAND DEVELOPMENT & LAND DEVELOPMENT & CONDO TOWNHOUSES
CONSTRUCTION LOAN CONSTRUCTION LOAN CONSTRUCTION LOAN
LAND DEVELOPMENT LOANS 72 STACKED TOWNHOUSE 14 DETACHED UNITS, 77 CONDO TOWNHOUSES,
Non-revolving development financing and UNITS, GUELPH TORONTO BRAMPTON
strategies to help get your project underway.
$10,800,000 $18,400,000 $29,700,000
CONDOMINIUM CONSTRUCTION LOANS
MCAP provides financing for your mid-rise and/
or high-rise condominium project.
LAND DEVELOPMENT & LAND DEVELOPMENT & COMMERCIAL TERM LOAN
CONSTRUCTION LOAN CONSTRUCTION LOAN
FREEHOLD CONSTRUCTION LOANS
MCAP provides financing for the construction 37 DETACHED UNITS, 50 DETACHED UNITS, 31,435 SF. RETAIL SPACE,
of single detached, semi-detached freehold and BRAMPTON THOROLD ETOBICOKE
condominium townhouses on a revolving and
cost to complete basis. $22,700,000 $15,800,000 $8,900,000
COMMERCIAL CONSTRUCTION LOANS
Financing for the construction of single or
multi-tenant commercial buildings such as LOT DEPOSIT & LAND DEVELOPMENT LAND LOAN
CONSTRUCTION LOAN LOAN
retail strip plazas, industrial condominiums and 2.4 ACRE FUTURE
commercial office towers. 24 TOWNHOUSE LOTS & 71 SINGLE DETACHED DEVELOPMENT SITE,
4 SEMI-DETACHED LOTS, LOTS, BRAMPTON MISSISSAUGA
VAUGHAN
RESIDENTIAL INVENTORY LOANS
Financing for completed inventory units that are $6,700,000 $8,200,000 $3,500,000
available for sale.
EQUITY AND MEZZANINE LOANS
Postponed and subordinated equity and
mezzanine loans to help you meet your FOR FURTHER INFORMATION, PLEASE CONTACT:
financing obligation as required by other MCAP
loan facilities or by other Lenders.
BRUNO IACOVETTA: 416 368 8890 bruno.iacovetta@mcap.com
JAMES TOBIAS: 416 847 3484 james.tobias@mcap.com
DAVID GWILLIAMS: 416 847 3550 david.gwilliams@mcap.com
MCAP FINANCIAL
MARIO POLICICCHIO: 416 591 2748 mario.policicchio@mcap.com
Development Finance Group
400-200 King Street West
Toronto, ON M5H 3T4
Tel: 416 598 2665 MCAP Financial Corporation
Fax: 416 368 8822 Ontario Mortgage Brokerage #10600 | Ontario Mortgage Administrator #11790
www.mcap.comYou can also read