2019 FULL-YEAR RESULTS - Paris | February 27, 2020 - Groupe SEB

 
CONTINUE READING
2019 FULL-YEAR RESULTS - Paris | February 27, 2020 - Groupe SEB
2019 FULL-YEAR
RESULTS
Paris | February 27, 2020

                            Follow the webcast of the meeting
                              here or at www.groupeseb.com
2019 FULL-YEAR RESULTS - Paris | February 27, 2020 - Groupe SEB
2019 FULL-YEAR RESULTS

                 NOTE

                 This presentation may contain certain forward-looking statements regarding Groupe SEB’s activity, results and
                 financial situation. These forecasts are based on assumptions which seem reasonable at this stage, but which depend
                 on external factors including trends in commodity prices, exchange rates, the economic environment, demand in the
                 Group’s large markets and the impact of new product launches by competitors.

                 As a result of these uncertainties, Groupe SEB cannot be held liable for potential variance on its current forecasts,
                 which result from unexpected events or unforeseeable developments.

                 The factors which could considerably influence Groupe SEB’s economic and financial result are presented in the
                 Annual Financial Report and Registration Document filed with the Autorité des Marchés Financiers, the French
                 Financial Markets Authority. The balance sheet and income statement included in this press release are excerpted
                 from financial statements consolidated as of December 31, 2019 examined by SEB SA’s Statutory Auditors and
                 approved by the Group’s Board of Directors, dated February 25, 2020.

2   27/02/2020   Full-Year Results
2019 FULL-YEAR RESULTS - Paris | February 27, 2020 - Groupe SEB
CONTENTS
                              1. Another great year
                              2. Good performance
                              3. A long-term strategy
                              4. Outlook
                              5. Appendixes

3   27/02/2020   Full-Year Results
2019 FULL-YEAR RESULTS - Paris | February 27, 2020 - Groupe SEB
01
ANOTHER GOOD
YEAR
2019 FULL-YEAR RESULTS - Paris | February 27, 2020 - Groupe SEB
General environment

                         ▪ Overall still complicated and volatile environment
                           ➔ Geopolitical, trade and social tensions

                         ▪ Buoyant and resilient industry

                         ▪ More favorable raw material and currency environment

                         ▪ Ongoing changing retail industry
                           ➔ Competitive and promotion-driven climate

5   27/02/2020    Full-Year Results
2019 FULL-YEAR RESULTS - Paris | February 27, 2020 - Groupe SEB
Another year of dynamic growth

                                                          Sales
                                                    €7,354m
                                                  +8.0%      +5.8% LFL

                   Professional                                           Consumer
                        €799m                                             €6,555m
                 +25.9%              +12.1% LFL                          +6.1%   +5.2% LFL

6   27/02/2020   Full-Year Results
2019 FULL-YEAR RESULTS - Paris | February 27, 2020 - Groupe SEB
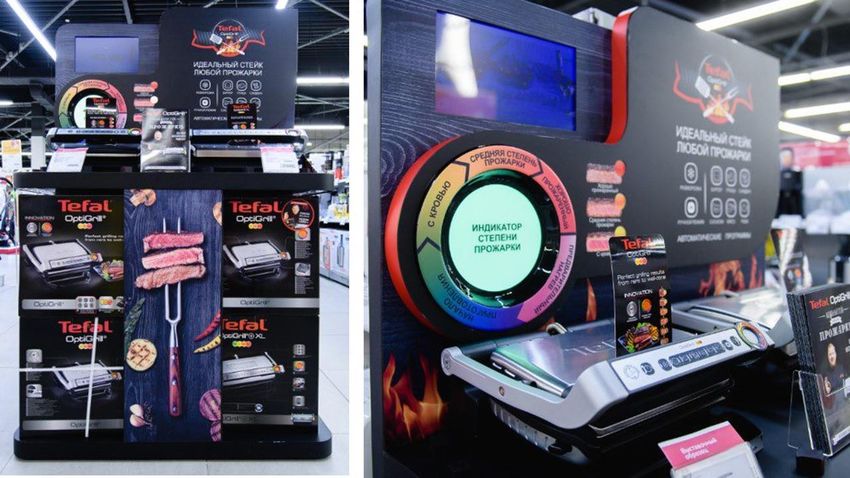
…and good performance

                                           2019 financial key figures

                                                      ORfA
                                                    €740m
                    Sales                         +6.5% +4.7% LFL                   Net debt
                 €7,354m                                                          €1,997m
        +8.0%               +5.8% LFL                                         o/w IFRS 16 debt: €334m
                                                    Net profit
                                                    €380m
                                                       -9.4%

      Dividend proposed at the 2020 AGM                           €2.26, +5.6% vs. 2018 dividend
                   in respect of FY 2019

7   27/02/2020   Full-Year Results
2019 FULL-YEAR RESULTS - Paris | February 27, 2020 - Groupe SEB
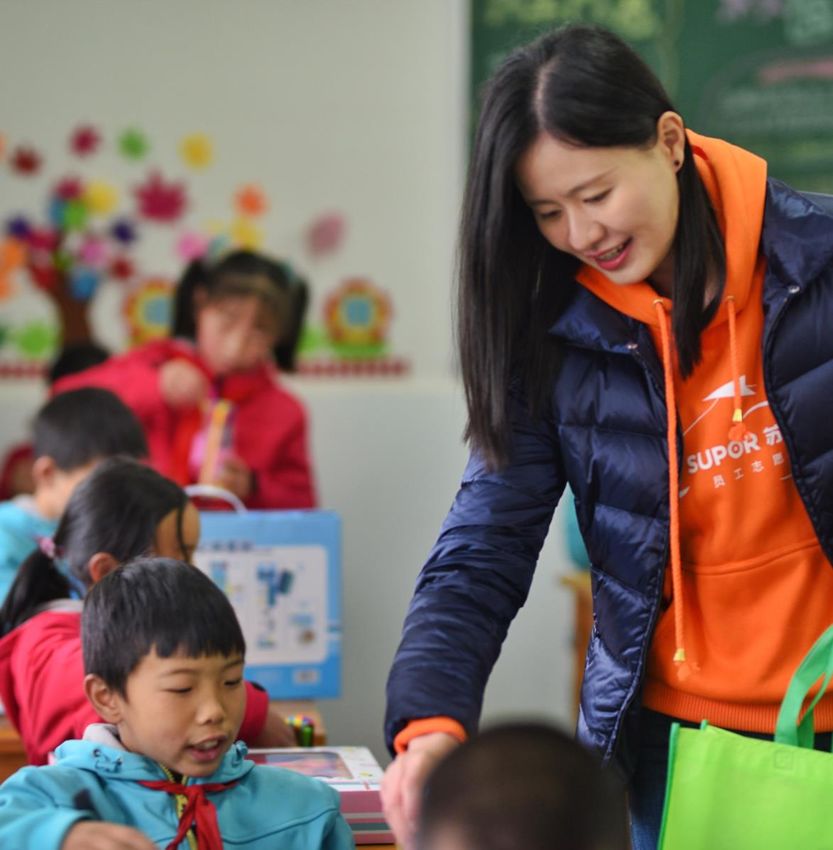
Continued development in Professional business

                                                    Annual sales: ~€20m

                         Annual sales: ~€80m
8   27/02/2020   Full-Year Results
2019 FULL-YEAR RESULTS - Paris | February 27, 2020 - Groupe SEB
SEB Alliance, a catalyst to our innovation strategy
                                                                                              Since 2011
                                                                                       15 direct minority invesments
                                                                                         - 2 majority investments

          A global active assessment tool in disruptive technologies…                         6 partner funds

          …bolstered by cooperation with funds, leaders in their fields
          ➔ International and sector-wide coverage
          ➔ Tracking key trends

                                                                                                     In 2019
          Investment capabilities in targeted and promising segments
                                                                                                > 2 000 accessible
                 Beauty               Home farming   Robotics                                         projects

                                New categories                    Digital transformation/AI
9   27/02/2020    Full-Year Results
2019 FULL-YEAR RESULTS - Paris | February 27, 2020 - Groupe SEB
02
GOOD
PERFORMANCE
1 Sales
                                      2 Results

11   27/02/2020   Full-Year Results
Development in sales 2018 → 2019

In €m                                                                  7,354
                                                    +71         +75
                                         +396
                              6,812

                                         Organic   Currency
                                         growth     effect     Scope

                                         +5.8%     +1.0%      + 1.2%

                                                   +8.0%

                                2018                                   2019

 12     27/02/2020   Full-Year Results
Currency impact on 2019 sales

              In €m      35
                         30                                                                             +€71m
                         25                                                                             Q1: +€13m
                                                                                                        Q2: +€2m
                         20                                                                             Q3: +€30m
                                                                                                        Q4: +€26m
                         15
                         10
                           5
                           0
                          -5
                        -10
                        -15
                                            CNY

                                                                                EGP

                                                                                                                ARS
                                                        UAH

                                                              RUB

                                                                    CHF

                                                                                            CAD

                                                                                                  BRL

                                                                                                                      TRY
                                                                                      THB

                                                                                                         COP
                                                                          MXN

                                                                                                                            OTHERS
                                                  JPY
                                      USD

13   27/02/2020   Full-Year Results
Breakdown of 2019 sales by region

                                             Other Asia
                                                    8%

                                                                          Western
                                                                          Europe
                                                                          38%

                                           China
                                            25%              €7,354m
                                                              +5.8% LFL

                                       South America
                                                 4%

                                                                          Other EMEA
                                                                          13%
                                             North America
                                                      12%
14   27/02/2020    Full-Year Results
+26%
               Growth in all product lines

     20%                                                                                                                         Professional
                                                                                                                                 as reported

                                                                                                                      Home
                                                                                                                      care
                                                                                                        LKA
     15%

                                                                                            Home
                                                                                           comfort
                                                                              Electrical
                                                                              cooking
     10%                                                                                                                          Professional
                                                                                                                                      LFL
                                                                   Personal
                                                                     care
                                 Cookware      Food
                                                        Beverage
                    Linen                   preparation
     5%
                    care

                                                                                                         2019 sales growth LFL
     0%
15    27/02/2020   Full-Year Results                                                        *LKA = Large Kitchen Appliances
Consumer

16   27/02/2020   Full-Year Results
Growth in all regions

                                                                           Other EMEA
                                                                            +12.4%

                            North America                 Western Europe
                                  +2.9%                      +0.3%
                                                                             China
                                                                            +12.2%

                                          South America                              Other Asia
                                             +0.7%                                    +1.2%

                                       AMERICAS              EMEA             ASIA
                                                                                                  LFL
                                         +2.1%               +3.3%            +9.4%
17   27/02/2020    Full-Year Results
Top 20 countries

                                                                                               TOP 10 COUNTRIES

                                          SPAIN             RUSSIA             CHINA             Colombia

                                           ITALY            JAPAN          BRAZIL*            Mexico

                                      Poland       Belgium           Ukraine     Turkey             Canada

                                                                    FRANCE           USA

                                      Austria Netherlands     GERMANY           SOUTH KOREA         United Kingdom

                                                                                                        Consumer sales LFL
                                                                                 *Excl. tax receivable (PIS COFINS) impact
18   27/02/2020   Full-Year Results
Western Europe

                        Sales            Organic growth
                  €2,442m                  +0.3%
 FRANCE
 ▪ Stable annual sales
 ▪ Performing well in cookware, more difficult in SDA
 ▪ Year-end impacted by strikes and order cancellations/
   postponements

 GERMANY
 ▪ Bringing Groupe SEB Deutschland’s sales practices
   into compliance

 OTHER COUNTRIES
            Italy, Belgium and Spain
         • Netherlands, United Kingdom

19   27/02/2020   Full-Year Results
Other EMEA countries

                     Sales                Organic growth

                  €897m                    +12.4%

       Robust growth on buoyant markets
       3 strong drivers in the region
       ▪ Product dynamics
       ▪ Offline and online marketing activation
       ▪ Group Retail roll-out

       RUSSIA and CENTRAL EUROPE
       ▪ Strengthened leadership

       TURKEY and MIDDLE EAST
       ▪ Recovery

20   27/02/2020    Full-Year Results
North America
                                               Sales                      Organic growth
                                           €589m                            +2.9%

                                       USA
                                       ▪   Continued difficulties in traditional retail
                                       ▪   Market share gains in Cookware and Linen care
                                       • ➔ T-Fal and Rowenta are market leaders

                                       CANADA
                                       ▪   Challenging market environment
                                       ▪   Specific deals driving growth

                                       MEXICO
                                       ▪   Brisk growth in annual sales
                                       ▪   Record Q4 performance
21   27/02/2020    Full-Year Results
South America

                                                       Sales                      Organic growth
                                                   €326m                             +0.7%

                                         BRAZIL
                                         ▪ Sales 2019 +10% LFL excl. PIS-COFINS*
                                         ▪ Good performance in fans and Dolce Gusto
                                         ▪ Expansion of new categories: oil-less fryers, grills…

                                         COLOMBIA
                                         ▪ Growth propelled by fans and cookware, oil-less fryers roll-out
                                         ▪ Remarkable improvement in industrial competitiveness
                                         ▪ Group Retail performed well

22   27/02/2020   Full-Year Results   • *Recognition of tax receivables (€32m in 2018, €8m in 2019)
China

                  Sales                Organic growth
       €1,762m                          +12.2%
Sustained growth in Supor’s core business
against high comps, fueled by e-commerce

COOKWARE
▪     Flagship products: woks, pots and isothermal mugs

SMALL DOMESTIC APPLIANCES
▪ Growth nurtured by electrical cooking and new categories
  (garment steamers, vacuum cleaners, etc)

LARGE KITCHEN APPLIANCES
▪ Growth engines: extractor hoods, water purifiers

            NEW MARKET SHARE GAINS BY SUPOR

23   27/02/2020    Full-Year Results
Other Asian countries

                   Sales               Organic growth
              €539m                      +1.2%
 JAPAN
 ▪ Flagship product dynamics (cookware and electric kettles)
   driving continued firm growth
 ▪ Encouraging development in new categories
 ▪ Confirmed success of Group Retail

 SOUTH KOREA
 ▪ Declining market, annual sales down LFL

 OTHER COUNTRIES
 ▪ Restored growth in Australia
 ▪ Buoyant momentum in Thailand and Malaysia
 ▪ Sales decrease in Vietnam
24   27/02/2020    Full-Year Results
Professional

25   27/02/2020   Full-Year Results
Professional

             Sales                    Organic growth

       €799m                           +12.1%

       PROFESSIONAL COFFEE
       ▪ Confirmed fast development
       ▪ Sustained core business and major contracts
       ▪ Acquisition and integration of Wilbur Curtis into
         SEB Professional

26   27/02/2020   Full-Year Results
1 Sales
                                      2 Results

27   27/02/2020   Full-Year Results
Operating Result from Activity (ORfA)

                                        In €m      2018    2019     Δ      Δ LFL

                                        Sales      6,812   7,354   +8.0%   +5.8%

                                        ORfA        695     740    +6.5%   +4.7%

                                      Op. margin   10.2%   10.1%   -0.1%   -0.1%

28   27/02/2020   Full-Year Results
ORfA bridge

In €m
                                                 +8      -5
                                         +141                    -37

                                                                           -30
                                                                                       -45

                                                                                                 727                           740
                                                                                                                     +18
                                                                                                           -5

                     695
                                     Volumes    Price   COGS   Growth     Admin     PIS-COFINS          Currencies   Scope
                                                 Mix           drivers   & comm.      GSEB D                            &
                                                                         expenses                                    method
                                                                                                                      effect

                     2018                                                                        2019                          2019
                                                                                                  LFL

 29     27/02/2020   Full-Year Results
Growth drivers

                             In €m                              2018                        2019                    Δ LFL %

                             Innovation                          247                         267                      +7.7%

                             Advertising and marketing           431                         461                      +5.9%

                             Total growth drivers                678                         728                      +6.5%

                                                    Innovation: gross amount, before French research tax credit and capitalized costs

30   27/02/2020    Full-Year Results
Operating profit

                                                                      2018                   2019                   Δ%
                      In €m

                      Operating Result from Activity (ORfA)            695                   740                 +6.5%

                      Discretionary and non-discretionary
                                                                       (34)                   (37)
                      profit-sharing*

                      Other operating income and expense               (36)                   (82)

                      Operating profit                                 625                   621                  -0.8%

                                                              * *Including 2019 employee share ownership plan expenses for €2m

31   27/02/2020   Full-Year Results
Net profit

                           In €m                       2018    2019    Δ%

                           Operating profit            625     621     -0.8%

                           Net financial expense       (32)    (61)

                           Tax                         (131)   (131)

                           Non-controlling interests   (43)    (49)

                           Net profit                  419     380     -9.4%

32   27/02/2020   Full-Year Results
Simplified balance sheet

                                                                 31/12/2018        31/12/2019
                          In €m

                          Tangible fixed assets                   3,578               4,263
                          Operating WCR                           1,120               1,215
                          Total assets to be financed             4,698               5,478

                          Equity                                  2,307               2,628
                          Provisions                               383                  423
                          Other current assets and liabilities     430                  430
                          Net debt                                1,578               1,997*
                          Total financing                         4,698               5,478
                                                                              *o/w €334m IFRS16 impact

33   27/02/2020   Full-Year Results
Change in net debt

                                                              Free cash flow: €367m

       In €m
                                                                                                               + 137         -1         1 997
                                      1 940
                      + 362                   - 896                                                + 288
                                                                            + 183        - 32
      1 578
                                                                  + 303

                                                       + 75

                   IFRS 16 debt                Cash     Chg.      Capex.   Taxes and     Chg.       Acquisitions Dividends Currencies
                     opening of                flow   Operating             interest Non Operating and other non
                      accounts                         WCR                               WCR         operating

     Debt end-                      Debt                                                                                                Debt end-
       2018                      01/01/2019                                                                                               2019
34   27/02/2020   Full-Year Results
Working Capital requirement evolution over 10 years

                                       25.6%
                                               24.9%
                    24.0%

                                                       22.7%      22.4%
       21.9%

                                                                           21.0%

                                                                                           18.8%
                                                                                   18.4%

                                                                                                   16.4%
                                                                                                            16.5%
        09              10              11      12     13         14       15      16      17      18      19
                                                               WCR as % of sales

35   27/02/2020    Full-Year Results
Financial ratios

                                                                                           2.8
                                                                                                      2.4

                                                                                                            1.9             2.1
                                        1.3        1.2                                     1.1
                                                                                                                            1.6
                                                                         1.0                          1.0                excl. IFRS 16
                                                             0.9                                                         and 2019 acquisitions
                                                                               0.6                          0.7
      0.6                               0.5        0.4
                     0.3                                     0.3         0.3                                                0.8
0.2                          0.1                                                     0.2

      09             10                 11         12        13          14     15         16         17    18         19

                                              Net debt/adjusted EBITDA           Net debt-to-equity
                                                                                                                  Ratios at 31/12

36    27/02/2020    Full-Year Results
03
A LONG-TERM
STRATEGY
Relevance of our balanced model

                                       1   GEOGRAPHIES

                                                         2   CATEGORIES

                       MULTI
                                                         3    BRANDS

                                       4    CHANNELS

38   27/02/2020    Full-Year Results
Balanced sales breakdown
                      A global and balanced presence...

1

         Unrivalled global footprint, strong local positions                     Emerging markets
                                                                Mature markets         45%
         ▪ ¾ of sales in countries where we are #1 or #2             55%

         ▪ Continued product offering expansion in markets

         Acquisitions as an additional catalyst

         Long-term growth enablers
         ▪ Heterogeneous equipment rates
         ▪ Development of mature markets ➔ Renewal, upselling
         ▪ Emerging countries’ strong potential :
             • Middle class development
                  • +14% organic sales CAGR since 2016
    39   27/02/2020    Full-Year Results
...and accelerating growth across new
                  economies
1

                Increased critical mass across countries
                ▪ 20th country in 2019: Sales ~ €60m vs. ~ €35m in 2016

                Pool of fast-growing countries
                ▪ EMEA: Slovakia, Ukraine, Kazakhstan, Egypt…
                ▪ Asia: Thailand, Malaysia
                ▪ Americas: Mexico, Colombia, …
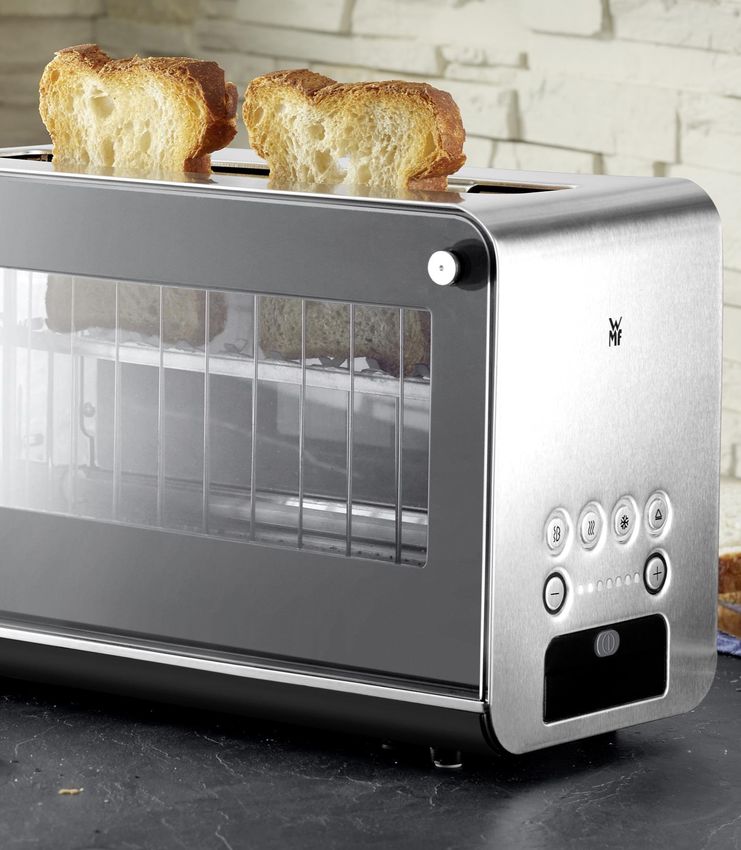
    40   27/02/2020   Full-Year Results
A presence on numerous product                                     2019 sales by category

                  categories...
                                                                                    Professional          Kitchen
                                                                                                          Electrics
2                                                                                          ~10%

           Global leader in Cookware, Kitchen Electrics and Linen care   Home and                   ~40%
                                                                         Personal    ~20%
                                                                         Care
           Growing steadily in all Consumer categories
                                                                                            ~30%
           Global leader in Professional Coffee (automatic espresso
           machines): growth and expanding global reach
                                                                                            Cookware &
           ▪ Sales CAGR +16% LFL in 3 years                                                 Kitchenware
           ▪ Key milestones in the US and China
           ▪ Acquisitions: Wilbur Curtis and Krampouz

    41   27/02/2020   Full-Year Results
Versatile Vacuum Cleaners
                      ...and a capacity to reinvent ourselves                     +€100m
                      constantly

2                                                                   Garment
                                                                    steamers   Sales ≥€100m            Mugs

                                                                     x2                                x4
           Creating new product opportunities by leveraging:
           ▪ Technological developments and consumer trends
           ▪ Our innovation capabilities
           ▪ Targeted external growth acquisitions
                                                                                       x2
                                                                               Full Auto Coffee Machines
           Constantly speeding-up road-to-market and the Consumer
           journey
                                                                                   Sales 2016 - 2019
           Driving the circular economy

    42   27/02/2020    Full-Year Results
A unique brand portfolio...

3

                Strong, diversified and complementary brands
                ▪ Consumer, global and regional
                ▪ Premium
                ▪ Professional

                Organized on platforms ➔ Coordination, dissemination,
                consistency

                Responsible and inspiring brands

    43   27/02/2020   Full-Year Results
...and strong local roots

3

               Emblematic local brands appealing to consumers in their
               day-to-day lives for 3 generations
               ▪ Heritage and credibility

               Supported by local brand ambassadors
               ▪ Chefs, influencers, communities of consumers, etc.

               Stakeholders in society:
               ▪ Imusa: “Tinteros Day” in Colombia
               ▪ Supor: Financing the construction of schools in China
               ▪ France: Moulinex “Malin” initiative

    44   27/02/2020    Full-Year Results
Sales by distribution channel

                  A multi-channel approach...
                                                                         Professional
                                                                                                     Mass retail
                                                                        Others

4
                                                                     Group
                                                                     Retail

                Network synergies                                                                           Specialists

                ▪ Accessing all consumers                         Traditional
                ▪ Adapting to local characteristics

                                                                                              E-Commerce
                Long-term partnerships with retailers
                ▪ Execution, category management, merchandising
                ▪ Specific sales offers, LPs

    45   27/02/2020   Full-Year Results
Digital share in media investment

                   ...and an increased proximity
                   with end-consumers                                                                     ~50%

4
                                                                                                  x2
               Targeted digital approaches                                              2016                2019

               ▪      E-Commerce
                                                                                         Traffic on Group websites
               ▪      Digital investments
               ▪      Direct relationship with Consumers (CRM)
               ▪      Communities & apps
                                                                                                 +79%
                                                                                          2016              2019
               Direct approaches
               ▪      Group Retail = 1,345 stores o/w 730 Supor Lifestores in China
                      ➔ +135 vs. 2016
               ▪      “Online DTC” development

    46   27/02/2020    Full-Year Results
A consumer in constant transformation…

                                           Health             New
     Simplification                      & Wellness           uses            Commitment             Digitization

      Ease of use,                      Healthy eating    Personalized and   A quest for meaning,    E-commerce,
     versatility and                   and emphasizing      multicultural      naturalness, and     connections and
       time saved                      home-made trend       experience        circular economy       communities

                                                         … source of new opportunities for the Group

47   27/02/2020    Full-Year Results
04
OUTLOOK
Covid-19 : current status

             Top priority given to employees’ health protection

             INDUSTRY

             ▪ 6 out of our 7 plants restarted production
               ➔ Increasing to reach full production capacity by the end of March
                   ➔ Wuhan: lock-down lifted mid-March at best and transfer of most urgent productions to other Supor sites or to
                     subcontractors

             ▪ To date, no impact on our 35 other manufacturing sites in the world (components and activity)

             ▪ To date, no shortage of sourced products (inventories accumulated before Chinese New Year)

             COMMERCIAL ACTIVITY

             ▪ China as the most impacted country

             ▪ Loss in revenue estimated at around €250m in Q1

49   27/02/2020     Full-Year Results
Groupe SEB: 2020 context

             Uncertain over environment and Covid-19 related issues
             Higher FX volatility expected compared to 2019
             More favorable raw material context at this stage

             ➔ Lower performances expected in Q1
                ▪ Covid-19 impacts as from February
                ▪ No major impact on our supply chain at this stage
                ▪ 2019 base effects: Chinese New Year sell-in and Professional Coffee

             ➔ Group’s ability to manage crisis periods
                ▪ Flexibility of our manufacturing base
                ▪ Long-term vision

50   27/02/2020    Full-Year Results
05
APPENDIX
Organic sales growth per quarter

                                                                              2017   2018         2019
                  In %                                                    +9.2%      +7.8%     +5.8%
                                 12     11.5

                                 10                    8.6                8.8
                                               8.5                                             8.4
                                   8                                    7.7                    8.4
                                                     8.2

                                   6
                                           7.4             7.3            7.8

                                   4
                                                                                              2.3%
                                   2                                                          exc. PIS COFINS impact
                                                       2017      2018    2019
                                                                                               0.9
                                   0
                                               Q1      Q2                 Q3                 Q4
52   27/02/2020     Full-Year Results
IFRS 16 implementation - Impacts in 2019

                                                 GROUPE SEB
                                                  Impacts on:

                  1,300 contracts

                                                    Net debt
                               Stores
                                          +€334m as of December 31, 2019

                                               Adjusted EBITDA
                                                                           ➔ No cash impact
                              Offices
                                                    +€96m

                                                     ORfA
                             Warehouses
                                                     +€9m

                                                   Net Income
                           Vehicles                  -€6m

53   27/02/2020   Full-Year Results
2019 sales by region
                      In €m, unaudited figures                                                                     As                         Q4 2019
                                                                               2018               2019                     2019 LFL
                                                                                                                reported                       LFL
                                      EMEA                                        3,223                3,339      +3.6%      +3.3%                -1.1%
                                      Western Europe                              2,430                2,442       +0.5%      +0.3%                -4.8%
                                      Other countries                                793                 897      +13.1%     +12.4%              +10.7%
                                      AMERICAS                                       887                 915      +3.2%      +2.1%                -9.8%
                                      North America                                  547                 589       +7.8%      +2.9%                -3.8%
                                      South America                                340(1)              326(2)      -4.3%      +0.7%              -19.0%
                                      ASIA                                        2,067                2,301     +11.3%      +9.4%               +9.9%
                                      China                                       1,554                1,762      +13.3%     +12.2%              +15.4%
                                      Other countries                                513                 539       +5.1%      +1.2%                -2.6%
                                      TOTAL Consumer                             6,177                 6,555      +6.1%      +5.2%               +0.4%
                                      Professional                                  635                 799      +25.9%     +12.1%               +6.3%
                                      Groupe SEB                                 6,812                 7,354      +8.0%      +5.8%               +0.9%
                                                                                                                              % based on non-rounded figures
                                      (1) including €32m in recognition of tax receivables in Brazil
                                      (2) Including €8m in recognition of tax receivables in Brazil

54   27/02/2020   Full-Year Results
2019 Quarterly Sales

                         In €m
                                                                               Q1..            Q2      H1      Q3     9-month    Q4     2019

                                      EMEA                                   711              690     1,401   779      2,180    1,159   3,339

                                      Western Europe                         519              515     1,033   553      1,586    856     2,442

                                      Other countries                        192              175     368     226       594     303     897

                                      AMERICAS                               169              194     362     268       630     285     915

                                      North America                          103              121     224     176       400     190     589

                                      South America                           66               73     138      92       230      95     326(1)

                                      ASIA                                   659              523     1,182   533      1,715    586     2,301

                                      China                                  541              396     938     401      1,339    423     1,762

                                      Other countries                        118              127     244     132       376     163     539

                                      TOTAL Consumer                        1,539            1,407    2,946   1,579    4,525    2,030   6,555

                                      Professional                           183              208     391     198       589     210     799

                                      Groupe SEB                            1,722            1,615    3,337   1,777    5,114    2,240   7,354

                                      (1) Including €8m in recognition of tax receivables in Brazil

55   27/02/2020   Full-Year Results
Glossary
            On a like-for-like basis (LFL) – Organic
            The amounts and growth rates at constant exchange rates and consolidation scope
            in a given year compared with the previous year are calculated:
            • using the average exchange rates of the previous year for the period in consideration (year, half-year, quarter);
            • on the basis of the scope of consolidation of the previous year.
            This calculation is made primarily for sales and Operating Result from Activity.

            Operating Result from Activity (ORfA)
            Operating Result from Activity (ORfA) is Groupe SEB’s main performance indicator. It corresponds to sales minus operating costs, i.e. the cost of sales, innovation expenditure (R&D,
            strategic marketing and design), advertising, operational marketing as well as commercial and administrative costs. ORfA does not include discretionary and nondiscretionary profit-
            sharing or other non-recurring operating income and expense.

            Adjusted EBITDA
            Adjusted EBITDA is equal to Operating Result from Activity minus discretionary and non-discretionary profit-sharing, to which are added operating depreciation and
            amortization.

            Free cash flow
            Free cash flow corresponds to the “net cash from operating activities” item in the consolidated cash flow statement, adjusted from non-recurring transactions with an impact on
            the Group’s net debt (for example, cash outflows related to restructuring) and after taking account of recurring investments (CAPEX).

            Net debt
            This term refers to all recurring and non-recurring financial debt minus cash and cash equivalents, as well as derivative instruments linked to Group financing. It also includes
            financial debt from application of the IFRS 16 standard “Leases” in addition to short-term investments with no risk of a substantial change in value but with maturities of over
            three months.

            Loyalty program (LP)
            These programs, led by distribution retailers, consist in offering promotional offers on a product category to loyal consumers who have made a series of purchases within a
            short period of time. These promotional programs allow distributors to boost footfall in their stores and our consumers to access our products at preferential prices.

56   27/02/2020    Full-Year Results
Investor/Analyst relations   Media Relations
                    Groupe SEB                   Groupe SEB
                    Financial Communication      Corporate Communication Dept
                    and Investor Relations       Caroline Philips

                                                                                C O N TA C T S
                    Isabelle Posth
                                                 cphilips@groupeseb.com
                    Raphaël Hoffstetter
                                                 Tel: +33 (0) 6 49 82 28 45
                    iposth@groupeseb.com
                    rhoffstetter@groupeseb.com
                    Tel: +33 (0) 4 72 18 16 04
                    comfin@groupeseb.com         Image Sept
                                                 Caroline Simon
                                                 Claire Doligez
                                                 Isabelle Dunoyer de Segonzac
                                                 caroline.simon@image7.fr
                       www.groupeseb.com         cdoligez@image7.fr
                                                 isegonzac@image7.fr

                                                 Tel: +33 (0) 1 53 70 74 48

57   27/02/2020   Full-Year Results
2020 key dates
                   April 28 | after market closes     Q1 2020 sales and financial data

                                                                                                 AGENDA
                   May 19 | 3:00 p.m.                 Annual general meeting

                   July 23 | before market opens      H1 2020 sales and results

                   October 26 | after market closes   Nine-month 2020 sales and financial data

58   27/02/2020   Full-Year Results
You can also read