BTS GROUP (BTS B) AGGRESSIVE GROWTH STRATEGY IN HIGHLY FRAGMENTED MARKET WITH POSITIVE EARNINGS OUTLOOK - LINC
←
→
Page content transcription
If your browser does not render page correctly, please read the page content below
BTS GROUP
               (BTS B)
  AGGRESSIVE GROWTH STRATEGY IN
 HIGHLY FRAGMENTED MARKET WITH
    POSITIVE EARNINGS OUTLOOK

ANALYSTS: OSCAR JOHANNESSON
         PANU PIKKANEN        2018-01-28
TABLE OF CONTENTS
CONTENT                                               COMPANY DESCRIPTION
                                                      BTS is an international consultancy firm with HQ in
Investment Thesis                          4          Stockholm that develops and packages client strategies
                                                      and assists with their implementation through training
Valuation                                  5          and simulation. The company offers a wide range of
                                                      corporate training and management products; Strategy
Management & Board                         6
                                                      Execution,      Business      Acumen,         Leadership
SWOT-Analysis                              7          Development, Assessment Centers, Innovative
                                                      Leadership, Sales Transformation, and Coaching. BTS
Technical Analysis                         8          niches itself being specialized in implementation and
                                                      execution of strategies. BTS’s vision is to become “the
Appendix                                   9          global leader in accelerating strategic alignment and
                                                      execution - innovating how organizations learn,
Disclaimer                                 10         change and improve”

            VALUE DRIVERS                                               QUALITY OF EARNINGS

                        7                                                                 8
Strong and unique business model contributing to                 Steady and robust earnings. Annual sales has been
high customer retention rate. Ability to develop                 constantly growing, with the exception in 2013..
products for clients specific needs. First mover                 EBIT margin has fluctuated between 10-15% over
advantage operating on a global scale - competitors              the past ten years as well as stable profit margin -
only operates in their domestic market. Broad                    fluctuating between 6.66%-8.53%. Profits are
customer base operating in multiple different                    expected to increase significantly in 2018 as a result
industries.                                                      of lower effective tax rate.
       MANAGEMENT & BOARD                                                       LEVEL OF RISK

                       8                                                                  6
All members of BTS’s Board of Directors have                     BTS’s overall level of risk is very low. The company
multiple years of experience from senior positions at            currently has low level of debt. Although the
companies operating in different industries. Since               market for corporate training and management is
the majority of BTS’s products are developed for                 known for being sensitivity to economic conditions,
senior managers the current board should be                      BTS still manage to expand its business and remain
considered as very strong.                                       profitable during the 2008 global financial crisis.

     LINC – Lund University Finance Society | Var vänlig ta del av våra ansvarsbegränsningar i slutet av rapporten        2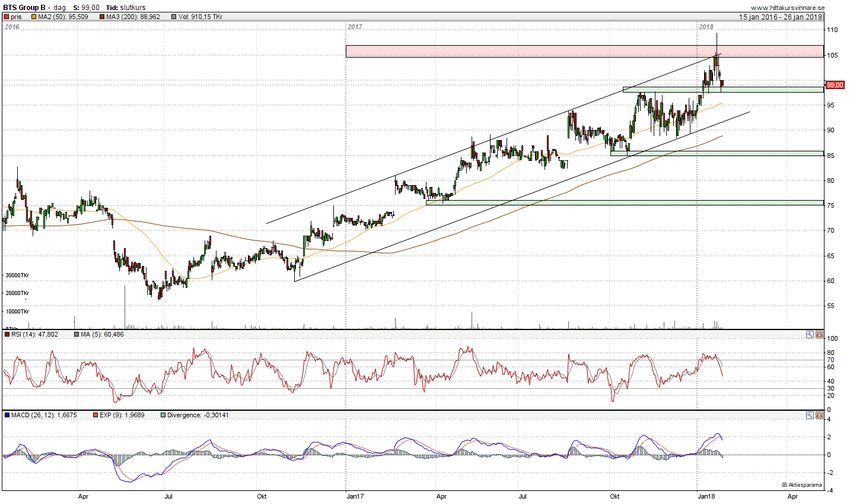
BTS GROUP (BTS B)
BTS Group is well known to those interested in value                   BTS GROUP (BTS B)
investing – and for good reason. The company has
                                                                       Stock Price (SEK)                                    99,00
positioned itself uniquely as a strategy and training
consultancy with a business model that includes licensing              52 v High/Low                            109,50 / 70,25
of the training, yielding longer customer relationships
and fixed revenue streams. They have been consistently                 Market Cap
                                                                                                                         1 785,29
profitable and lowly levered despite an active global                  (MSEK)
growth strategy that has paid off – the newest                         Net Debt (MSEK)                                   - 104,11
acquisitions in 2017 promise more of the same.
                                                                       EV (MSEK)                                         1 765,94
          Aggressive Acquisition History - Coach in a
                                                                       Sector                     Industry Goods & Services
          Box & MTAC Acquired during Q4. BTS
          recently acquired the British company Coach in a             Listed                                          Small Cap
          Box and the German based consultancy firm
                                                                       Next Report                                    2018-02-20
          MTAC GmbH. These acquisitions are expected to
          drive up revenue with approximately 12% in 2018.             STOCK PRICE

          Expected Higher Profit Margin in 2018 - U.S.
          Congress Passing G.O.P. Tax Bill. BTS
          generate about half of its total sales in the U.S. In
          December, the U.S. Congress passed a new Tax
          Bill cutting the corporate tax rate from 35% to
          21%. This new tax reform is expected to have a
          significant positive impact on BTS future earnings.
                                                                       MSEK                      2017E      2018E        2019E
          Strong Annual Growth - BTS Expected to                       Revenue                   1 214,9    1 332,6       1 461,6
          Take Additional Market Shares. BTS has
          experienced an average growth of 11% over the                Growth (%)                 9,7 %      9,7 %        9,7 %
          past ten years, which almost is three times as fast
          as the market.                                               Gross marg. (%)           11,3 %      11,3 %       11,3 %

                                                                       EBITA                      128,5      140,5        156,6
          Probability Weighted DCF Implies up to 51%
          Upside. Combining bull, base and bear scenarios              EBITA marg. (%)           10,6 %      10,5 %       10,5 %
          implies an upside of 50,74% to the current price
          even with fairly conservative assumptions,                   Net Income                  94,0      102,3        120,7
          revealing healthy potential for return.
                                                                       Profit marg. (%)           7,7 %      7,7 %        7,6 %
                Base Case Revenue and Net Debt
                                                                       EV/S                        1,5x       1,3x         1,2x
         1600                                            -105
         1400                                                          EV/EBITA                   13,7x      12,6x        11,5x
                                                         -110
         1200
                                                                       P/E                        19,7x      18,1x        16,6x
         1000                                            -115
  MSEK

                                                                MSEK

          800                                                          Net Debt/EBITA             - 0,9x     - 0,9x       - 0,8x
          600                                            -120
                                                                       Main Owners
          400
                                                         -125
          200                                                          Henrik Ekelund incl. Companies                 21,5 %
            0                                            -130          Nordea                                         16,1 %
                                                                       Lannebo Funds                                  13,1 %

                           Revenue        Net Debt
                                                                       Stefan af Petersens incl. Company              12,5 %

         LINC – Lund University Finance Society | Var vänlig ta del av våra ansvarsbegränsningar i slutet av rapporten              3
INVESTMENT THESIS
                                                         BTS has implemented an very aggressive acquisition strategy to achieve its
                 Revenue Stream
                                                         financial goal of 20% revenue annual growth while maintaining a 15% EBITA
100%                                                     margin. The company has generated an average currency-adjusted annual growth
 90%                                                     of 11% over the past ten years with an average EBITA margin at 12.3%. Out of
 80%                                                     the total growth at 11%, organic growth made up 10% whereas 1% of the growth
 70%                                                     was generated through acquisitions. BTS’s CEO Henrik Eklund stated during the
                                                         Q3 presentation that the company need to continue its aggressive acquisition
 60%
                                                         strategy to obtain its financial targets. BTS is targeting small and mid size
 50%                                                     businesses valued between 3-15 MEUR. The reasoning behind targeting small and
 40%                                                     mid size firms is due to the combination of more attractive valuations as well as
 30%                                                     the firm’s acquisition history, where BTS successfully been able to substantial
 20%                                                     gown profit margins in the acquired companies. Due to the combination of BTS’s
 10%                                                     strong financial position having cash on hand combined with its history of making
                                                         at least one acquisition a year since 2013, the likelihood for at least one additional
  0%
                                                         acquisitions in 2018 is very high.
                                                         Strong Acquisition History - Coach in a Box & MTAC Acquired during Q4
                                                         BTS acquired two companies during Q4 2017 that together are expected to drive
             Other Revenue        Licenses               up revenue with approximately 12%. Coach in a Box is UK based consultancy
                                                         company offering innovative coaching services on a global scale with offices in
             Development          Programs
                                                         the UK, Chicago, Sydney, and Singapore. The company generated 9 MGBP in
                                                         sales for its latest fiscal year with a 15% EBIT margin. Coach in a Box has been
                  Revenue Per Sector                     growing by over 25% on average annually over the past five years. MTAC GmbH
 6%                                                      is German based consultancy company offering similar services as BTS. The
                                                         company is targeting German-speaking Europe and generated 9 million Euro in
                                                         sales 2016. The very strategic acquisition of MTAC enable BTS to get access to
                        6%        17%                    the second largest consultancy market in the world, Germany
 6%           13%
                                                         BTS Expected to Take Additional Market Shares – Average Annual Growth
                                             11%
                                                         at 11% The strategy consulting sector is known for being highly fragmented as
                                                         well as relatively cyclical. Although BTS is still considered to be a small player
                                                         having less than one percent out of the total market share, the company is
                13%                    21%               expected to continue to grow faster than the market. The size of the global
                                                         strategy consultant industry is approximately $30 billion and has grown with 4%
                                                         annually. This indicates that BTS’s ten has been growing almost three times as fast
                                                         as the market. Strong GDP forecasts in BMS’s key markets; North America,
  3%                       4%                            Singapore, China, and India, make the future for BMS look very bright. The
                                                         entrance into the German market though the acquisition of MTAC gives BTS
   Financial Services            Pharma & Healthcare     access to a previously unexplored market. This could be the potential solution to
   IT & Software                 Telecome                the rising problem of decreasing profits within the BTS Europe operating unit.
   Professional Services         Retail & Distribution
   Energy                        FMCG                    Programs Expected to Generate 64% of Total Net Sales in 2017 Products
   Manufacturing                 Other                   included within the “Programs” segment is expected to continue to compromise
                                                         the greatest source of revenue for BTS in the upcoming years. Instructor-led
                                                         seminars is the main revenue generating service within the “Programs” category,
        Net Sales per Operating Unit
                                                         where BTS consultants are highly involved throughout the whole customization
                                                         process and during the delivery of the product. The 50% drop in revenue
2017E
                                                         generated within the “Licenses” segment in 2017 can be explained as the result of
2016A                                                    a change in reporting different revenue streams, where “licenses” only includes
                                                         such licensing revenue that is not included in the delivery of “software.”
2015A
                                                         U.S. Congress Passing G.O.P. Tax Bill – Game Changer for BTS Sales
2014A                                                    generated in North America is estimated to account for 49% out of net sales in
2013A                                                    2017. Based on historical values, net sales generated in the U.S. is expected to
                                                         account for approximately 50% of total sales in the upcoming years. However,
2012A                                                    U.S. Congress passing of the new G.O.P. Tax Bill cutting the corporate tax rate
                                                         from 35% to 21% is expected to have a significant positive impact on BTS future
2011A
                                                         earnings. As a result of generating almost half of its sales in the U.S, BTS’s
2010A                                                    effective tax rate has on average been 33.6%. Since the post “Effects of different
                                                         tax rates” under the Note Reconciliation of effective tax, which makes up 1/3 of
        0%     10% 20% 30% 40% 50% 60%                   the total amount of taxes paid, is mainly derived from the previous 35% tax rate in
   APG                          BTS Other Markets        America, BTS effective tax rate is expected to drop below 30% in henceforward.
                                                         The full effect of the new tax reform is not expected to become fully visible on
   BTS Europe                   BTS North America        BTS’s profit margin until the first quarter in 2018.

         LINC – Lund University Finance Society | Var vänlig ta del av våra ansvarsbegränsningar i slutet av rapporten                            4
VALUATION
Revenue and Income Forecasts Probability Weighted Discounted Cash Flow Analysis Implies 51% Upside
The company was valued using a Discounted Cash Flow analysis for three different
7000 350 scenarios, which were then weighed together according to the analysts’ estimate of
6000 300 the probability of the scenarios occurring. The final result implies an approximate
current share price of 149,23 SEK: a 50,74% upside on the January 26 price of
5000 250
MSEK Revenue
99,00 SEK.
MSEK Net Income
4000 200 Market Has Not Priced In All Potential Growth BTS’s current financials imply
3000 150 that the company’s stock is slightly overpriced based on it’s performance over the
last five years; operating costs have been growing slightly faster than revenue and
2000 100 Free Cash Flow has taken a dip due to strongly increased negative change in
1000 50 working capital, almost doubling from -27,64 MSEK to -52,32 MSEK in the 2014-
2017 period. Despite the above, the company stock is at an all time high due to
0 0
sustained growth and successful operating strategy execution, including sustenance
of growth by a combination of strong organic and inorganic growth. The hidden
value drivers are estimated to be the strong growth potential still available for
Bull Base Bear
utilization by the company, combined with strategic expansion to new markets and
the long run impact of the tax cuts in the United States. Current market value leans
P/E and EV/EBITDA Comparisons heavily on recent performance, but the company aims to almost double their
revenue growth from an average of 11% to 20% and sustain an approximate
40 20 EBITA margin of 15%. The scenario-based DCF analysis implies that the company
35 does not need to hit its goals to generate value beyond the current price – indeed,
30 15 even at a conservative estimation of the company continuing to hit parts of their
strategy execution goals the market price is undervalued.
EV/EBITDA
25
P/E
20 10 Attractive 2017E EV/EBITDA relative to Peers BTS’s estimated EV/EBITDA
15 for 2017 is estimated at 11,3x, i.e. somewhat lower than its closest peers. Based on
10 5 historical P/E and EV/EBITDA, BTS has been valued slightly higher on average
5 than both Acando and HiQ. One possible explanation to BTS’s high multiples is the
0 0 development of the company’s stock price combined with its strong financial
position, especially in retaining impressively negative net debt. This has led to a
significant increase in BTS’s EV and a highly valued stock. BTS’s share price has
increased over 35% over the last 12 months, whereas both Acando’s and HiQ’s
BTS Group Acando HiQ stock prices have barely beaten the OMX Stockholm 30 index.
BTS’s share value is justified considering the company’s historical performance and
Share Price Sensitivity to Cost of Capital and projected performance even with a fairly conservative forecast of less than 10%
Growth Rate revenue growth for the 2018-2021 period. Both Acando and HiQ as peers IT-based
Perpetual Growth Rate software consultancies, whereas BTS Group is concerned with strategic
WACC management consulting with expertise and focus on IT. BTS’s success in procuring
2,00 % 2,25 % 2,50 % 2,75 % 3,00 %
clients like Google, Accenture and Microsoft means they are more than capable of
6,00 % 168,4 177,9 188,7 201,1 215,6
gaining more market share from significantly larger operators like McKinsey.
7,00 % 139,1 145,1 151,7 159,1 167,4
Upside Will Be Sustained in Absence of Significant Cost Increase A
8,00 % 119,2 123,3 127,8 132,7 138,1
sensitivity analysis gauging the effects of rising cost of capital and fast growth reveal
9,00 % 104,8 107,8 111,05 114,5 118,3 that even strident assumptions of the cost of capital increasing to 10% eliminates
10,00 % 93,8 96,1 98,6 101,2 103,6 current upside of the investment to the stock with a small margin, which is a strong
signal that the share has untapped potential. The WACC estimate for the final
Implied Share Prices model is 6,7% based on the current leverage and equity cost estimates – the cost has
not been significantly higher historically but even allowing for a 9% WACC in
210
perpetuity means the investment would yield profit. The growth estimate for the
190 final model is a conservative 2,1%; maintaining a reasonable cost of capital is
unsurprisingly a significant driver of return.
170
Probability of Sustained Revenue Growth and a 15% EBITA Margin is High
150 The forecasted base and bear cases assume modest growth and mostly stagnant
profit margins – it would be untypical for the industry and BTS in particular to
SEK
130 stagnate with operational efficiency. To keep suitable conservativeness to avoid
110 overt optimism, however, these scenarios were given a combined probability weight
of 45%. The company goal of 20% revenue growth is high but not unlikely
90 especially in the near future due to the strategic expansion to Germany and
consistent integration track record, combined with the tax cut boon. The
70 recommendation of the analysts is therefore to invest in the stock and keep it as a
50 value stock.
Combination Bull Base Bear Actual
LINC – Lund University Finance Society | Var vänlig ta del av våra ansvarsbegränsningar i slutet av rapporten 5
MANAGEMENT & BOARD

                                         Reinhold Geijer (10,000 B Shares)
                                         Chairman of the Board of Directors
                                         Chairman of the Board of directors of BTS Group AB since
                                         2016. Other assignments include Board member of Skandia,
                                         Eterna Invest, Zacco A/S, The Sweden-American Foundation,
                                         British Swedish Chamber of Commerce. Mr. Geijer was
                                         previously CEO of The Royal Bank of Scotland´s Nordic
                                         branch 2003-2015, and also CEO Nordisk Renting AB 2001-
                                         2015. graduated in business administration at the Stockholm
                                         School of Economics.

 Henrik Ekelund (816,000 A shares, 3,189,034 B shares)
 CEO
 Henrik Ekelund is the founder of BTS and has been its CEO
 since its inception in 1986. Mr. Ekelund has comprehensive
 experience as a board member and owner of high-growth
 enterprises, including Jobline AB, Image Publications AB and
 Universum AB. Henrik Ekelund graduated in business
 administration at the Stockholm School of Economics.

                                         Stefan Brown
                                         CFO & VP
                                         Stefan Brown is the CFO and vice President of BTS Group AB.
                                         Mr. Brown has been an employee of BTS since 1990. Stefan
                                         Brown graduated from Stockholm University.

 Dag Sehlin (16,100 B share)
 Member of the Board of BTS Group AB since 2003
 Dag Sehlin has long-term experience in senior positions in the
 Swedish financial sector. Previous positions include CFO and
 deputy CEO of Posten AB, and deputy CEO of the OM Group.
 Mr. Sehlin was previously Chairman of BTS’s Board from 2003–
 2008. Dag Sehlin graduated in business administration at the
 Stockholm School of Economics.

 LINC – Lund University Finance Society | Var vänlig ta del av våra ansvarsbegränsningar i slutet av rapporten   6
SWOT-ANALYSIS

                   STRENGTHS                                                          WEAKNESSES

                               Brand                                                  Currency Exchange Exposure

                                 3                                                               3
                                                      Scalability
  Cyclicality                    2                                                               2                      Expansion
                                                                    Competition

                                 1                                                               1

                                                        Board
Diversification                                                     Sources of                                          R&D Cost
                                                                     Revenue

                         Market Position                                                    Market Power

                OPPORTUNITIES                                                           THREATS

                     International Expansion                                               Labour Cost

                                 3                                                               3
                                                       Market Growth
Tax Reforms                     2                                                                2
                                                                    Competition                                          Cyclicality

                                 1                                                               1

                                                       M&A Environment
   Synergies                                                                                                            Legal
                                                                        Regulations

                        First Mover Advantage                                             Currency Exposure

        LINC – Lund University Finance Society | Var vänlig ta del av våra ansvarsbegränsningar i slutet av rapporten            7
TECHNICAL ANALYSIS
The technical analysis will be performed to predict the future price
movement for two different time horizons. First a short-term perspective will Current Price
be analyzed which is one month ahead, then the short-term will be followed by a 99,00 SEK
longer perspective which will chart the following year.
An analysis of the upcoming month indicates that the stock will have a RSI (14)
positive development as it trades within the trend channel and has found a solid 47,8
support at 97,4 SEK, which has been tested at 4 various occasions. The MACD
has recently crossed its signal line from above which indicates a negative shift in Trading Range
momentum, but it does not have to affect the stock since the RSI has gone from
oversold to normal territory and a bounce on the support has recently been made.
97,4/109,5 SEK
If the stock oscillates around the current price level an upward surge towards the
all time high is possible. Support/Resistance
98,8/104,5 SEK
The outlook for the following year is positive as well, the stock is trading
within its positive trend channel and above both the 50-day moving average and
the 200-day moving average. Both of the moving averages are following the same
Stop Loss
upward pattern which indicates that the trend will persist. 104,5 SEK could act as 89 SEK
a strong resistance level since it is the all time high, but in the past months the
stock has followed a convincing positive trend and therefore broken several Short Term View
resembling resistances. Positive
Long Term View
Positive
Analyst: Felix Eriksson
LINC – Lund University Finance Society | Var vänlig ta del av våra ansvarsbegränsningar i slutet av rapporten 8APPENDIX I
Bull Forecast Growth FY2014A FY2015A FY2016A FY2017E FY2018E FY2019E FY2020E FY2021E
Revenue 20,00 % 781,45 1 043,90 1 107,64 1 329,17 1 595,01 1 914,01 2 296,81 2 756,17
Operating Expenses excl.
20,00 % (690,04) (922,47) (982,12) (1 119,62) (1 343,54) (1 612,25) (1 934,70) (2 321,64)
D&A
EBITDA 91,42 121,43 125,52 209,55 251,47 301,76 362,11 434,53
Depreciation 15,00 % (6,42) (7,63) (8,02) (9,23) (10,61) (12,20) (14,03) (16,14)
EBITA 85,00 113,80 117,50 200,33 240,86 289,56 348,08 418,40
Amortisation 18,00 % (2,61) (4,35) (5,80) (6,85) (8,08) (9,53) (11,25) (13,27)
EBIT 82,39 109,45 111,70 193,48 232,78 280,03 336,83 405,12
Financial Gain (Loss) 0,50 (0,26) (0,79) - - - - -
Income Before Taxes 82,89 109,19 110,91 193,48 232,78 280,03 336,83 405,12
Income Tax Expense (26,81) (36,64) (37,09) (40,63) (48,88) (58,81) (70,73) (85,08)
Net Income 20,29 % 56,09 72,55 73,82 152,85 183,89 221,22 266,10 320,05
Base Forecast Growth FY2014A FY2015A FY2016A FY2017E FY2018E FY2019E FY2020E FY2021E
Revenue 9,68 % 781,45 1 043,90 1 107,64 1 214,91 1 332,56 1 461,60 1 603,14 1 758,38
Operating Expenses excl.
9,68 % (690,04) (922,47) (982,12) (1 077,19) (1 181,46) (1 295,83) (1 421,26) (1 558,84)
D&A
Gross Margin excl. D&A 11,70 % 11,63 % 11,33 % 11,34 % 11,34 % 11,34 % 11,34 % 11,35 %
EBITDA 91,42 121,43 125,52 137,72 151,09 165,77 181,87 199,54
Depreciation of PP&E 14,86 % (6,42) (7,63) (8,02) (9,22) (10,58) (12,16) (13,96) (16,04)
EBITA 85,00 113,80 117,50 128,50 140,51 153,61 167,91 183,50
Amortisation 18,99 % (2,61) (4,35) (5,80) (6,90) (8,21) (9,77) (11,63) (13,84)
EBIT 82,39 109,45 111,70 121,60 132,30 143,84 156,28 169,66
Financial Gain (Loss) 0,50 (0,26) (0,79) 0,50 0,50 0,50 0,50 0,50
Income Before Taxes 82,89 109,19 110,91 122,10 132,80 144,34 156,78 170,16
Income Tax Expense (26,81) (36,64) (37,09) (28,08) (30,54) (33,20) (36,06) (39,14)
Net Income 8,65 % 56,09 72,55 73,82 94,02 102,25 111,14 120,72 131,02
Bear Forecast Growth FY2014A FY2015A FY2016A FY2017E FY2018E FY2019E FY2020E FY2021E
Revenue 3,00 % 781,45 1 043,90 1 107,64 1 140,87 1 175,10 1 210,35 1 246,66 1 284,06
Operating Expenses excl.
3,00 % (690,04) (922,47) (982,12) (1 011,58) (1 041,93) (1 073,19) (1 105,39) (1 138,55)
D&A
EBITDA 91,42 121,43 125,52 129,29 133,17 137,16 141,28 145,52
Depreciation 15,00 % (6,42) (7,63) (8,02) (9,23) (10,61) (12,20) (14,03) (16,14)
EBITA 85,00 113,80 117,50 120,06 122,56 124,96 127,24 129,38
Amortisation 18,00 % (2,61) (4,35) (5,80) (6,85) (8,08) (9,53) (11,25) (13,27)
EBIT 82,39 109,45 111,70 113,22 114,48 115,43 116,00 116,11
Financial Gain (Loss) 0,50 (0,26) (0,79) (1,00) (1,00) (1,00) (1,00) (1,00)
Income Before Taxes 82,99 109,30 111,01 112,22 113,48 114,43 115,00 115,11
Income Tax Expense (26,81) (36,64) (37,09) (28,05) (28,37) (28,61) (28,75) (28,78)
Net Income 0,64 % 56,09 72,55 73,82 84,16 85,11 85,82 86,25 86,33
LINC – Lund University Finance Society | Var vänlig ta del av våra ansvarsbegränsningar i slutet av rapporten 9DISCLAIMER
Ansvarsbegränsning
Analyser, dokument och all annan information som härrör från LINC Research & Analysis (LINC
R&A) är framställt i informationssyfte och är inte avsett att vara rådgivande. LINC är en ideell
organisation (organisationsnummer 845002-2259) och analyser eller annan information som härrör
från LINC R&A ska inte betraktas som investeringsrekommendationer.
Informationen i analysen är baserad på källor, uppgifter och personer som LINC R&A bedömer
som tillförlitliga, men LINC R&A kan aldrig garantera riktigheten i informationen. Den
framåtblickande informationen i analysen baseras på subjektiva bedömningar om framtiden, vilka
alltid är osäkra och därför bör användas försiktigt. LINC R&A kan aldrig garantera att prognoser
och framåtblickande estimat kommer att bli uppfyllda. Om ett investeringsbeslut baseras på
information från LINC R&A eller person med koppling till LINC R&A, så fattas dessa alltid
självständigt av investeraren. LINC R&A frånsäger sig därmed allt ansvar för eventuell förlust eller
skada av vad slag det än må vara som grundar sig på användandet av analyser, dokument och all
annan information som härrör från LINC R&A.
Intressekonflikter och opartiskhet
För att säkerställa LINC R&A’s oberoende har LINC R&A inrättat interna regler, utöver detta så
är alla studenter som skriver för LINC R&A skyldiga att redovisa alla eventuella intressekonflikter.
Dessa har utformats för att säkerställa att Finansinspektionens föreskrifter och allmänna råd om
investeringsrekommendationer riktade till allmänheten samt hantering av intressekonflikter (FFFS
2005:9) efterlevs. Material från LINC R&A ska aldrig betraktas som
investeringsrekommendationer.
Om skribent har ett innehav där en intressekonflikt kan anses föreligga, redovisas detta i
informationsmaterialet.
Övrigt
LINC R&A har ej mottagit betalning eller annan ersättning för att göra analysen.
Upphovsrätt
Denna analys är upphovsrättsskyddad enligt lag och är LINC R&A’s egendom (© LINC R&A
2017).
LINC – Lund University Finance Society | Var vänlig ta del av våra ansvarsbegränsningar i slutet av rapporten 10You can also read