FY21 RESULTS Growth Strategy Delivering Improved Earnings - Quinton Hildebrand, CEO - AFR
←
→
Page content transcription
If your browser does not render page correctly, please read the page content below
FY21 RESULTS
Growth Strategy Delivering Improved Earnings

               Quinton Hildebrand, CEO
                   Alan Boyd, CFO
             Richard Betts, CFO Designate
                     25 August 2021
FY21 HIGHLIGHTS
Improvement in all financial metrics

  EBITDA                           NPAT               Health and safety performance
     (underlying)                  (reported)         • Resilience to COVID-19 challenges
                                                      • Maintained focus on safety: 2.38 LTIFR (pcp 1.41)

  $69m                             $25m               Strong earnings and cash generation
   +16% YOY growth                 pcp loss $11m      • Growth Strategy driving earnings growth (16%YOY)
                                                      • Inventory reduction of $23m
Operating
Cash                                                  Balance Sheet addressed

Flow                 $82m                +43% YOY
                                                      • Disciplined capital management
                                                      • Net debt reduction of $64m

                                                      Driving shareholder value
Leverage             ROFE           Dividend          • Return on funds employed of 8.6%
                                                      • Dividend payments resumed

 1.2x 8.6% 2.0cps
  pcp 2.6x            pcp (4.2)%       100% franked                                                         2
                                                                                                                2
Financial Results.
       Strong operating
       performance.

RIDLEY | FY21 RESULTS | 25 AUGUST 2021
PROFIT & LOSS SUMMARY

  Consolidated Result - in ($m)                                    FY21           FY20         Analysis of result

  EBITDA - Bulk Stockfeeds                                         32.5            34.3        See Segment Performance Reporting (slide 8)

  EBITDA - Packaged Feeds and Ingredients                          46.5            35.1        See Segment Performance Reporting (slide 9)

  EBITDA – Ongoing operations before significant items             79.0            69.4               Up $9.6m, or 13.8% on prior year period.

  Corporate Costs                                                  (9.9)           (9.9)       Consistent between reporting periods.

  Consolidated EBITDA before individually significant items        69.1            59.5               Up $9.6m, or 16.1% up on prior year period.

  Individually significant items before income tax                   -           (44.3) 1      Prior year restated by $1.1m for SaaS accounting policy change

  Consolidated EBITDA                                              69.1            15.2               Up $53.9m following prior year business restructure

  Depreciation and amortisation                                   (29.6)          (26.2)       Depreciation of new Wellsford feedmill, opened in August 2020.

  Consolidated EBIT                                                39.5           (11.0)              Up $50.5m.

  Net Finance costs                                                (4.5)           (5.8)       Commensurate with lower debt levels and lower interest rates.

  Income Tax (expense) / benefit                                  (10.1)           6.0 1       Tax effective rate of 28.8%.

  Net profit and total comprehensive income                        24.9           (10.8)              Up $35.7m

 1   FY20 P&L restated for Software-as-a-Service (SaaS) change of accounting policy (refer slide p27).

                                                                           The Directors believe that the presentation of the unaudited non-IFRS financial information on this slide is
RIDLEY | FY21 RESULTS | 25 AUGUST 2021                                     useful for users of the accounts as it reflects the underlying profits of the business.                    4
BALANCE SHEET
                                         June            June
  Balance Sheet - in $m                                             Analysis of balances and movements
                                         2021            2020
  Cash & cash equivalents                39.9             45.8      Balance is a function of timing of receipts/payments and draw down/repayment of bank funding.
                                                                    $22.6m reduction in inventory through effective management and reduction of COVID-19
  Inventory                              81.9            104.5
                                                                    contingency holdings.
  Receivables                            113.6           111.7      Debtor days maintained at 33-36 days sales outstanding.
  Assets available for sale              46.1             0.2       Assets reclassified comprise Westbury, Bendigo, Murray Bridge and Mooroopna sites.
  Total Current Assets                   281.5           262.2
  Property, plant and equipment &                                   Movement includes finalisation of construction and commissioning of new feedmill at Wellsford less
                                         320.7          368.1 1
  Intangibles                                                       transfer of Westbury site to Current Asset held for sale.
  Other Non-current Receivables          10.8             14.3      Comprises deferred prior year land sale proceeds of $1.4m due in July 2022.
  Total Assets                           613.0          644.6
  Current payables                       165.5          161.3       Reflects timing of creditor payments within agreed trading terms.
  Current borrowings                       -            193.0       Accounting standard requirement to report borrowings as current as noted in 2020 Annual Report.
                                                                    Includes provision for site closure and maintenance costs of $2.4m (FY20: $6.4m) plus current
  Current Other                          27.4            25.6
                                                                    employee entitlements of $14.9m.
                                                                    Gross debt of $123.0m reflects a $70.0m retirement in FY21, with a $64.1m net debt reduction
  Non-current borrowings                 123.0             -
                                                                    reported after adjustment for movement in cash balances.
                                                                    Movement reflects rollover/ extension for a number of property and plant leases payable beyond 12
  Other Non-current liabilities           9.6             5.2
                                                                    months of balance date, plus long service leave entitlements.

 1Total
   FY20Liabilities
        Non-current  assets restated.    325.5          385.1
  Net Assets / Equity                    287.5          259.5

RIDLEY | FY21 RESULTS | 25 AUGUST 2021         1                                                                                                                         5
                                                   FY20 restated.
CASH MANAGEMENT & NET DEBT

 The increased earnings, a reduction in inventory and disciplined                                                 Net Debt
 capital expenditure management has generated an operating cash
 flow of $82.4m at cash conversion ratio of 119%.
                                                                                                                               $64M
                                                                                               160

 This has resulted in a $64m reduction in net debt and a leverage ratio                        140                              Earnings,
                                                                                                                             working capital
 of 1.2x. The sale of Westbury on 2 August ’21 will reduce debt further.                                                      reduction and
                                                                                               120
                                                                                                                             capex discipline
 Consolidated Cash flow -
                                FY21      FY20
                                                         Inventory back to                     100
                                                          pre-Covid levels                                                                        $55M
 in $m
 EBITDA Before Significant

                                                                                          $M
 Items                          $69.1    $59.5                                                  80                                                Proceeds from
                                                        120
                                                                                                                                                       sale of
 Decrease / (Increase) in                                                                                                                           Westbury
 Working Capital                $21.2    ($7.5)         100                                     60
                                                                                                                                                 facility received
                                                                                                                                                   2 August ‘21
 Less Maintenance Capital       ($7.9)   ($12.2)         80
                                                                                                40
                                                   $M

 Operating Cashflow before                               60
                                $82.4    $39.8
 significant items
                                                                                                20
 Operating cashflow                                      40
 conversion                     119%      67%
                                                                                                 0
 (before significant items)                              20                                               FY20                FY21              Aug-21

  1   FY20 restated.                                      0                                 The Directors believe that the presentation of the unaudited non-IFRS
                                                              FY18   FY19   FY20   FY21    financial information on this slide is useful for users of the accounts as
RIDLEY | FY21 RESULTS | 25 AUGUST 2021                                                                         it reflects the underlying cash flows of the business.   6
Segment
       Performance.
       New reporting segments
       from 1 July 2020.

RIDLEY | FY21 RESULTS | 25 AUGUST 2021
BULK STOCKFEEDS
 Comprising the Group’s premium quality, high performance animal nutrition
 stockfeed solutions delivered in bulk.

                                                                                               FY21        FY20 1     Variance
• A stronger performance in 2H as higher asset utilisation
                                                                  EBITDA before significant
  has lowered the operating cost base through:                                                 32,481      34,331           5%
                                                                  items

      • Volume growth in pig and poultry sectors.
                                                                  EBIT                         16,210      19,585           17%
      • Seamless transition to the new Wellsford feed mill and
         closure of the former Mooroopna feed mill in 2H. Full
         value of investment in Wellsford will be seen in FY22.   Segment Assets               258,618    267,009

• Beef and sheep sales remain below the record “drought           Segment Liabilities         (132,316)   (126,426)

  feeding” levels of FY20 with the return to normal on-farm
                                                                  Segment net assets          126,302     140,583           10%
  pasture.
                                                                  EBITDA ROFE                  25.7%       24.4%            5%

                                                                  1   FY20 restated.

                                                                                                                        8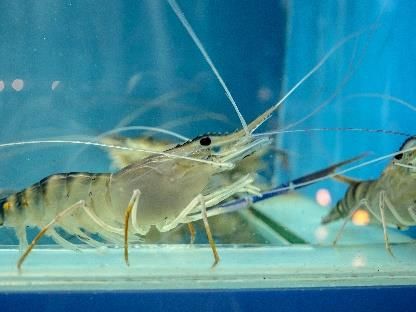
PACKAGED FEEDS & INGREDIENTS
    Comprising the Group’s premium quality, high performance animal nutrition feed and ingredient solutions
    delivered in packaged form from 1 tonne bulka bag down to 3kg bags, and includes the Aquafeed Business Unit.

• Significant increase in rendering returns attributable equally to:
                                                                                                                FY21      FY20 1     Variance
       • Sustainable yield improvements / product premiumisation; and

       • Higher market pricing for rendered oils and meals.                  EBITDA before significant items   46,507     35,164         32%

• Strong contribution from branded packaged sales in the                     EBIT                              33,165     23,763         39%
    traditional rural distribution channels and new product lines into
    the urban pet specialty chains.
                                                                             Segment Assets                    305,374    302,660
•   Aquafeed margins were impacted as we sought to grow
                                                                             Segment Liabilities               (60,086)   (59,549)
    volumes in a market with surplus feed production capacity.
                                                                             Segment net assets                245,288    243,111         1%
• Includes a small loss from Novacq™ following commencement
                                                                             EBITDA ROFE                       19.0%      14.5%          31%
    of commercial operations for the Thailand site from 1 July 2020.
                                                                         1   FY20 restated

                                                                                                                                                9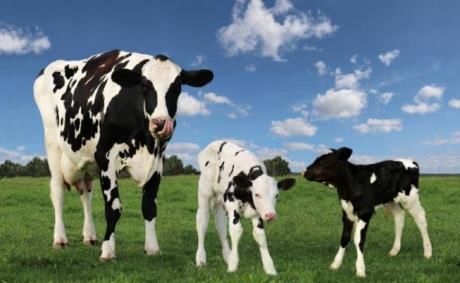
Growth Strategy.
       A focus on improvements in
       core business, whilst
       growing sales.

RIDLEY | FY21 RESULTS | 25 AUGUST 2021
GROWTH STRATEGY
A focus on improvements in core business, whilst growing sales
EARNINGS GROWTH POTENTIAL
• NovacqTM operational efficiencies
• NovacqTM international sales
EXPANSION / • New range of Packaged Products
INNOVATION
• Rendering product development
• Acquisitions
• Westbury utilisation / Aquafeed reset
SALES
• Prawn growth
GROWTH • Reseller consolidation
• Dairy penetration
• Monogastric growth
• Equine share
• Murray Bridge feedmill closure
• Internal restructure
• Simplification
• Northern Victoria footprint review
OPTIMISATION • Procurement savings
• Raw material sourcing
• Supply chain rationalisation
• Portfolio review
Demand for proteins
FOUNDATION Expanding customers
Scale operator
Nutritional expertise
FY20 FY21 FY22
Yet to commence
Note: Growth Strategy does not include any of the newly launched Project Boost initiatives Partially executed
Completed
RIDLEY | FY21 RESULTS | 25 AUGUST 2021 11GROWTH STRATEGY
EXPANSION / INNOVATION – Earnings Growth Contributors in FY22
Rendering New Range of Novacq™
Product Packaged
Development products
Progress in production efficiencies
Tripled production from same
footprint in FY21
$4m plant commissioning in • Launched “Food for Dogs” in Sales
1H FY22 producing land animal pet specialty stores in April Launch of new prawn diet this
protein concentrates. season
• Cobber range into rural • Better growth
Benefits:
grocery from 1H FY22 • Better health/survival
• Fish meal replacement for
aqua industry • Lower reliance on marine protein
• Commencing supply of
• Improved digestibility for • Reduced nitrogen discharge
grocery house brands in FY22
premium pet food
Break-even projected
for FY22
RIDLEY | FY21 RESULTS | 25 AUGUST 2021 12GROWTH STRATEGY
SALES GROWTH – Earnings Growth Contributors in FY22
Monogastric* Aquafeed
Growth Reset
• Increasing market share with pig • Narangba facility expansion (+20%)
successfully completed 19 July 2021
and poultry customers
• Increased asset utilisation with • Westbury facility sold 2 August 2021
marginal costing benefit
• Benefits:
• New Wellsford mill transitioning
• higher volumes at Narangba lowers
to 7-day operation from
operating costs/tonne
September • eliminates loss making / under-
utilised operation at Westbury
10% volume growth
(July ‘21 v July ‘20) Forecast FY22 benefit of
* 80% of Bulk Stockfeed volume $2M EBITDA and
RIDLEY | FY21 RESULTS | 25 AUGUST 2021 $2.7M reduction in DA 13GROWTH STRATEGY
OPTIMISATION – Earnings Growth Contributors in FY22
Supply Raw Material
Chain Sourcing
Rationalisation
Ridley Direct
Establishing an ingredients sales desk
Specialists engaged to: selling to livestock producers who mix feed
• improve scheduling and asset utilization
on farm:
• reduce current $44m freight /storage costs • targeting new customers outside of our current
• reduce working capital
network
• maintain 97% DIFOT • leveraging our procurement scale
• adding value with our nutrition expertise
Targeting quick wins to deliver Targeting equivalent of 5% of Bulk
benefits in 2H FY22 Stockfeeds weekly volume by FY23
RIDLEY | FY21 RESULTS | 25 AUGUST 2021 14CAPITAL ALLOCATION FRAMEWORK
Embedding greater discipline
Operating Cashflow The Capital Allocation
Framework:
• prioritises maintenance & ESG capital
Maintenance & ESG Capital (FY22 $12m) and working capital
and Working Capital requirements;
• supports the growth strategy through
Strong Balance Sheet - the need for a strong balance sheet;
Conservative Net Debt / EBITDA
- delivering returns to shareholders; and
- pursuing future growth opportunities.
Dividends Organic Growth / M&A
Restructuring
% of NPAT
Disciplined assessment
against strategy,
Delivered in FY21:
(before significant items) Prioritised on ROFE
capability and ROFE • The resumption of dividends
• Net debt reduced to 1.2x (pre Westbury
Maximise Shareholder Value
sale)
Measured by TSR
• TSR of 57%
RIDLEY | FY21 RESULTS | 25 AUGUST 2021 15PROJECT BOOST
A capital reinvestment program to drive profitable growth
$15M
A collection of smaller (less than $2.5m)
capital projects have been identified
that will extend Ridley’s product
FY22-23 Targeted Capital Expenditure offering, debottleneck capacity and
reduce cost:
$9M Investment in
new capability
De-bottlenecking
operations to
Improving
operational
Annualised earnings boost in: increase: efficiency by:
• Premium pet food • Feedmill capacity to • Installing equipmentSUMMARY
Business gaining momentum
• Progress in safety, operational performance and asset utilisation
• Cash generation and earnings growth (14.1% CAGR¹)
• Strong balance sheet (Outlook.
On track to deliver improved
earnings.
RIDLEY | FY21 RESULTS | 25 AUGUST 2021OUTLOOK
The FY20 restructure established a new platform to drive accountability and
operational efficiencies whilst ensuring a more customer orientated company. This has
created sustainable improvements in the underlying performance of the business
which continues to gain in momentum.
Ridley considers it is well placed to grow earnings and cash in the year ahead through:
• continued momentum in the underlying business segments
(including strong EBITDA performance through the first 7 weeks of FY22);
• the ongoing delivery of the Growth Strategy; and
• the expected returns from Project Boost.
The developing Capital Allocation Framework is aimed at delivering
attractive shareholder returns, whilst maintaining a strong balance
sheet and supporting business growth.
RIDLEY | FY21 RESULTS | 25 AUGUST 2021 19IMPORTANT NOTICE AND
DISCLAIMER
Disclaimer
The material in this presentation is general background information about the activities of Ridley Corporation Limited
and its related entities (Ridley), current at the date of this presentation, unless otherwise stated.
The content is information given in summary form and does not purport to be complete. It should be read in
conjunction with Ridley’s other periodic and continuous disclosure announcements lodged with the Australian
Securities Exchange, which are available at www.asx.com.au. This presentation is not intended to be relied upon as
advice to investors or potential investors and does not take into account the investment objectives, financial situation
or needs of any particular investor.
Forward looking statements in this presentation should not be relied upon as an indication or guarantee of future
performance, and they involve known and unknown risks, uncertainties and other factors, many of which are beyond
the control of Ridley.
RIDLEY | FY21 RESULTS | 25 AUGUST 2021 20Appendix Supporting information
PROFIT & LOSS SUMMARY

   Consolidated Result - in ($m)         FY21     FY20       Analysis of FY22 Budget                                                                            FY19               FY18              FY17

   EBITDA – Ongoing operations before
   significant items
                                         79.0      69.4           Up $9.6m, or 13.8% on prior year period.                                                        59.4              60.8               61.0

   Corporate Costs                       (9.9)     (9.9)     Consistent between reporting periods.                                                               (11.3)             (9.5)             (9.9)

   Consolidated EBITDA before
   significant items
                                         69.1      59.5           Up $9.6m, or 16.1% up on prior year period.                                                     48.1              51.3               51.1

   Significant items before income tax     -      (44.3) 1   Prior year restated by $1.1m for SaaS 2 accounting policy change                                     6.2               (4.2)              2.2

   Consolidated EBITDA                   69.1      15.2           Up $53.9m following prior year business restructure                                             54.3              47.1               53.3

   Depreciation and amortisation         (29.6)   (26.2)     Depreciation of new Wellsford feedmill, officially opened in July 2020.                             (18.9)            (17.3)            (15.2)

   Consolidated EBIT                     39.5     (11.0)          Up $50.5m.                                                                                      35.4              29.8               38.1

   Net Finance costs                     (4.5)     (5.8)     Commensurate with lower debt levels and lower interest rates.                                       (5.0)              (4.6)             (5.0)

   Income Tax benefit / (expense)        (10.1)    6.0 1     Tax effective rate of 28.8%.                                                                        (6.8)              (7.8)             (7.3)

   Net (loss) / profit                   24.9     (10.8)          Up $35.7m                                                                                      23.6               17.4              25.8

   Other comprehensive income / (loss)     -        0.1                                                                                                          (0.4)               0.5                 -

   Total Comprehensive (Loss) /
                                         24.9     (10.7)          Up $35.6m                                                                                      23.2               17.9              25.8
   Income
 1 FY20 P&L restated.
 2 Software-as-a-Service (SaaS)

                                                                                                     The Directors believe that the presentation of the unaudited non-IFRS financial information on
                                                                                                     this slide is useful for users of the accounts as it reflects the underlying profits of the business.
RIDLEY | FY21 RESULTS | 25 AUGUST 2021                                                                                                                                                                        22
BALANCE SHEET
Assets
June June June Jun Jun
Balance Sheet - in $m Analysis of balances
2021 2020 2019 2018 2017
Balance is a function of timing of receipts/payments and draw down/repayment of bank
Cash & cash equivalents 39.9 45.8 17.5 23.4 16.5
funding.
$22.6m reduction in inventory through effective management and reduction of COVID-
Inventory 81.9 104.5 83.8 76.7 83.7
19 contingency holdings.
Receivables & Other debtors
113.6 111.7 Debtor days consistently maintained at 33-36 days sales outstanding. 108.2 104.0 116.2
and prepayments
Assets available for sale 46.1 0.2 Assets reclassified comprise Westbury, Bendigo, Murray Bridge and Mooroopna sites. 0.2 1.1 -
Other - tax asset - - Tax refund receivable after payment of tax instalments. - 3.0 0.4
Total Current Assets 281.5 262.2 209.7 208.2 216.8
Investment property - - Former salt field land at Lara and Moolap all now divested. 1.3 1.3 3.2
Movement includes finalisation of construction and commissioning of new feedmill at
Property, plant and equipment 244.8 293.1 1 259.3 202.6 182.8
Wellsford less transfer of Westbury site to Current Asset held for sale.
Investment in Thai feedmill consolidated during FY19 following acquisition of remaining
Investments - equity accounted - - 0.7 1.1 1.3
51% shareholding interest therein.
Available for sale financial asset - - Available for sale asset sold during FY19. 1.7 2.3 1.3
Intangibles 75.9 75.0 Movement for the period reflects minor additions offset by amortisation charge. 85.7 82.5 79.3
Non-current Receivables 1.4 1.7 Comprises deferred prior year land sale proceeds of $1.4m due in July 2022. 11.7 8.6 0.8
Other non-current assets 9.4 12.6 1 Deferred tax asset. 3.7 3.6 5.1
Total Assets 613.0 644.6 573.8 510.3 490.6
1 FY20 Non-current assets restated.
RIDLEY | FY21 RESULTS | 25 AUGUST 2021 23BALANCE SHEET
Liabilities
June June June June June
Balance Sheet - in $m Analysis of balances
2021 2020 2019 2018 2017
Current payables 165.5 161.3 Reflects timing of creditor payments within agreed trading terms. 158.8 155.9 148.6
Includes provision for site closure and maintenance costs of $2.4m (FY20: $6.4m) plus
Current provisions 17.3 21.1 16.0 14.6 13.5
current employee entitlements of $14.9m.
Current tax liabilities 5.8 0.4 Year end tax payable liability at 30 June 2021. 2.0 - -
Current Lease liabilities 4.3 4.1 Current portion of lease liability payable within 12 months of balance date. - - -
Gross debt of $123.0m reflects a $70.0m retirement in FY21, with a $64.1m net debt
Non-current borrowings 123.0 193.0 2 118.9 76.2 68.1
reduction reported after adjustment for movement in cash balances.
Non-current Payables,
Movement reflects rollover/ extension for a number of property and plant leases payable
Lease liabilities & 9.6 5.2 0.5 0.5 0.6
beyond 12 months of balance date plus long service leave entitlements.
Provisions
Total Liabilities 325.5 385.1 296.2 247.2 230.8
Net Assets / Equity 287.5 259.5 1 277.5 263.1 259.8
1 FY20 Equity restated.
2 Reported in FY20 as Current Borrowings
RIDLEY | FY21 RESULTS | 25 AUGUST 2021 24CASH FLOW
Consolidated Cash flow - in $m FY21 FY20 Analysis of movement FY19 FY18 FY17
Consolidated EBIT 39.5 (11.0) 1 Consolidated EBIT after significant items. 35.4 26.4 39.2
Depreciation and amortisation 29.6 26.2 P&L charges for the year. 18.9 17.3 15.2
Consolidated EBITDA 69.1 15.2 Consolidated EBITDA after $43.2m of significant items. 54.3 43.7 54.4
Non-cash impairment - 22.8 Non-cash impairment of NovacqTM and Moolap investment property. - - -
Movement in working capital 21.2 (7.5) Reduction in working capital consistent with inventory movement. (7.3) 15.3 (2.6)
FY21 reflects expensing of $3.6m of Capital work in progress under new SaaS
Maintenance capex (7.9) (12.2) 1 (13.3) (15.1) (14.2)
accounting policy.
Operating cash flow 82.4 18.3 33.7 43.9 37.6
Major portfolio refresh concluded with commissioning of Wellsford feedmill in July
Development capex (10.4) (42.9) (60.0) (21.1) (19.6)
2020.
Payment for Intangibles (2.4) (4.5) Payments for commercial contracts and assets under development. (5.5) (4.3) (3.6)
Dividends paid - (10.9) No dividends paid in FY21 (FY20 final dividend of 2.75cps settled in cash). (8.6) (12.9) (12.2)
Issue of share capital - 2.4 FY20 capital issued under the Dividend Reinvestment Plan. - - -
Proceeds from sale of assets 5.4 5.7 Proceeds from sale of Lara & Moolap properties after legal and commission costs. 5.0 5.4 13.5
Net finance costs (4.0) (6.2) Commensurate with lower debt levels and lower interest rates. (5.7) (4.6) (5.5)
Net tax payments (1.7) (4.3) Progressive tax instalments and settlement of prior year liability. (1.7) (5.9) (14.7)
Payment of lease liabilities (5.0) (5.0) Actual lease payments made under AASB16 from 1 July 2019. - - -
Other net cash inflows / (outflows) (0.2) 1.6 Includes share-based payments. (5.8) (1.6) (6.0)
Cash inflow / outflow for the year 64.1 (45.8) (48.6) (1.2) (10.5)
Opening net debt as at 1 July (147.2) (101.4) (52.8) (51.6) (41.1)
Closing net debt (83.1) (147.2) (101.4) (52.8) (51.6)
1 FY20 EBIT and Maintenance capex restated. The Directors believe that the presentation of the unaudited non-IFRS financial information on this
RIDLEY | FY21 RESULTS | 25 AUGUST 2021 25
slide is useful for users of the accounts as it reflects the underlying cash flows of the business.NET DEBT, GEARING AND LEVERAGE
Major capital projects – in $m FY21 FY20 Analysis of movements FY19 FY18 FY17
FY20 reflects completion of Westbury extrusion plant and
Development capital expenditure 10.4 42.9 60.0 21.1 19.6
bulk of construction costs for Wellsford feedmill.
FY21 reflects expensing of $3.6m of Capital work in
Maintenance capital expenditure 7.9 12.2 1 13.3 15.1 14.2
progress under new SaaS accounting policy.
Net debt and gearing - in $m FY21 FY20 Analysis of movements FY19 FY18 FY17
Gross debt 123.0 193.0 $70m of gross debt retired in FY21. 118.9 76.2 68.1
Cash balance is an outworking of working capital & debt
Less: cash and cash equivalents 39.9 45.8 17.5 23.4 16.5
retirement.
Reported net debt 83.1 147.2 $64.1m net debt retired in FY21. 101.4 52.8 51.5
Total equity 287.5 259.5 1 Total Equity per Consolidated Balance Sheet. 277.5 263.1 259.8
Gearing: Net Debt: Closing Equity 28.9% 56.7% Traditional gearing ratio 36.5% 20.0% 19.8%
Gearing per banking covenant 30.0% 42.6% Gross debt : [ Gross debt plus Closing Equity ] 2 30.0% 22.4% 20.8%
Leverage ratio 2 - in $m FY21 FY20 Analysis of movements FY19 FY18 FY17
FY20 waiver before Individually Significant Items capped
Last 12 months EBITDA 69.1 59.5 1 54.2 43.8 54.5
to $56.0m.
Leverage ratio - actual 1.20 2.63 1 2.05x headroom on FY21 facility threshold of 3.25x. 1.87 1.20 0.94
1 FY20 Equity, Maintenance capex and EBITDA restated.
2 Calculated as Net debt / Last 12 months EBITDA per banking facility covenant calculations.
The Directors believe that the presentation of the unaudited non-IFRS financial information on this
RIDLEY | FY21 RESULTS | 25 AUGUST 2021 26
slide is useful for users of the accounts as it reflects the underlying debt profile of the business.FY20 RESTATEMENT : SaaS
Change of accounting policy
Cloud Computing Criteria
The customer does not have possession of the underlying software.
Software accessed and used over the internet.
Increasingly common, cost-effective platform for new software applications,
such as end to end Enterprise Resource Planning (ERP) systems.
Accounting treatment Application to Ridley
ERP systems traditionally capitalised as an Intangible Currently in late stages of new cloud-based ERP
asset on the balance sheet and amortised to Profit implementation with $3.6m of FY21 Capital work in
and Loss over effective useful life. progress now reported as Individually Significant Item
(ISI) of expense before tax.
New and mandatory interpretation from IFRS Restatement of FY20 result to expense $1.1m of pre-
Interpretations Committee (IFRIC) is to expense costs tax project costs from Capital work in progress.
for use, data conversion & migration, customisation, Flow through of the new policy to project Go-Live
training & testing. commissioning in 1H FY22.
No change to cash outflows.
Change in accounting policy is required where Transparency provided through consistent disclosure
applicable. as an ISI.
RIDLEY | FY21 RESULTS | 25 AUGUST 2021 27Contact details Quinton Hildebrand Chief Executive Officer E: Quinton.Hildebrand@ridley.com.au P: +61 3 8624 6529 Ridley Corporation Limited ABN 33 006 708 765 Level 4, 565 Bourke Street Melbourne, VIC. 3000 Australia ridley.com.au ASX: RIC
You can also read