Presentation of Results - May 6, 2021 - Sacyr
←
→
Page content transcription
If your browser does not render page correctly, please read the page content below
Rumichaca Pasto, Colombia

Presentation of Results      May 6, 2021
1Q 2021                          sacyr.com
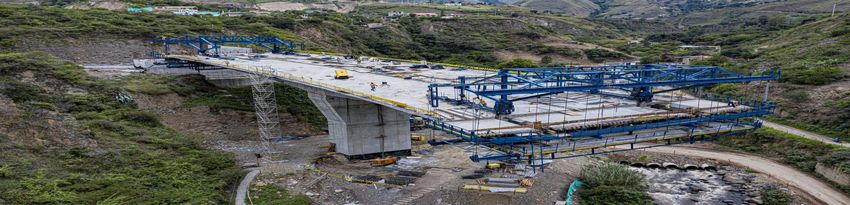
Table of Contents
1. Highlights & Main Figures 1Q21
2. Operational Development 1Q21
3. Performance by Business Area 1Q21
4. Annexes
Américo Vespucio Oriente highway, Chile

1   Highlights & Main Figures 1Q 2021

1   Highlights & Main Figures 1Q 2021

                Shareholder Remuneration

         •   Scrip Dividend February 2021: 0.042€/share or 1x47 shares. 92% chose shares.
         •   Post. closing: Approved 2 new Scrip Dividend in the AGM 29th April 2021.
         •   Estimated profitability 4-5%.

                Actions to reduce Recourse Net Debt
         •   Within the 21-25 strategic plan, focus on significantly reducing recourse net
             debt in 2021 and 2022.
         •   Final step to issue a green financial structure that will reduce that debt.
         •   Different ongoing operations to contribute to the reduction of that debt,
             together with the Group's own cash generation and the dividends received by
             the concessions.

                                Presentation of Results 1Q 2021                              4
1 Highlights & Main Figures 1Q 2021
Social Bond
• First social bond issued in Latin America linked to an infrastructure
project.
• Issuance of bonds worth $209 million to refinance the Montes de María
(Colombia) route.
• The use of new financing instruments linked to sustainability objectives is one
of the lines of action of Sacyr's Strategic Plan 2021-2025.
Concessional projects
Progress in the major projects of the backlog.
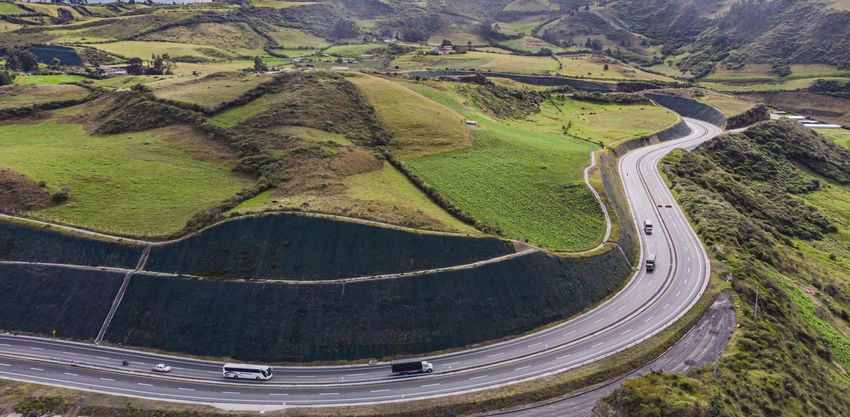
• Colombia: Puerta de Hierro motorway (100%), Mar 1 (85%), Rumichaca-Pasto
(90%) and Pamplona-Cúcuta (39%)
• Italy: Pedemontana-Veneta (94%)
• Chile: Américo Vespucio Oriente (72%)
• Paraguay: Rutas del Este (45%)
• Uruguay: Ferrocarril Central (37%)
Presentation of Results 1Q 2021 5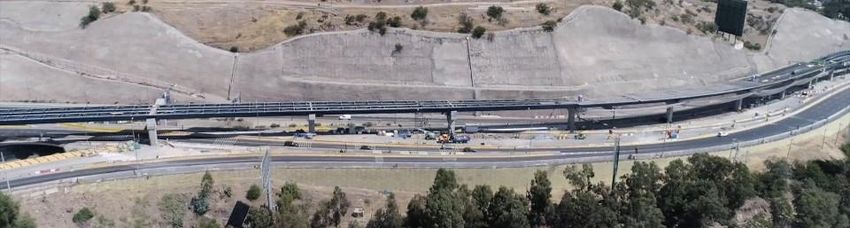
1            Highlights & Main Figures 1Q 2021

Main Figures
 Million of Euros                                        1Q 2021                       1Q 2020                Var

 Revenue                                                      1,057                         985               +7%
 EBITDA                                                        194                          166               +17%
 EBITDA concessional assets                                       81%                       77%              +400 bp
 EBITDA Margin                                                18.3%                       16.8%              +150 bp
  EBIT                                                         152                          133               +14%
 NET PROFIT*                                                    26                            32              -21%
 Operating Cash Flow                                           117                            89              +31%

 Backlog (vs Dec. 2020)                                      40,189                       39,185               3%
* Net profit 1Q2020 includes capital gains from the sale of the Guadalmedina/Guadalcesa motorway & others.

                                                                       Presentation of Results 1Q 2021                 6
Valles del Desierto highway, Chile

2   Operational Development 1Q 2021

              sacyr.com
2         Operational Development 1Q 2021

Operational Strength
Long-term sustainable value

                            EBITDA                             EBITDA MARGIN                    EBIT

                            194€M                              18.3%                            152€M
                            +17% VS 1Q 2020                    +150 b.p. VS 1Q 2020             +14% VS 1Q 2020

Concessions                      Eng & Infra                                          Services

                   EBITDA                                          EBITDA                                         EBITDA
 EBITDA     EBIT                    EBITDA          EBIT                               EBITDA       EBIT
                   MARGIN                                          MARGIN                                         MARGIN
104 €M     86 €M   55%              75 €M         67 €M            12%                21 €M        7 €M           8.5%

                                        Presentation of Results 1Q 2021                                                    8
2       Operational Development 1Q 2021

Contribution by activity
                     Eng & Infra                                       Concessions                   Concessions
                     54%                                               52%                           79%

    Revenue          Concessions             EBITDA                    Eng & Infra
                                                                       38%                 Backlog   Eng & Infra
                                                                                                     15%
                     25%
    1Q 2021                                  1Q 2021                   Services            1Q 2021   Services
                     Services
                     21%                                               10%                           6%

                                   EBITDA concessional assets 157€M = 81%
       EBITDA
        by type of
          asset
                                49€M                            104€M                4€M
                        Eng & Infra       Concessions          Services

                                              Presentation of Results 1Q 2021                                      9
2            Operational Development 1Q 2021

   Backlog                                 CONCESSIONS                           ENG & INFRA                           SERVICES

   €40,189 M 31,665€M 5,957€M              79% of total                          15% of total
                                                                                                                       2,567€M
                                                                                                                       6% of total

                                                                                                Europe
                                                                                                                                 Home assistance for
                                                                                                Real Estate developments in      Burgos City Council,
Canada                                                                                          Spain.                           Spain.
Development of the Rail                                                                         Logistics storage warehouse in   Cleaning of the Puerta
Corridor “Lakeshore East-West”                                                                  Gerona, Spain.                   del Mar Hospital in
(LSEW) in Toronto.                                                                                                               Cádiz, Spain.
                                                                                                Polyduct between the La
                                                                                                Coruña refinery and the new      Maintenance,
                                                                                                outer port of Langosteira,       conservation, cleaning
                                                                                                Coruña, Spain.                   and removal of waste
United States                                                                                                                    from parks and gardens
                                                                                                SS340 “Regina - Tremezzina”
Energy maintenance and                                                                                                           in the municipality of
                                                                                                road, in Como (Italy),
improvement at the University                                                                                                    San Fernando de
of Idaho (USA)                                                                                  Modernisation of the railway     Henares, Madrid, Spain.
                                                                                                line between Sines and Linea
                                                                                                                                 Catering for patients at
                                                                                                do Sul (Portugal).
            Latam                                                                                                                Elche Hospital, Spain.
            Desigh, construction and                                                            Urban cleaning, collection and
                                                                                                                                 Street cleaning in the
            operation of the Buin Paine                                                         transport in Spain.
                                                                                                                                 town of Villanueva del
            Hospital, Chile.
                                                                                                Management of the “Domenech      Pardillo, Madrid, Spain.
            Construction of the Caman                                                           i Montaner” residence and day
                                                                                                                                 Cleaning of 8 shopping
            Wind Farm, Chile.                                                                   center for the Badalona City
                                                                                                                                 centers, Spain.
                                                                                                Council, Spain.
            Construction of the Chimbote
            road, section 1, Peru.

                                                          Presentation of Results 1Q 2021                                                               10
2 Operational Development 1Q 2021
Net Debt Evolution
€ million
Debt decrease by Financial Debt increase Debt increase Var. due to
operating flow Result due to net by Panama financing flow
5,212 -117 94 investment
95 85 5,606
237
85
95
237 5,606
-194 94
151
-74
5,212
Net Debt EBITDA Working Operating Adjustments Financial Net Investment Panama Financing Flow Net Debt
Dec. 2020 Capital + tax Result and other 1Q 2021
Presentation of Results 1Q 2021 112 Operational Development 1Q 2021
Recourse Net Debt Evolution 1Q 2021 Pro forma
14 991
95
26 -150
16
3
1
836 841
Recourse Funds fro m Tax Financial Net Investment* P anama Financing flo ws Recourse Green Recourse
Net Debt o peratio ns P ayments Expenses Fo rex & o ther Net Debt Financing Net Debt
Dec. 2020 1Q 2021 Pro form a
* Investment in Concessions €16M and in Engineering + Services €10M
Focus on recourse net debt reduction in 2021 and 2022
Presentation of Results 1Q 2021 12Pirámides highway, México
3 Performance by Business Area 1Q 2021
sacyr.com3 Performance by Business Area 1Q 2021
Concessions
€ mill 1Q 2021 1Q 2020 Var Concessional Revenue
23% increase thanks to the operational growth of most infrastructure and
REVENUE 289 273 +6% water assets, as well as the start of the contribution of Tlahuac Hospital in
Mexico and the University of Idaho in USA.
Concessional Revenue 189 153 +23%
Infra Concessions 155 126 +23% Construction Revenue
Water Concessions 34 27 +24% 16% reduction due to the completion of the works on the Puerta de Hierro
Construction Revenue 100 120 -16% Highway in Colombia and the Hospital de Tlahuac, partially offset by the
higher pace of execution in other projects.
EBITDA 104 84 +24%
Infra Concessions 97 81 +21% EBITDA
Water Concessions 6 3 +99%
EBITDA grows by 24% thanks to commissioning of several tranches of
assets in backlog projects such as the Hospital de Tláhuac and the University
EBITDA Margin infra. Conc. 63% 64% of Idaho, as well as the contribution of the Chilean water assets
EBITDA Margin water Conc. 18% 11%
BACKLOG (vs Dec. 2020) 31,665 30,895 +2% Main contract awards
Buin Paine Hospital in Chile. Concession for the construction and operation
for a period of 15 years, initial investment of 101 M€ with 194 M€ of
INVESTED EQUITY INVESTED EQUITY INVESTED EQUITY backlog.
1,177€M 1,083€M 94€M * RSC-287 motorway concession in Brazil. Operation, conservation,
maintenance, improvements and expansion of infrastructure from The RSC-287
Highway. Concession period of 30 years.
TOTAL CONCESSIONS INFRA CONCESSIONS WATER
* A3 Naples-Salerno motorway: The motorway links the towns of Naples,
Pompeii and Salerno in southern Italy, which is 56 kilometres long and has an
Equity invested in infrastructure concesions +16M in 1Q 2021 average daily traffic of about 170,000 vehicles.
*Pending signature. Not included in backlog.
Presentation of Results 1Q 2021 143 Performance by Business Area 1Q 2021
Concessions
Commissioning and progress of major projects (I)
Italy Chile
Pedemontana - Américo Vespucio
Veneta Oriente
94% 72%
Next opening in May of the Progress in March with the
Bassano Ovest Toll section to assembly of the 44 beams of the
the 32-kilometer El Salto viaduct and the union of
Montebeluna Toll, which will the two fronts of the La Pirámide
total 66 km opened. tunnel in April. Expected
Expected completion 2021. completion 2022.
Presentation of Results 1Q 2021 153 Performance by Business Area 1Q 2021
Concessions
Commissioning and progress of major projects (II)
Colombia
Puerta de Hierro – Autopista al
Cruz del Viso Mar 1
100% 85%
Commissioning of the UF2 of this On February 25, the structure of
track. 65Km stretch between El the new bridge over the 426 m
Carmen de Bolívar, Carreto and long Cauca River was joined.
Cruz del Viso. Total 150Km Expected completion 2021.
improved. Completed.
Rumichaca – Pasto Pamplona - Cúcuta
90%
During the month of March 2021
39%
Union of the two fronts of the
the functional units 3 and 4
Pamplona tunnel of 1,400 m in
representing 23 km in double
length. Expected completion
carriageway were completed.
2022.
Expected completion 2021.
Presentation of Results 1Q 2021 163 Performance by Business Area 1Q 2021
Concessions
Commissioning and progress of major projects (III)
Uruguay
Ferrocarril The PPP contract of the concession includes the renewal
of the railway section between Montevideo and Paso de
Central Los Toros, with all its components. It is expected to start
37% operating in 2023.
Paraguay
Rutas del It is the first road project under the regime of the new
Este Law on Public-Private Partnership of Paraguay. 170 km
length and traffic of more than 19,000 vehicles / day. In
45% April, the fourth 20km stretch enabled for two-lane
dual-lane traffic in both respects.
Presentation of Results 1Q 2021 173 Performance by Business Area 1Q 2021
Concessions
Detail by country
€ Thousand Spain Chile Colombia Peru Mexico Uruguay Paraguay EEUU Others Holding TOTAL
Revenue * 68,109 52,889 92,684 8,147 13,772 2,899 40,591 2,204 7,414 350 289,059
EBITDA
* 22,722 27,268 35,481 3,277 7,670 1,947 6,032 1,009 1,384 -3,282 103,508
Assets 21 17 4 1 2 2 1 1 10 0 59
(*) Pedemontana not included in Revenue and EBITDA as it is included in the Engineering and Infrastructure division until its commissioning.
Rumichaca Pasto, Colombia
Presentation of Results 1Q 2021 183 Performance by Business Area 1Q 2021
Backlog
€31,665 M N6 (45%)
Pedemontana (49%)
Honaine (26%)
Skikda (17%)
Oman
Desalination
Highways (28) Plant (51%)
Idaho University (100%) Vial Montes de María (100%)
Transport Hubs (2) Desarrollo Vial al Mar (38%)
Rumichaca Pasto (60%)
Airports (2) Pamplona-Cucuta (100%)
Aunor (51%)
Tláhuac Hospital (51%) Viastur (70%)
Railway (1) Pirámides - Tulancingo - Pachuca (51%) Vilafranca H. (1%)
Braga H. (1%) Palma-Manacor (40%)
Hospitals (8) Haçor H. (1%) Turia (56%)
Brisal (5%)
Barbanza (100%)
Parking (4) Vial Sierra Norte (67%)
Vía Expreso (11.2%)
Eresma (80%)
Water (11) Arlanzón (55%)
Valles del Desierto (31%) Routes 2 & 7 (60%) Parla H. (51%)
Other (3)
Rutas del Desierto (26%)
Noreste H. (51%)
Valles del Bío-Bío (26%)
Plaza Elíptica (51%)
Ruta del Algarrobo (26%)
46
Corredor Vial 21 & 24 (51%) Moncloa (51%)
Ruta del Limarí (26%)
Ferrocarril Central (40%) Guadalmedina (5%)
Assets in operation Vespucio Oriente (50%)
Los Vilos – La Serena (100%) Daoiz y Velarde (100%)
13 Assets under construction
Antofagasta Hospital (26%)
El Tepual Airport (32%)
Chacalluta Airport (57.5%)
Juan Esplandiu (100%)
Plaza del Milenio (100%)
Virgen del Romero (100%)
Ruta de la Fruta (100%)
Plaza Encarnación (100%)
5 Full Water Cycles (51%)
Buin-Paine Hospital (57.5%) Mercado del Val (100%)
Sotogrande (100%)
Emmasa (95%)
Guadalajara (100%)
Presentation of Results 1Q 2021 193 Performance by Business Area 1Q 2021
Engineering & Infrastructures
€ mill 1Q 2021 1Q 2020 Var Focus on profitability
15% EBITDA increase above the 12% increase in revenues, thanks to the
implementation of the projects in backlog and the contribution of the
REVENUE 628 563 +12%
Pedemontana Veneta motorway.
Construction Margin 4.9%.
EBITDA 75 65 +15%
New Market: Canada
EBITDA Margin 12.0% 11.6% +0.4 pp
Award of the first project in Canada following our strategic plan 21-25.
Two sections of the LSEW Rail Corridor in Toronto.
BACKLOG (vs Dec. 2020) 5,957 5,622 +6%
Main Contract Awards
Pedemontana Financial Asset Impact Great success in bidding. Backlog increased by 6% vs December 2020.
€ millions Pedemontana Eng & Infra EX Pedemontana
• Maintenance and energy improvement University of Idaho (USA): €542M
Revenue 104 524
• Several real estate developments in Spain. 148M €.
EBITDA 49 26
• Logistics storage ship in Girona: 91M.
Ebitda Margin - 4.9% • Design and construction of the new Hospital de Buin Paine (Chile): 89M.
• "Lakeshore East-West" Rail Corridor (LSEW) in Toronto, Canada: 51M€.
• Caman Wind Farm (Chile), 51M.
INTERNATIONAL BACKLOG MONTHS
BACKLOG FOR CONCESSIONS OF ACTIVITY • Chimbote route, section 1 (Peru): 35M.
• * A3 Naples Salerno motorway. Italy, 390 M.
83% ~50% 28 • * Highway RSC-287 in Brazil. 174M.
(*) Pending signature. Project not included in backlog.
Presentation of Results 1Q 2021 203 Performance by Business Area 1Q 2021
Services
€ mill 1Q 2021 1Q 2020 Var Revenue
Environment: Positive performance thanks to contracts (i) internationally,
REVENUE 243 257 -5% waste treatment plant in Melbourne, Australia, and; (ii) at the national
level, two important contracts of cleaning and repair of damage caused by
Environment 128 121 the Filomena storm, in Madrid as well as contracts for cleaning and
Multiservices 114 134 collection of urban solid waste in Collado Villaba, San Roque and Mollet del
Central 1 2 Vallés.
Multiservices: slight contraction over the Covid condition offset by
EBITDA 21 22 -6%
international Infrastructure Conservation and Facilities contracts.
Environment 18 18
Multiservices 3 4
Central 0 0 EBITDA
Stable EBITDA margin at 8.5%. Stability in the area of Environment
EBITDA Margin 8.5% 8.6% -0.1 pp supported by contracts at the international and national level. Slight
contraction in Multiservices because of the impact of the Covid 19.
BACKLOG 2,567 2,668 -4%
Main contract awards
• Urban cleaning, collection and transport of RSU from Santurce (Vizcaya):
15M.
• Management of the residence and day center "Domenech i Montaner",
for the Town Hall of Badalona: 10M.
• Home Assistance Service for the City of Burgos: 8M.
• Cleaning of 8 shopping malls: 6M
Presentation of Results 1Q 2021 21Water treatment, Batuco, Chile
4 Annexes 1Q 2021
sacyr.com4 Annex: Consolidated Income Statement 1Q 2021
Presentation of Results 1Q 2021 234 Annex: Consolidated Balance Sheet 1Q 2021
BALANCE SHEET
MAR. 2021 DEC. 2020 Chg 2021/2020
(Thousand Euros)
NON CURRENT ASSETS 10,379,234 9,954,680 424,554
Intangible Assets 33,984 34,209 -225
Concessions Investments 887,593 880,832 6,761
Fixed Assets 313,371 318,071 -4,700
Right of use over leased assets 114,977 127,712 -12,735
Financial Assets 2,979,782 2,872,117 107,665
Receivables from concession assets 5,794,047 5,590,902 203,145
Other non Current Assets 159,332 34,689 124,643
Goodwill 96,148 96,148 0
CURRENT ASSETS 4,132,984 4,436,977 -303,993
Non current assets held for sale 0 0 0
Inventories 176,471 230,887 -54,416
Receivables from concession assets 575,470 523,701 51,769
Accounts Receivable 1,862,238 1,950,807 -88,569
Financial Instruments at fair value 227,822 370,689 -142,867
Financial Assets 65,300 63,946 1,354
Cash 1,225,683 1,296,947 -71,264
ASSETS = LIABILITIES 14,512,218 14,391,657 120,561
EQUITY 1,059,418 962,593 96,825
Shareholder's Equity 597,843 557,307 40,536
Minority Interests 461,575 405,286 56,289
NON CURRENT LIABILITIES 9,014,063 8,891,429 122,634
Financial Debt 5,969,981 5,814,174 155,807
Financial Instruments at fair value 164,219 210,993 -46,774
Lease Obligations 82,624 85,573 -2,949
Provisions 177,912 191,853 -13,941
Other non current Liabilities 1,969,531 1,939,040 30,491
Other hedged debt 649,796 649,796 0
CURRENT LIABILITIES 4,438,737 4,537,635 -98,898
Liabilities associated with the non current assets held for sale 0 0 0
Financial Debt 927,210 758,740 168,470
Financial Instruments at fair value 17,263 18,558 -1,295
Lease Obligations 28,326 30,739 -2,413
Trade Accounts Payable 1,518,004 1,597,553 -79,549
Operating Provisions 215,362 220,973 -5,611
Other current liabilities 764,926 943,426 -178,500
Other hedged debt 967,646 967,646 0
Presentation of Results 1Q 2021 244 Annex: Income Statement by Business Area 1Q 2021
* The financial figures of the Water segment of Sacyr Concessions, previously included in Sacyr Services, have been incorporated following the strategic decision.
Presentation of Results 1Q 2021 254 Annex: Income Statement by Business Area 1Q 2020
* The financial figures of the Water segment of Sacyr Concessions, previously included in Sacyr Services, have been incorporated following the strategic decision.
Presentation of Results 1Q 2021 264 Annex: Net Financial Debt
Million € March 21 Dec.20 Var.
Project finance 4,615 4,376 239
Bank borrowings (Operating Lines) 228 154 74
Capital Market (Bonds + ECP) 763 682 81
Net Debt 5,606 5,212 394
Debt Recourse
net debt
Sacyr Concessions 3,013
Sacyr Concessions 3,143 €991 M
ex project treasury -130 (18%)
Sacyr Engineering and Infrastructures 1,301 Total Net
Construction -97
Debt
Pedemontana and other (P. Finance) 1,398 1Q 2021
Sacyr Services 81
€5,606M
Sacyr Services 7
Project 74 €4,615 M
Corporate Debt 1,211
(82%)
Project debt
TOTAL FINANCIAL NET DEBT 5,606
Presentation of Results 1Q 2021 274 Annex: Net Financial - Debt Maturity Schedule
Total net debt – maturity breakdown
Million euros
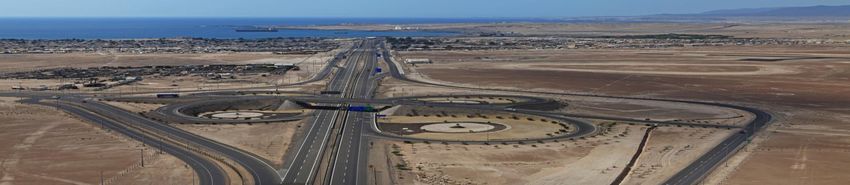
Presentation of Results 1Q 2021 284 Annex: Concessions - Traffic
ACCUMULATED ADT
Q1 21 Q1 20 CHG. (%)
SHADOW TOLL HIGHWAY SPAIN
- AUTOVIA DEL NOROESTE 10,968 11,449 -4.2%
- Ma-15 PALMA-MANACOR 18,920 19,827 -4.6%
- AS-II OVIEDO-GIJÓN (VIASTUR) 20,864 21,625 -3.5%
- AUTURSA CV-35 33,971 34,602 -1.8%
- ERESMA 6,103 6,420 -4.9%
- BARBANZA 10,389 11,247 -7.6%
- ARLANZON 12,526 15,976 -21.6%
TOLL HIGHWAY SPAIN
- AP-46 MÁLAGA - LAS PEDRIZAS 6,915 10,051 -31.2%
TOLL HIGHWAY OTHER COUNTRIES
- N6 GALWAY-BALLINASLOE 5,840 11,138 -47.6%
- VALLES DEL DESIERTO 6,245 5,825 7.2%
- RUTAS DEL DESIERTO 6,414 7,822 -18.0%
- RUTAS DEL ALGARROBO 5,608 5,053 11.0%
- VALLES DEL BIO-BIO 8,521 8,926 -4.5%
- RUTA DE LIMARÍ 5,540 5,552 -0.2%
- MONTES DE MARÍA 3,150 2,982 5.6%
- UNIÓN VIAL DEL SUR 6,317 4,898 29.0%
- DESARROLLO VIAL AL MAR 8,211 6,902 19.0%
- RUTAS DEL ESTE 16,325 14,993 8.9%
- PAMPLONA-CÚCUTA 7,000 - n/a
- VIA EXPRESSO 3,958 4,590 -13.8%
Presentation of Results 1Q 2021 294 Annex: Concessions - Revenues Breakdown
Presentation of Results 1Q 2021 304 Annex: Alternative performance measures
El Grupo Sacyr presenta sus resultados de acuerdo con las Normas Internacionales de Información Financiera (NIIF). Adicionalmente, el Grupo proporciona otras medidas financieras, denominadas
Medidas Alternativas de Rendimiento (MAR) o Alternative Performance Measures (APM’s), utilizadas por la Dirección en la toma de decisiones y en la evaluación del rendimiento financiero, los flujos
de efectivo o la situación financiera.
A fin de cumplir con la Directriz (2015/1415es) de la European Securities and Markets Authority (ESMA), sobre Medidas Alternativas de Rendimiento, a continuación se detallan los desgloses requeridos
para cada MAR, sobre su definición, conciliación, explicación de uso, comparativa y coherencia.
El Grupo Sacyr considera que esta información adicional favorecerá la comparabilidad, fiabilidad y comprensión de su información financiera.
MEDIDAS ALTERNATIVAS DEL RENDIMIENTO:
Resultado bruto de explotación (EBITDA): es el Resultado de Explotación antes de dotación a la amortización y variación de provisiones, desafectado –en su caso- de ganancias o pérdidas
extraordinarias/ no recurrentes.
Resultado de explotación (EBIT): Se calcula como diferencia entre el Total ingresos de explotación (Cifra de negocios, Trabajos efectuados por la empresa para el inmovilizado, Otros ingresos de
explotación, Imputación de subvenciones de capital) y el Total gastos de explotación (Gastos de personal, Amortizaciones, Variación de provisiones y Otros).
Deuda bruta: agrupa las partidas de Deuda financiera no corriente y Deuda financiera corriente del pasivo del balance de situación consolidado, que incluyen deuda bancaria y emisiones en mercado
de capitales (bonos).
Deuda neta: se calcula restando a la Deuda bruta las partidas de Otros activos financieros corrientes, y Efectivo y otros activos líquidos equivalentes del activo del balance de situación consolidado.
Deuda de financiación de proyectos (bruta o neta): es la deuda financiera (bruta o neta) de las sociedades de proyecto. En este tipo de deuda la garantía que recibe el prestamista se limita al flujo de
caja del proyecto y al valor de sus activos, con recurso limitado al accionista
Deuda corporativa (bruta o neta): es la deuda de la sociedad matriz del grupo e incluye deuda bancaria y emisiones en mercados de capitales
Ratio de endeudamiento con recurso: deuda neta con recurso entre el EBITDA con recurso más las distribuciones y dividendos de los proyectos.
Resultado Financiero: Ingreso Financiero - Gasto Financiero
Cartera: Valor de los contratos de obra adjudicados y cerrados pendientes de ejecutar. Estos contratos se incluyen en la cartera una vez formalizados. La cartera se muestra al porcentaje atribuible al
Grupo, según método de consolidación.
Una vez incorporado un contrato a la cartera, el valor de la producción pendiente de ejecutar de ese contrato permanece en la cartera hasta que se haya completado o cancelado. Sin embargo
realizamos ajustes en la valoración para reflejar cambios en los precios y en los plazos que se pudieran acordar con el cliente. Debido a múltiples factores, todo o parte de la cartera ligada a un contrato
podría no traducirse en ingresos. Nuestra cartera está sujeta a ajustes y cancelaciones de proyectos y no puede ser tomado como un indicador cierto de ganancias futuras.
No hay ninguna medida financiera comparable en NIIF, por lo que no es posible una conciliación con los estados financieros. La Dirección de Sacyr considera que la cartera es un indicador útil respecto
a los ingresos futuros de la Compañía y un indicador típico utilizado por las empresas de los sectores en que operamos.
Cartera de concesiones: representa los ingresos futuros estimados de las concesiones, en el periodo concesional, de acuerdo al plan financiero de cada concesión e incluye asunciones de variaciones de
tipo de cambio entre el euro y otras monedas, de la inflación, los precios, las tarifas y los volúmenes de tráfico.
Capitalización bursátil: número de acciones al cierre del periodo multiplicado por la cotización al cierre del periodo.
Comparable: En ocasiones se realizan correcciones a determinadas cifras para hacerlas comparables entre años, por ejemplo eliminando deterioros extraordinarios, entradas o salidas significativas del
perímetro que pueden distorsionar la comparación entre años de magnitudes como las ventas, el efecto del tipo de cambio, etc. En cada caso se detalla en el epígrafe que corresponda las correcciones
realizadas.
IMD (Intensidad Media Diaria): se define como el número total de usuarios que utiliza la concesión durante un día. Habitualmente, la IMD se calcula como el número total de vehículos que atraviesa
una autopista en un día.
Presentation of Results 1Q 2021 31NOTE
The financial information contained in this document is drafted according to the International Financial Reporting Standards. This information
has not been audited and therefore may be modified in the future. This document is not a offer, invitation or recommendation to buy, sell or Condesa de Venadito 7
exchange shares or make any kind of investment. Sacyr does not assume any type of damages or losses as a result of the use of this
document or its content.
28027 Madrid
In addition, the Group uses Alternative Performance Measures to provide with additional information which enhances the comparability and
comprehension of its financial information and facilitate the decision-making and the evaluation of the group´s performance.
To comply with the Directives (2015/1415es) of European Securities and Markets Authority (ESMA) on APMs, this document comprises the
more outstanding APMs used in the preparation of this document (Annex).
sacyr.comYou can also read