Scotia Bank Technology Leaders Summit - May 14, 2021 - Avaya Holdings Corp.

Page created by Alice Walsh
 
CONTINUE READING
Scotia Bank Technology Leaders Summit - May 14, 2021 - Avaya Holdings Corp.
Scotia Bank
Technology Leaders Summit

May 14, 2021

      © 2021 Avaya Inc. All rights reserved   Exhibit 99.2
Scotia Bank Technology Leaders Summit - May 14, 2021 - Avaya Holdings Corp.
Cautionary Note Regarding Forward-Looking Statements

This release contains certain “forward-looking statements.” All statements other than statements of historical fact are “forward-looking”
statements for purposes of the U.S. federal and state securities laws. These statements may be identified by the use of forward-looking
terminology such as "anticipate," "believe," "continue," "could,“ "estimate," "expect," "intend," "may," "might," “our vision,” "plan," "potential,"
"preliminary," "predict," "should,“ "will," or “would” or the negative thereof or other variations thereof or comparable terminology. Avaya
Holdings Corp. (the "Company") has based these forward-looking statements on its current expectations, assumptions, estimates and
projections. These statements, including the Company’s outlook, do not include the potential impact of any business combinations, asset
acquisitions, divestitures, strategic investments or other strategic transactions completed after the date hereof. While the Company believes
these expectations, assumptions, estimates and projections are reasonable, such forward-looking statements are only predictions and involve
known and unknown risks and uncertainties, many of which are beyond its control. Risks and uncertainties that may cause these forward-
looking statements to be inaccurate include, among others, termination or modification of current contracts which could impair attainment of
our OneCloud ARR metric; the duration, severity and impact of the coronavirus pandemic (“COVID-19”), as well as governmental and business
responses to COVID-19, and the impact the pandemic and such responses have on our business, financial performance, liquidity and other
factors discussed in the Company's Annual Report on Form 10-K and subsequent quarterly reports on Form 10-Q filed with the Securities and
Exchange Commission (the “SEC”). These risks and uncertainties may cause the Company’s actual results, performance or achievements to
differ materially from any future results, performance or achievements expressed or implied by these forward-looking statements. For a further
list and description of such risks and uncertainties, please refer to the Company’s filings with the SEC that are available at www.sec.gov. The
Company cautions you that the list of important factors included in the Company’s SEC filings may not contain all of the material factors that
are important to you. In addition, in light of these risks and uncertainties, the matters referred to in the forward-looking statements contained
in this presentation may not in fact occur. The Company undertakes no obligation to publicly update or revise any forward-looking statement as
a result of new information, future events or otherwise, except as otherwise required by law.

These slides, as well as current and historical financial data, are available on our website at investors.avaya.com.

None of the information included on the Company's website is incorporated by reference in this presentation.

              © 2021 Avaya Inc. All rights reserved                                                                                                    2
Scotia Bank Technology Leaders Summit - May 14, 2021 - Avaya Holdings Corp.
Use of non-GAAP (Adjusted) Financial Measures
The information furnished in this presentation includes non-GAAP financial measures that differ from measures calculated in accordance with generally accepted accounting principles
in the United States of America (“GAAP”).

EBITDA is defined as net income (loss) before income taxes, interest expense, interest income and depreciation and amortization. Adjusted EBITDA is EBITDA further adjusted to
exclude certain charges and other adjustments described in our SEC filings and the tables in the Appendix hereto.

We believe that including supplementary information concerning adjusted EBITDA is appropriate because it serves as a basis for determining management and employee
compensation and it is used as a basis for calculating covenants in our credit agreements. In addition, we believe adjusted EBITDA provides more comparability between our historical
results and results that reflect purchase accounting and our current capital structure. We also present adjusted EBITDA because we believe analysts and investors utilize these
measures in analyzing our results. Adjusted EBITDA measures our financial performance based on operational factors that management can impact in the short-term, such as our
pricing strategies, volume, costs and expenses of the organization, and it presents our financial performance in a way that can be more easily compared to prior quarters or fiscal
years.

EBITDA and adjusted EBITDA have limitations as analytical tools. EBITDA measures do not represent net income (loss) or cash flow from operations as those terms are defined by
GAAP and do not necessarily indicate whether cash flows will be sufficient to fund cash needs. Adjusted EBITDA excludes the impact of earnings or charges resulting from matters that
we do not consider indicative of our ongoing operations but that still affect our net income. In particular, our formulation of adjusted EBITDA allows adjustment for certain amounts
that are included in calculating net income (loss), however, these are expenses that may recur, may vary and are difficult to predict. In addition, these terms are not necessarily
comparable to other similarly titled captions of other companies due to the potential inconsistencies in the method of calculation.

We also present the measures non-GAAP gross margin, non-GAAP operating income, non-GAAP operating margin, non-GAAP net income and non-GAAP earnings per share as a
supplement to our unaudited condensed consolidated financial statements presented in accordance with GAAP. We believe these non-GAAP measures are the most meaningful for
period to period comparisons because they exclude the impact of the earnings and charges noted in the applicable tables in the Appendix to this presentation that resulted from
matters that we consider not to be indicative of our ongoing operations.

The company presents constant currency information to provide a framework to assess how the company’s underlying businesses performance excluding the effect of foreign currency
rate fluctuations. To present this information for current and comparative prior period results for entities reporting in currencies other than U.S. dollars, the amounts are converted
into U.S. dollars at the exchange rate in effect on the last day of the company's prior fiscal year (i.e. September 30, 2020).

In addition, we present the liquidity measure of free cash flow. Free cash flow is calculated by subtracting capital expenditures from Net cash provided by operating activities. We
believe free cash flow is a measure often used by analysts and investors to compare the cash flow and liquidity of companies in the same industry.

The presentation of these non-GAAP financial measures is not intended to be considered in isolation from, as substitute for, or superior to, the financial information prepared and
presented in accordance with GAAP and may be different from the non-GAAP financial measures used by other companies. In addition, these non-GAAP measures have limitations in
that they do not reflect all of the amounts associated with the Company’s results of operations as determined in accordance with GAAP.

The Appendix to this presentation includes tables that reconcile historical GAAP measures to non-GAAP measures.

               © 2021 Avaya Inc. All rights reserved                                                                                                                                      3
Scotia Bank Technology Leaders Summit - May 14, 2021 - Avaya Holdings Corp.
Avaya's Q2 at a Glance
                                                                                                                             •      Avaya is a leading pure-play
                                                                                                                                    Unified Communications &
                                                                  90%
                                    40%                        Software &                                                           Collaboration and Contact
                                                           Services Revenue(1)
  $344m                          Cloud, Alliance                                                                                    Center software company
                                    Partner &
                                                                  66%
   OneCloud
   ARR(1)(2)
                                  Subscription
                                   Revenue(1)
                                                                  Recurring                                                         with ~100,000 global
                                                                  Revenue(1)
                                                                                                                                    customers(3)

                ~100m                                ~6m                         ~190                                        •      Avaya serves 90% of the
                  Unified                        Contact Center                 Countries(3)
               Communications                       Seats(3)                                                                        largest US companies(1)
                  Lines(3)

                                                                                                                             •      Major strategic partnerships
  $738m                          $177m                      >$200m                                                                  broaden product portfolio
   Revenue(1)                  Adj.   EBITDA(1)(4)              FY21 R&D
                                                              Investment(5)

                                                                   (1) For and as of 2Q FY21 ending March 31, 2021.  (4)Adjusted EBITDA is a non-GAAP measure. See non-
                                                                   (2) See Appendix for further definition and       GAAP reconciliation in the Appendix hereto for a
                                                                   information on OneCloud ARR metric.               reconciliation to the nearest GAAP measure.
         © 2021 Avaya Inc. All rights reserved                     (3) For and as of FY20 ending September 30, 2020. (5)Expected FY2021 spend on Research and Development   4
Scotia Bank Technology Leaders Summit - May 14, 2021 - Avaya Holdings Corp.
Arc of Avaya's Journey

    © 2021 Avaya Inc. All rights reserved   5
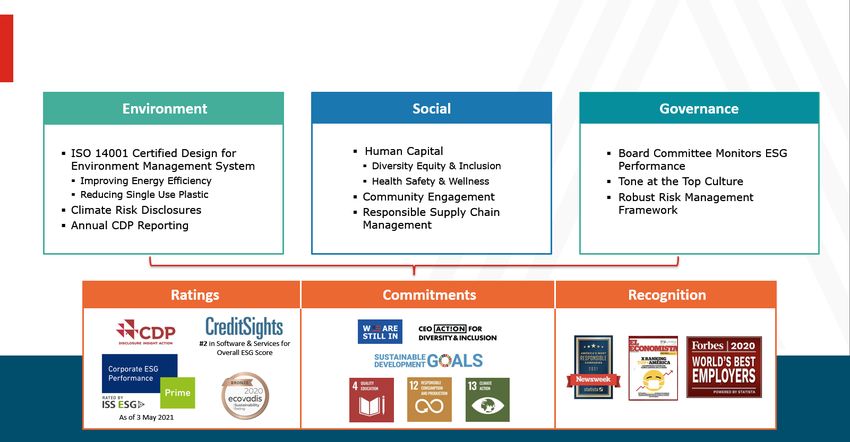
Scotia Bank Technology Leaders Summit - May 14, 2021 - Avaya Holdings Corp.
Business Model
Evolution

    © 2021 Avaya Inc. All rights reserved   6
Scotia Bank Technology Leaders Summit - May 14, 2021 - Avaya Holdings Corp.
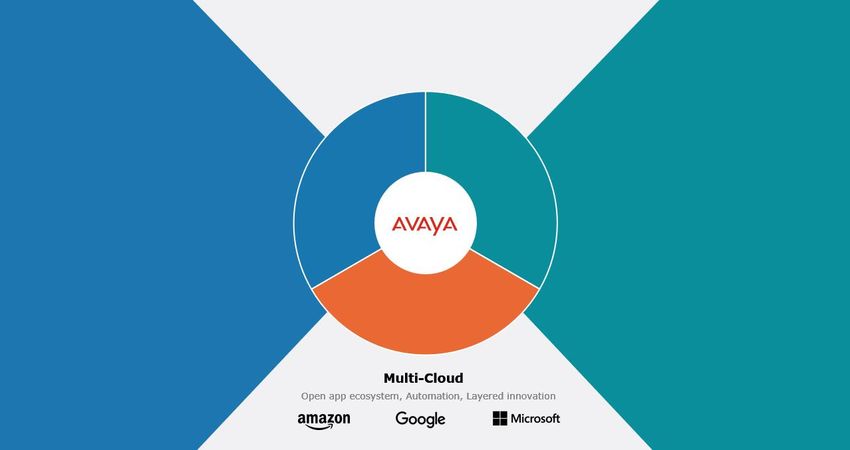
Source: Avaya management analysis derived from third party industry estimates
© 2021 Avaya Inc. All rights reserved   Note: Charts not to scale against each other                                                   7
                                        Note: Excludes Services and Devices TAMs of $22.3B and $18.3B in 2019 and 2023, respectively
Scotia Bank Technology Leaders Summit - May 14, 2021 - Avaya Holdings Corp.
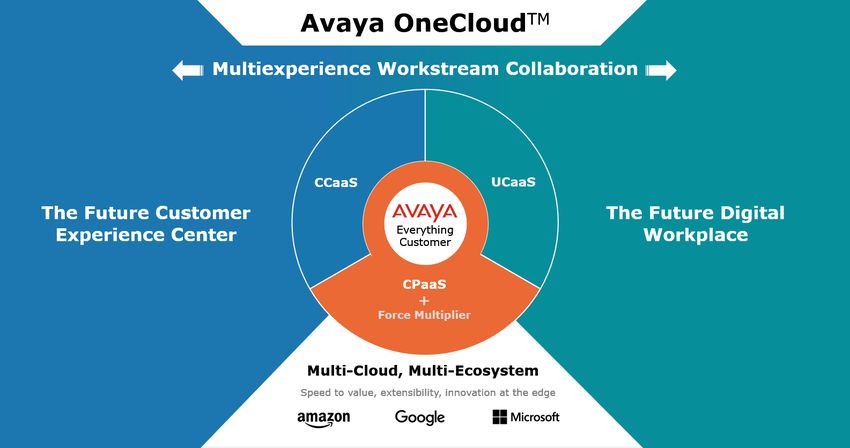
© 2021 Avaya Inc. All rights reserved   8
Customer Benefits of Avaya OneCloud

    © 2021 Avaya Inc. All rights reserved   9
ESG – Enhancing Sustainable Value in an Evolving Landscape

      © 2021 Avaya Inc. All rights reserved            10
© 2021 Avaya Inc. All rights reserved   11
Financial Overview
2Q FY21

     © 2021 Avaya Inc. All rights reserved   12
2Q FY21
Financial
Highlights                                 $738M                                         $2.1B                                         62%
                                                  Revenue                             Total Contract                               Non-GAAP
                                                                                         Value(1)                                Gross Margin*

                                                                                         Revenue

                                           $344M                             40%                              90%                             66%
                                           OneCloud                    Cloud, Alliance Software                                               Recurring
                                            ARR(2)                        Partner &    & Services                                             Revenue
                                                                        Subscription    Revenue
                                                                          Revenue

                                            (1) TCV is defined as the value of all active ratable contracts that have not been recognized as revenue,
                                            including both billed and unbilled backlog.
   © 2021 Avaya Inc. All rights reserved    (2) See Appendix for further definition and information on OneCloud ARR metric.                                   13
                                            * For a reconciliation of GAAP to non-GAAP financial information, please see the Appendix of this presentation.
Financial
    Strength &
    Flexibility                                                    $177M                                                     $(24)M
                                                                       24.0% of                                                    (3)% of
                                                                       Revenue                                                    Revenue

                                                                                                                    Cash Flow Used for
                                                                 Adj. EBITDA                 (1)*
                                                                                                                       Operations(1)
As we return to growth, we

 remain highly profitable
                                                                   $593M                                                          2.9x
  with strong liquidity.

                                                                       Cash                                                Net-debt /
                                                                     Balance(1)                                           Adj. EBITDA(2)

                                                   (1)
                                                     For and as of 2Q ending March 31, 2021.
                                                   (2)Net-debtas of March 31, 2021, defined as short term debt and long term debt less cash, divided by Trailing
           © 2021 Avaya Inc. All rights reserved   Twelve Months (TTM) Adjusted EBITDA.*                                                                            14
                                                   *For a reconciliation of GAAP to non-GAAP financial information, please see the Appendix of this presentation.
Business Model Transformation(1)

                                                        FY18*           FY19*                1H'20             2H'20               1H'21
                                                                                                                                                          • Transforming the business to a
                                                                                                                                                            recurring revenue and
Revenue YoY Growth(2)                                   (2)%              (4)%                (4)%              +2%                 +5%
                                                                                                                                                            software-oriented model,
Revenue from Software and                                                                                                                                   including the introduction of
                                                        82%               83%                 87%               88%                 89%                     ARR
Services

Recurring Revenue                                       57%               58%                 62%               64%                 66%                   • Achieved the 30% CAPS target
                                                                                                                                                            a year ahead of schedule
Revenue from CAPS                                       14%               15%                 20%               32%                 37%
                                                                                                                                                          • Investing substantially in R&D
Non-GAAP Gross Margin*                                  63%               61%                 61%               61%                 62%                     and Go-To-Market to address
                                                                                                                                                            the growing Cloud-First TAM
Adjusted EBITDA Margin*                                 24%               24%                 23%               26%                 25%

      (1) FY18 and FY19 calculated with Non-GAAP Revenue*; 1H20, 2H20, and 1H21 calculated with GAAP Revenue.
      (2) FY18 revenue growth as-reported; FY19, FY20, & 1H21 revenue growth on a constant currency basis using foreign exchange rates as of September 30th of the respective comparison period. The
      Company presents constant currency information to provide a framework to assess the Company’s performance excluding the effect of foreign currency rate fluctuations. Revenues exclude discontinued
      operations for the divestiture of the Company’s Networking business in a transaction completed in FY17.
      * For a reconciliation of GAAP to non-GAAP financial information, please see the Appendix of this presentation.

                © 2021 Avaya Inc. All rights reserved                                                                                                                                                       15
© 2021 Avaya Inc. All rights reserved   16
Cloud & ARR Growth

© 2021 Avaya Inc. All rights reserved                        17
Fiscal Year 2021 Transformational KPIs

                                            (1)Unless   otherwise noted, values reflect April 30, 2021 FX rates.
    © 2021 Avaya Inc. All rights reserved                                                                          18
Non-GAAP EPS

    © 2021 Avaya Inc. All rights reserved   19
Long Term Financial Policy Targets

                                    2.5x                                                            ~$400M
                                                                                                     Minimum ~$250-300M

                            Net Leverage(1)                                                        Cash Balance

                             ~$550M                                                                  Low to Mid
                                                                                                       BB/Ba

                       Minimum Liquidity                                                          Senior Secured
                      (Cash + ABL Revolver Availability)                                           Debt Rating(2)

                                                 (1)Net Leverage defined as Debt minus Cash and Cash equivalents divided by LTM Adj. EBITDA.*
© 2021 Avaya Inc. All rights reserved            (2)A securities rating is not a recommendation to buy, sell or hold securities and may be revised or withdrawn at any time.   20
                                                 * For a reconciliation of GAAP to non-GAAP financial information, please see the Appendix of this presentation.
Uses of Cash

                                                   30-40

▪ All values in $M                                 45-50
▪ Net Cash Interest Payments includes
  interest payments on long-term debt
  and payments classified as adequate
  protection payments in connection with
  Chapter 11 proceedings, net of interest
  income
▪ Pension settlement payments to PBGC
  in connection with Chapter 11
  proceedings not included within
  Pension & Post Retirement payments

           © 2021 Avaya Inc. All rights reserved           21
Thank You!
For additional information
about Avaya, please go to:

www.avaya.com

                                              DR   NDR

      © 2021 Avaya Inc. All rights reserved          22
Appendix

   © 2021 Avaya Inc. All rights reserved
2Q FY21 Update
$M                                              2Q FY21 1Q FY21 2Q FY20

Revenue                                        $     738      $   743      $    682
Non-GAAP Gross Margin*                               61.8 %       61.8 %       61.1 %
Non-GAAP Operating Expense*
(% of revenue)                                       41.7 %       39.8 %       42.8 %
Non-GAAP Operating Margin*                           20.1 %       21.9 %       18.3 %
Adjusted EBITDA*                               $     177      $   190      $    149
Adjusted EBITDA Margin*                              24.0 %       25.6 %       21.8 %

                          2Q Financial Highlights

 • Continued large deal activity with 107 deals over $1 million, 16 over $5
   million, and 7 over $10 million
 • Total Contract Value (TCV)(1) of $2.1B
 • Added approximately 1,500 new logos
 • Consumed $24M in cash flow from operations

                                                                           (1) TCV is defined as the value of all active ratable contracts that have not been recognized as revenue,
             © 2021 Avaya Inc. All rights reserved                         including both billed and unbilled backlog.                                                                       24
                                                                           * For a reconciliation of GAAP to non-GAAP financial information, please see the Appendix of this presentation.
2Q FY21 Update
Business Highlights
▪   Avaya Spaces has helped Clemson University offer students a more immersive learning experience. Even for Clemson’s hands-on technical
    courses, the solution’s video and breakout room functionality integrates tightly with the experiential content in their learning experience
    platform for online and hybrid learning that truly supports both teachers and students.
▪   Clarios, a world leader in advanced energy storage solutions, is deploying Avaya OneCloud Private for 5,000 unified communications users
    across 22 countries. Avaya will provide voice, video and collaboration tools to support their global workforce.
▪   AllOne Health based in Wilkes-Barre, PA signed a 3-year deal, choosing to implement Avaya OneCloud CCaaS and Avaya Cloud Office. This
    powerful combination will support a diverse workforce that includes in-house doctors, nurses, clinical staff, health counselors and call center
    agents. AllOne has successfully grown organically and through acquisition and needed a communications platform that would deliver
    scalability and reliability through the next stage of their growth plans.
▪   In the US, Atento expanded their investment in Avaya OneCloud CCaaS to deliver custom integrations and additional agents for their
    customers, including national healthcare and telemedicine provider GoodRx. In addition to expanding capacity this deal enhances the analysis
    of interactions and performance, and adds advanced IVR capabilities that will enable GoodRx to enhance their Customer Experience.
▪   Dauphin County, home to the state capital in Pennsylvania, signed a 5-year deal to deploy Avaya Cloud Office for over 1,800 users.
▪   Avaya was been recognized by Verint as its North American Enterprise Partner of the Year, EMEA Partner of the Year and Latin American
    Partner of the Year. Avaya was singled out for its achievements in delivering innovation for customer engagement, and for outstanding
    collaboration in helping organizations achieve business goals, revenue objectives and growth.
▪   CRN®, a brand of The Channel Company, has given Avaya a 5-Star rating in its 2021 Partner Program Guide for the 13th consecutive year. To
    determine the 2021 5-Star ratings, the CRN® research team analyzed myriad partner programs and scored them based on several factors,
    including investments in program offerings, partner profitability, partner training, education and support, marketing programs and resources,
    sales support, and communication.
▪   CreditSights published their ESG investing framework focusing on Environmental, Social and Governance measures they have determined
    have the capacity to Materially Affect Credit Risk (MACR) in their coverage universe for US Software & Services resulting in a #2 ranking for
    Avaya.
                             © 2021 Avaya Inc. All rights reserved                                                                                    25
Quarterly Income Statement
                                        (Amounts are GAAP and dollars in millions)

        Revenue:                                           2Q21              1Q21                 2Q20

          Product                                    $          226      $           266      $      245

          Services                                              512                  477             437

        Total Revenue                                $          738      $           743      $      682

        GAAP Gross Margin:

          Product                                              40.3 %                44.4 %         44.5 %

          Services                                             62.7 %                62.5 %         60.0 %

        GAAP Total Gross Margin                                55.8 %                56.0 %         54.4 %

        GAAP Operating Margin                                    6.0 %                8.3 %         (87.5)%

© 2021 Avaya Inc. All rights reserved                                                                         26
Quarterly Non-GAAP Income Statement Information
                                            (All dollars amounts are in millions)

              Revenue:                                              2Q21                      1Q21                      2Q20
                Product                                     $             226         $              266        $              245
                Services                                                  512                       477                        437
              Total Revenue                                 $             738         $              743        $              682
              Non-GAAP Gross Margin*:
                Product                                                  59.3 %                    60.5 %                     62.9 %
                Services                                                 62.9 %                    62.5 %                     60.2 %
              Non-GAAP Total Gross Margin*                               61.8 %                    61.8 %                     61.1 %
              Non-GAAP Operating Margin*                                 20.1 %                    21.9 %                     18.3 %
              Adjusted EBITDA*                              $             177         $              190        $              149
              Adjusted EBITDA* %                                         24.0 %                    25.6 %                     21.8 %

    © 2021 Avaya Inc. All rights reserved     *Revenue information presented is GAAP revenue; all other information is non-GAAP. For a reconciliation of   27
                                              GAAP to non-GAAP financial information, please see the Appendix of this presentation.
Quarterly Revenue by Region
                                        (All dollars amounts are in millions)

                 Revenue                                2Q21              1Q21              2Q20
                           U.S.                             413      $          414     $     384
                           EMEA                             187                 195           172
                           APAC                               77                 75            70
                           AI                                 61                 59            56
                           Total                   $        738                 743     $     682

                 % of Total Revenue
                           U.S.                               56 %               56 %          56 %
                           EMEA                               25 %               26 %          26 %
                           APAC                               11 %               10 %          10 %
                           AI                                  8%                 8%               8%
                           Total                            100 %               100 %         100 %

© 2021 Avaya Inc. All rights reserved                                                                   28
Balance Sheet and Operating Metrics
                          (Dollars in millions, Balance sheet items as of the end of the period indicated)

                                                                                                2Q21                    1Q21                    2Q20

Total Cash and Cash Equivalents                                                         $                593 $                   750 $                   553
Cash Flow (used for) provided by Operations                                             $                 (24) $                   48 $                    20
Capital Expenditures and Capitalized Software                                           $                  26 $                    27 $                    22
Days Sales Outstanding (DSO)(1)                                                                            52                      52                      55
Inventory Turns                                                                                         12.7                    13.5                    11.6
Headcount
(as of the end of the period indicated)                                                               8,110                   8,227                   7,873
Trailing Twelve Month Revenue ($K) / Employee
(Headcount as of the end of the period indicated)                                       $                365 $                   353 $                   360

                                          (1)2Q   FY21, 1Q FY21 and 2Q FY20 include $92M, $139M and $154M AR/contract liability netting impact when calculating DSOs.
  © 2021 Avaya Inc. All rights reserved                                                                                                                                 29
Subscription Revenue & Cash Dynamics

    © 2021 Avaya Inc. All rights reserved   30
Premise Subscription Revenue, ARR & Cash Dynamics

      © 2021 Avaya Inc. All rights reserved         31
Non-GAAP Reconciliation
Adjusted EBITDA
                                                                                                                                                    Three months ended,

  (In millions)                                                                                                         March 31, 2021              December 31, 2020           March 31, 2020
  Net loss                                                                                                         $                   (58)     $                   (4)    $                     (672)

   Interest expense                                                                                                                      59                         56                            53

   Interest income                                                                                                                       (1)                        —                              (2)

   Provision for income taxes                                                                                                            44                         10                            37

   Depreciation and amortization                                                                                                       106                         103                           105

  EBITDA                                                                                                                               150                         165                           (479)

   Impact of fresh start accounting adjustments (1)                                                                                       1                         —                              (1)

   Restructuring charges (2)                                                                                                              6                          4                              3

   Advisory fees (3)                                                                                                                     —                          —                               1

   Share-based compensation                                                                                                              13                         14                              8

   Impairment of goodwill                                                                                                                —                          —                            624

   Gain on post-retirement plan settlement                                                                                             (14)                         —                             —

   Change in fair value of Emergence Date Warrants                                                                                       22                          5                             (6)

   (Gain) loss on foreign currency transactions                                                                                          (1)                         2                              7

   Gain on investments in equity and debt securities, net (4)                                                                            —                          —                              (8)

  Adjusted EBITDA                                                                                                                      177                         190                           149

  Adjusted EBITDA Margin                                                                                                               24.0 %                     25.6 %                         21.8 %

  1. The impact of fresh start accounting adjustments in connection with the Company's emergence from bankruptcy.
  2. Restructuring charges represent employee separation costs and facility exit costs (excluding the impact of accelerated depreciation expense) related to the Company's restructuring
     programs, net of sublease income.
  3. Advisory fees represent costs incurred to assist in the assessment of strategic and financial alternatives to improve the Company's capital structure.
  4. Realized and unrealized gains on investments in equity securities, net of impairment of investments in debt securities.

                  © 2021 Avaya Inc. All rights reserved                                                                                                                                                   32
Non-GAAP Reconciliation
  Adjusted EBITDA cont'd                                                                                                                   Successor                                          Predecessor           Non-GAAP Combined
                                                                                                              Fiscal years ended September 30,              Period from December        Period from October 1,
                                                                                                                                                              16, 2017 through               2017 through                Fiscal year ended
(In millions)                                                                                                      2020                    2019              September 30, 2018          December 15, 2017              September 30, 2018
Net (loss) income                                                                                         $               (680)     $             (671)     $                 287      $                  2,977     $               3,264
 Interest expense                                                                                                         226                      237                        169                            14                       183
 Interest income                                                                                                              (6)                   (14)                        (5)                           (2)                       (7)
 Provision for (benefit from) income taxes                                                                                   62                       2                      (546)                          459                        (87)
 Depreciation and amortization                                                                                            423                      443                        384                            31                       415
EBITDA                                                                                                                       25                      (3)                      289                         3,479                     3,768
 Impact of fresh start accounting adjustments (1)                                                                              1                      5                       196                             —                       196
 Restructuring charges (2)                                                                                                   20                     22                         81                            14                        95
 Advisory fees (3)                                                                                                           40                     11                         18                              3                       21
 Acquisition-related costs                                                                                                    —                       9                        15                             —                        15
 Reorganization items, net                                                                                                    —                      —                          —                         (3,416)                   (3,416)
 Share-based compensation                                                                                                    30                     25                         19                             —                        19
 Loss on sale/disposal of long-lived assets, net                                                                              —                      —                           4                             1                         5
 Resolution of certain legal matters                                                                                          —                      —                          —                            37                        37
 Impairment charges                                                                                                       624                      659                          —                             —                         —
 Change in fair value of Emergence Date Warrants                                                                               3                    (29)                       17                             —                        17
 Loss (gain) on foreign currency transactions                                                                                16                       8                        (28)                           —                        (28)
 Pension/OPEB/nonretirement postemployment benefits and long-term disability costs                                            —                      —                          —                            17                        17
 Gain on investments in equity and debt securities, net (4)                                                                  (49)                    (1)                        —                             —                         —
Adjusted EBITDA                                                                                           $               710       $              706      $                 611      $                    135     $                 746
Adjusted EBITDA Margin                                                                                                    24.7 %                  24.5 %                     27.2 %                        22.4 %                    26.2 %
1. The impact of fresh start accounting adjustments in connection with the Company's emergence from bankruptcy.
2. Restructuring charges represent employee separation costs and facility exit costs (excluding the impact of accelerated depreciation expense) related to the Company's restructuring programs, net of
   sublease income.
3. Advisory fees represent costs incurred to assist in the assessment of strategic and financial alternatives to improve the Company's capital structure.
4. Realized and unrealized gains on investments in equity securities, net of impairment of investments in debt securities.

                         © 2021 Avaya Inc. All rights reserved                                                                                                                                                                        33
Non-GAAP Reconciliation
      Net (Loss) Income and (Loss) Earnings per Share                                                                                      Three months ended,

                                                                              March 31, 2021               December 31, 2020                September 30, 2020              June 30, 2020                 March 31, 2020
GAAP Net (Loss) Income                                                  $                      (58)    $                        (4)    $                      37      $                       9     $                    (672)
Non-GAAP Adjustments:
  Impact of fresh start accounting                                                               1                              —                               1                             1                            —
  Restructuring charges, net                                                                     7                               4                              2                            19                             3
  Advisory fees                                                                                 —                               —                             —                              —                              1
  Share-based compensation                                                                      13                             14                               9                             7                             8
 Impairment of goodwill                                                                         —                               —                             —                              —                            624
 Change in fair value of Emergence Date Warrants                                                22                               5                             3                              3                            (6)
 (Gain) loss on foreign currency transactions                                                   (1)                              2                            —                               5                             7
 Gain on post-retirement plan settlement                                                       (14)                             —                             —                              —                             —
 Gain on investments in equity and debt securities, net                                         —                               —                             —                             (29)                           (8)
 Amortization of intangible assets                                                              82                              83                            83                             83                            85
 Income tax expense effects(1)                                                                  20                             (19)                          (49)                           (10)                           17
Non-GAAP Net Income                                                     $                       72     $                        85     $                      86      $                      88     $                      59

Dividends and accretion to preferred stockholders                       $                       (1)  $                         (1)  $                         (1)  $                         (1)  $                        (1)
Undistributed Non-GAAP Income                                                                   71                             84                             85                             87                            58
Percentage allocated to common stockholders(2)                                                91.3 %                         91.2 %                         91.2 %                         91.2 %                        92.2 %
Numerator for Non-GAAP diluted earnings per common share                $                       65   $                         77   $                         78   $                         79   $                       53

Diluted Weighted Average Shares - GAAP                                                        84.6                           83.8                           84.3                           83.3                          93.0
Incremental shares(3)                                                                          2.7                            1.4                             —                              —                            0.3
Diluted Weighted Average Shares - Non-GAAP                                                    87.3                           85.2                           84.3                           83.3                          93.3

GAAP (Loss) Earnings per Share - Diluted                                $                    (0.70)    $                     (0.06)    $                    0.39      $                    0.08     $                   (7.24)
Non-GAAP Earnings per Share - Diluted                                   $                     0.74     $                      0.90     $                    0.93      $                    0.95     $                    0.57
(1)The Company’s calculation of non-GAAP income taxes reflects a 25% fixed non-GAAP effective tax rate based on a blended U.S. federal and state tax rate, given the Company’s operating structure. The non-GAAP
effective tax rate may differ significantly from the GAAP effective tax rate. The non-GAAP effective tax rate could be subject to change for a number of reasons, including but not limited to, changes resulting from tax
legislation, material changes in revenues or expenses and other significant events. The Company will continuously assess its estimated non-GAAP effective tax rate in connection with its calculation of non-GAAP net
income and non-GAAP net income per diluted share in future periods.
(2)The Company’s preferred shares are participating securities, which requires the application of the two-class method to calculate diluted earnings per share. Under the two-class method, undistributed earnings are
allocated to common stock and participating securities according to their respective participating rights in undistributed earnings. The percentage allocated to common stockholders reflects the proportion weighted
average common stock outstanding to the weighted average of common stock and common stock equivalents (preferred shares).
(3)   In periods with a GAAP Net Loss, the incremental shares reflects the dilutive impact of certain securities, which are excluded from the computation of Diluted GAAP (loss) earnings per share as they are anti-dilutive.
                        © 2021 Avaya Inc. All rights reserved                                                                                                                                                             34
Non-GAAP Reconciliation
Gross Margin and Operating Income
                                                                                                    Three months ended,

    (In millions)                                           Mar. 31, 2021         Dec. 31, 2020         Sept. 30, 2020         June 30, 2020          Mar. 31, 2020
    Reconciliation of Non-GAAP Gross Profit
     and Non-GAAP Gross Margin
    Gross Profit                                        $             412     $             416     $             418      $             397      $              371

    Items excluded:

     Adj. for fresh start accounting                                    1                    —                      1                      1                          2

     Amortization of technology intangible assets                      43                    43                    44                     43                      44
    Non-GAAP Gross Profit                               $             456     $             459     $             463      $             441      $              417

    GAAP Gross Margin                                                55.8 %                56.0 %                55.4 %                  55.1 %                 54.4 %

    Non-GAAP Gross Margin                                            61.8 %                61.8 %                61.3 %                  61.2 %                 61.1 %

    Reconciliation of Non-GAAP Operating Income
    Operating Income (Loss)                             $              44     $              62     $              74      $              53      $             (597)
    Items excluded:

     Adj. for fresh start accounting                                    1                    —                      1                      1                      —

     Amortization of intangible assets                                 82                    83                    83                     83                      85
     Restructuring charges, net                                         8                     4                     3                     20                          4

     Advisory fees                                                     —                     —                     —                      —                           1

     Share-based compensation                                          13                    14                     9                      7                          8

     Impairment of goodwill                                            —                     —                     —                      —                      624

    Non-GAAP Operating Income                           $             148     $             163     $             170      $             164      $              125

    GAAP Operating Margin                                             6.0 %                 8.3 %                  9.8 %                  7.4 %                (87.5)%
    Non-GAAP Operating Margin                                        20.1 %                21.9 %                22.5 %                  22.7 %                 18.3 %

                © 2021 Avaya Inc. All rights reserved                                                                                                                     35
Non-GAAP Reconciliation
Operating expenses

                                                                                            Three months ended,

                      (In millions)                                       Mar. 31, 2021         Dec. 31, 2020         Mar. 31, 2020

                      Reconciliation of Non-GAAP Operating expenses

                      Operating expenses                              $             368     $             354     $              968

                      Items excluded:

                       Adj. for fresh start accounting                               —                     —                      (2)

                       Amortization of intangible assets                             39                    40                     41

                       Restructuring charges, net                                     8                     4                         4

                       Advisory fees                                                 —                     —                          1

                       Share-based compensation                                      13                    14                         8

                       Impairment of goodwill                                        —                     —                     624

                      Non-GAAP Operating expenses                     $             308     $             296     $              292

                      Non-GAAP Operating expense %                                 41.7 %                39.8 %                 42.8 %

         © 2021 Avaya Inc. All rights reserved                                                                                            36
Non-GAAP Reconciliation
Revenue and Gross Margin

                                                                                    Successor                             Predecessor           Non-GAAP Combined
                                                                                              Period from December    Period from October
                                                                     Fiscal year ended          16, 2017 through        1, 2017 through          Fiscal year ended
             (In millions)                                          September 30, 2019         September 30, 2018     December 15, 2017         September 30, 2018

             Reconciliation of Non-GAAP Revenue

             Revenue                                            $               2,887     $                 2,247     $            604      $                2,851

              Adj. for fresh start accounting                                      21                        206                     —                         206

             Non-GAAP Revenue                                   $               2,908     $                 2,453     $            604      $                3,057

             Reconciliation of Non-GAAP Gross Profit and Non-
             GAAP Gross Margin

             Gross Profit                                       $               1,575     $                 1,143     $            362      $                1,505

             Items excluded:

              Amortization of technology intangible assets                        174                        135                        3                      138

              Adj. for fresh start accounting                                      37                        264                     —                         264

              Loss on disposal of long-lived assets                                —                           4                     —                           4

              Share-based compensation                                             —                           1                     —                           1

             Non-GAAP Gross Profit                              $               1,786     $                 1,547     $            365      $                1,912

             GAAP Gross Margin                                                   54.6 %                      50.9 %                59.9 %                     52.8 %

             Non-GAAP Gross Margin                                               61.4 %                      63.1 %                60.4 %                     62.5 %

         © 2021 Avaya Inc. All rights reserved                                                                                                                         37
Non-GAAP Reconciliation
Product and Services Gross Margins

                                                                                                                  Three months ended,

(In millions)                                                 Mar. 31, 2021             Dec. 31, 2020               Sept. 30, 2020             June 30, 2020            Mar. 31, 2020
Reconciliation of Non-GAAP Gross Profit and Non-GAAP
Gross Margin - Products & Solutions
  Revenue                                                 $                   226   $                   266   $                  269       $              261       $                   245
  Costs                                                                       92                        105                      106                      103                            92
  Amortization of technology intangible assets                                43                         43                          44                        43                        44
GAAP Gross Profit                                                             91                        118                      119                      115                           109
Items excluded:
  Adj. for fresh start accounting                                              —                         —                           (1)                       1                          1
  Amortization of technology intangible assets                                43                         43                          44                        43                        44
Non-GAAP Gross Profit                                     $                   134   $                   161   $                  162       $              159       $                   154

GAAP Gross Margin                                                         40.3 %                    44.4 %                       44.2 %                   44.1 %                        44.5 %
Non-GAAP Gross Margin                                                     59.3 %                    60.5 %                       60.2 %                   60.9 %                        62.9 %

Reconciliation of Non-GAAP Gross Profit and Non-GAAP
Gross Margin - Services
  Revenue                                                 $                   512   $                   477   $                  486       $              460       $                   437
  Costs                                                                       191                       179                      187                      178                           175
GAAP Gross Profit                                                             321                       298                      299                      282                           262
Items excluded:
  Adj. for fresh start accounting                                              1                         —                           2                         —                          1

Non-GAAP Gross Profit                                     $                   322   $                   298   $                  301       $              282       $                   263

GAAP Gross Margin                                                         62.7 %                    62.5 %                       61.5 %                   61.3 %                        60.0 %
Non-GAAP Gross Margin                                                     62.9 %                    62.5 %                       61.9 %                   61.3 %                        60.2 %

                  © 2021 Avaya Inc. All rights reserved                                                                                                                                       38
Non-GAAP Reconciliation
Supplemental Schedules

Free Cash Flow                                                                                                   Net-Debt / Adjusted EBITDA
                                                                                                                                                   Mar. 31,
                                                                          Three Months Ended                     (In millions)                      2021

                                                            Mar. 31,   Dec. 31,   Sept. 30, June 30, Mar. 31,    Debt maturing within one year     $      —
(In millions)                                                2021       2020       2020       2020    2020       Long-term debt, net of current
Net cash (used for) provided by operating                                                                        portion                               2,800
activities                                $                      (24) $     48 $       70 $      45 $     20
                                                                                                                 Less: Cash and cash equivalents        593
Less:
                                                                                                                 Net-debt                          $ 2,207
Capital expenditures                                              26        27         26        24       22
                                                                                                                 Adjusted EBITDA (TTM)             $    754
Free cash flow                                          $        (50) $     21 $       44 $      21 $      (2)
                                                                                                                 Net-debt / Adjusted EBITDA              2.9 x

                © 2021 Avaya Inc. All rights reserved                                                                                                            39
You can also read