The AES Corporation Wolfe Research Utilities & Energy Conference - October 2, 2018
←
→
Page content transcription
If your browser does not render page correctly, please read the page content below
October 2, 2018

The AES Corporation
Wolfe Research Utilities & Energy Conference
Safe Harbor Disclosure

  Certain statements in the following presentation regarding AES business operations may constitute
   forward-looking statements. Such forward-looking statements include, but are not limited to, those
  related to future earnings growth and financial and operating performance. Forward-looking statements
  are not intended to be a guarantee of future results, but instead constitute AES current expectations
  based on reasonable assumptions. Forecasted financial information is based on certain material
  assumptions. These assumptions include, but are not limited to, accurate projections of future interest
  rates, commodity prices and foreign currency pricing, continued normal or better levels of operating
  performance and electricity demand at our distribution companies and operational performance at our
  generation businesses consistent with historical levels, as well as achievements of planned productivity
  improvements and incremental growth from investments at investment levels and rates of return
  consistent with prior experience. For additional assumptions see Slide 31 and the Appendix to this
  presentation. Actual results could differ materially from those projected in our forward-looking
  statements due to risks, uncertainties and other factors. Important factors that could affect actual results
  are discussed in AES filings with the Securities and Exchange Commission including but not limited to
  the risks discussed under Item 1A Risk Factors and Item 7: “Management’s Discussion & Analysis” in
  AES’ 2017 Annual Report on Form 10-K, as well as our other SEC filings. AES undertakes no obligation
  to update or revise any forward-looking statements, whether as a result of new information, future
  events or otherwise.

  Reconciliation to U.S. GAAP Financial Information
  The following presentation includes certain “non-GAAP financial measures” as defined in Regulation G
  under the Securities Exchange Act of 1934, as amended. Schedules are included herein that reconcile
  the non-GAAP financial measures included in the following presentation to the most directly comparable
  financial measures calculated and presented in accordance with U.S. GAAP.
Contains Forward-Looking Statements                                                                              2
Investment Thesis
l Improving risk profile
Simplified portfolio; reduced complexity, as well as sensitivity to commodities and FX
Reduced debt and leverage; on track to achieve investment grade metrics by 2019
Achieved significant cost reductions (continuing)
Lengthening average contract life while reducing carbon intensity
l Construction program on track to deliver earnings growth through 2020
l Making substantial progress on renewable growth strategy
YTD, signed 1.5 GW long-term power purchase agreements
Achieving double-digit returns on executed projects
l Capitalizing on existing platforms and new technologies
LNG infrastructure – upside from uncontracted capacity
Fluence energy storage Joint Venture with Siemens
l Compelling valuation
4% yield; 11x P/2018E; 8%-10% annual EPS growth through 2020
Contains Forward-Looking Statements 3
Improving Risk Profile

                                                     2011     2018     Change

Impact from Movements in
Foreign Currencies,                                  $0.21    $0.06     71%
Commodities and Hydrology1

Countries with Operations                             28       15       13

                                                                        $2,679 or
Parent Debt ($ in Millions)                          $6,515   $3,836
                                                                        41%

                                                                        2-3
Credit Rating                                        B+/BB-    BB+
                                                                        notches

1.   Annual EPS at risk at a 95% confidence level.

Contains Forward-Looking Statements                                                 4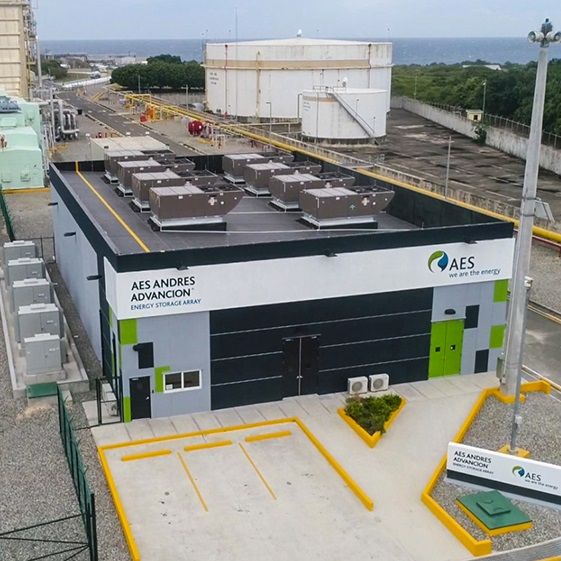
Improving Risk Profile: Successfully Extending Contract
Duration of Generation Portfolio, Which Represents ~85%
of Portfolio Profitability

                                      Average Contract Life
                                            (Years)

                                                                     10
                                                              ● Growth:
                                                8
                          7                                     Southland,
                                         ● Growth:              OPGC 2,
                                           sPower,              Mesa La Paz,
                                           Colón CCGT           renewable
                                                                growth
                                         ● Sales: DPL,
                                           Kazakhstan,
                                           Masinloc

                       2017                   2018                 2020
      Blended Average Life is 13 Years in 2020, After Considering Regulated
            Utilities1, Which Represent ~15% of Portfolio Profitability

1. Assumes 30-year life as a proxy.

Contains Forward-Looking Statements                                            5
Improving Risk Portfolio: Replacing Coal Capacity with
Renewables and Natural Gas

                    23%                           26%
                                                                                   38%

                    32%
                                                  37%
                                                                                   33%

                    41%
                                                  33%
                                                                                   27%

          Year-End 2015                      Year-End 2017                 Year-End 2020
                                Coal   Gas   Renewables   Oil, Pet Coke & Diesel

        In 2017, Announced Exit of 4.3 GW, or 30%, of Coal-Fired Capacity

Contains Forward-Looking Statements                                                        6
Profitable Growth: 4.9 GW Currently Under Construction
or Recently Completed
2,2211 4,9361
2,715 3,872
1,651
1,064 1,064
2018 2020 Total
Completed Under Construction
1. Includes 100 MW Alamitos Energy Center, which is expected to come on-line in 1H 2021.
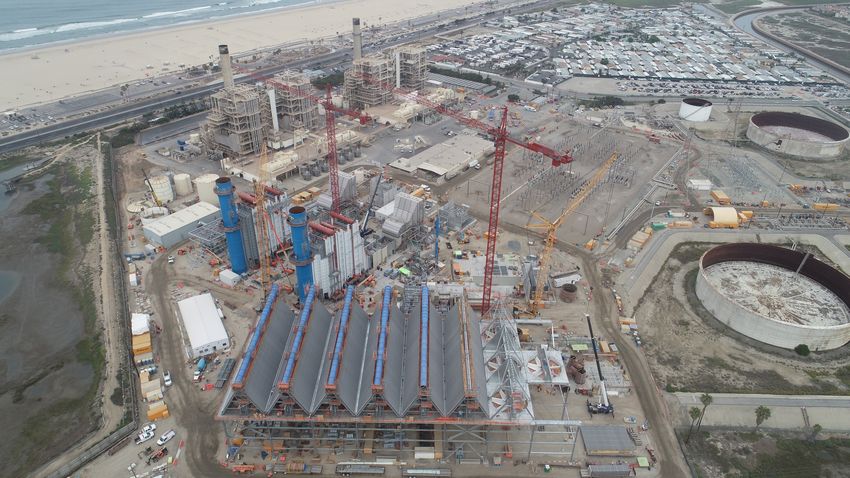
Contains Forward-Looking Statements 7Profitable Growth: Southland in California
1,284 MW CCGT and 100 MW Energy Storage
l 20-year PPAs with Southern
California Edison
l COD1 of 1,284 MW CCGT expected
in 1H 2020
l 100 MW of 4-hour duration energy
storage coming on-line in 1H 2021
1. Commercial Operations Date.
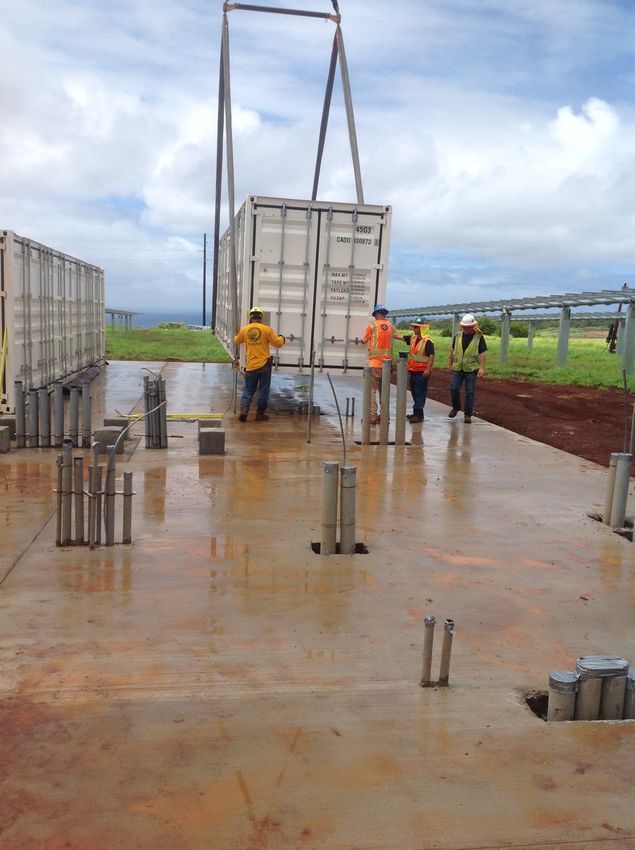
Contains Forward-Looking Statements 8Profitable Growth: Pioneering Solar + Storage
Two Projects: 47 MW of Solar Plus 34 MW of 5-Hour Duration Energy
Storage in Hawaii
l 25-year PPAs with Kaua’i Island
Utility Cooperative (KIUC)
l Provides peaking capacity and 24/7
energy
l At 170 MWh, it will be the biggest
solar + storage installation in the
world
l COD1 expected in 2018-2019
1. Commercial Operations Date.
Contains Forward-Looking Statements 9Profitable Growth: Delivering Attractive Risk-Adjusted
Returns
Focus: Natural Gas & Renewables with Long-Term, USD-Denominated Contracts
Levered After-Tax Returns on 2017-2018 Renewable Growth Investments
17%
16%
11%
1
US Brazil MCAC
1. Mexico, Central America and the Caribbean.
Contains Forward-Looking Statements 10Profitable Growth: New Long-Term Contracts for
Renewables (PPAs)
Expect to Sign 7.5 GW of Renewable PPAs Through 2020
3,000 7,500
2,500
6,0271
2,000
1,473 1,473
2018 2019 2020 Total
Signed as of 8/6/18 Projected
1. For each year, half the projected amount is expected to come on-line in the following year and the remaining half in the second year. Thus, the projected
amount through 2020 would all be on-line by 2022.
Contains Forward-Looking Statements 11Profitable Growth: Current Backlog of 5.3 GW; On Pace to
Sign 6 GW of Additional PPAs Through 2020
Backlog = Under Construction + Signed PPAs
4,3501 11,372
4,250
6,027
3,936
1,514
1,473
1,357 2,121
5,345 MW
1,729 1,094 Backlog
3,872
1,651
2018 2019 2020 2021-2022 Total
Under Construction COD of Signed PPAs COD of Projected PPAs
(as of 8/6/18) (2018-2020)
Note: 2018 includes COD of 78 MW of PPAs signed; 2019 includes 264 MW of PPAs projected; 2020 includes COD of 301 MW of PPAs signed; 2021-2022 includes
COD of 100 MW under construction.
1. Includes half of capacity signed in 2019 and all capacity signed in 2020, as shown on Slide 11.
Contains Forward-Looking Statements 12Profitable Growth: Adding 11.4 GW of New Capacity
Significantly Extending Average Contract Life and
Reducing Carbon Intensity
Conventional 23%
77%
Renewables
By 2020: Extending Average Contract Life to 10 Years From 8 and
Reducing Carbon Intensity by 25%
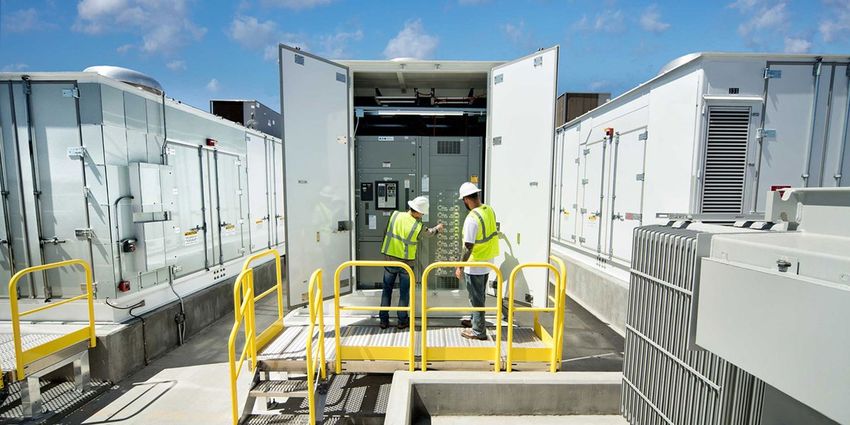
Contains Forward-Looking Statements 13Applying New Technologies
Fluence Energy Storage Joint Venture with Siemens
l Since May
Signed contracts for 80 MW
Delivered and installed 55 MW
l Our global presence
Delivered and installed 271 MW
Contains Forward-Looking Statements 14Adjusted EPS1 Guidance and Expectations
$ Per Share
$1.15-$1.25
$1.08 + New businesses,
including US
renewables, full year
of DPP CCGT, Colón
CCGT 8%-10%
+ DPL regulatory
+ South America Average
+ Cost savings Annual
+ Parent interest
− Sales of Masinloc, Growth2
Kazakhstan
− Tax reform
2017 Actual 2018 Guidance 2020 Expectation
1. A non-GAAP financial measure. See Appendix for definition. The Company is not able to provide a corresponding GAAP equivalent or reconciliation for its
Adjusted EPS guidance without unreasonable effort. See Slide 30 for a description of the adjustments to reconcile Adjusted EPS to diluted EPS for YTD 2018.
2. From 2017 Adjusted EPS of $1.08.
Contains Forward-Looking Statements 15Parent Free Cash Flow1 Expectations
$ in Millions
$600-$675
$637
+ Higher margins
+ Cost savings 8%-10%
+ Parent interest Average
− Gener
− Utility tax sharing Annual
payments Growth2
− Restructuring
costs
2017 Actual 2018 Expectation 2020 Expectation
1. A non-GAAP financial measure. See Appendix for definition.
2. From 2017 Parent Free Cash Flow of $637 million.
Contains Forward-Looking Statements 16$4.2 Billion in Discretionary Cash Being Generated 2018-
2020
$ in Millions
$2,219 $4,230
$769
$1,231
$11
2
2018 Beginning Proceeds from Remaining Asset Parent FCF Total
Cash Completed Asset Sale Procceds Discretionary
Sales1 Target Cash
1. Includes net proceeds of: $985 Masinloc (Philippines) and $246 Eletropaulo (Brazil).
2. A non-GAAP financial measure. See Appendix for definition. Parent Free Cash Flow based on the mid-point of 2018 expectation of $638, plus $1,581 for 2019-
2020 (based on the mid-point of our 8%-10% average annual growth rate off 2017 actual of $637).
Contains Forward-Looking Statements 172018-2020: $4.2 Billion of Discretionary Cash Available for
Allocation
$ in Millions Unallocated Discretionary
Cash
Potential Debt Paydown l Growth investments
l Return of cash to
$450 shareholders
$600 Investments in Projected
$150 PPAs COD1 in 2021
2018 Debt Prepayment/
Repayment of Revolver $1,200 Investments in Backlog and
& Other Temporary $800 Projected PPAs COD1
Borrowings Through 2020
$1,030
Current Dividend2
Disciplined Capital Allocation to Maximize Risk-Adjusted
Total Shareholder Return
1. Commercial Operations Date.
2. Assumes constant payment of $0.13 per share each quarter on 660 million shares outstanding.
Contains Forward-Looking Statements 18Continuing to Transform and Simplify, While Achieving
Our Financial Objectives
Strong Portfolio of Contracted Generation and Regulated Utilities
Improving Risk Profile Efficiency Profitable Growth
l On track to achieve l Implemented $100 l 3.9 GW under
investment grade million cost savings construction
l Reshaping portfolio program l Delivering attractive
Improving average returns from renewables,
contract life LNG and new
Reducing carbon technologies
intensity
Attractive Dividend Yield and 8% to 10% Average Annual Growth in
Adjusted EPS1 and Parent Free Cash Flow1 Through 2020
1. A non-GAAP financial measure. See Appendix for definition.
Contains Forward-Looking Statements 19Appendix l AES in Argentina Slides 21-22 l Currencies and Commodities Slides 23-25 l AES Modeling Disclosures Slide 26 l 2018 Adjusted PTC1 Modeling Ranges Slide 27 l Construction Program Slide 28 l PPAs Signed Year-to-Date Slide 29 l Reconciliation Slide 30 l Assumptions & Definitions Slides 31-33 1. A non-GAAP financial measure. Contains Forward-Looking Statements 20
AES in Argentina: A Diversified and Low-Cost Source of
Generation

                 3.5 GW of Generation                                                                             Merit Order
     TermoAndes                                                                      100
     (643 MW, gas/                              El Tunal
     diesel)                               (10 MW, hydro)
                                                                                     90                                                            Peak
                                             Cabra Corral                                                                                         Demand
                                          (102 MW, hydro)                            80

                                                   Ullum                             70
                                           (45 MW, hydro)

                                                             Variable Cost ($/MWh)
                                                                                     60                                                     San Nicolás
                                               Sarmiento
                                       (33 MW, gas/diesel)                           50

                                             San Nicolás                             40                    TermoAndes
                                           (675 MW, coal/
                                               gas/diesel)                           30
                                                                                                                        Paraná-GT

                                                                                               Alicura,
                                              Paraná-GT                                         Cabra
                                      (845 MW, gas/diesel)                           20         Corral,
                                                                                               El Tunal,
                                                                                                Ullum                                                  ST &
                                              Energética1                            10                                                               Less
                                           (100 MW, wind)                                                       Nuclear               Efficient      Efficient
                                                                                                Hydro          & CCGTs                  GTs            GTs       Other
                                                 Alicura                              0
                                        (1,050 MW, hydro)                                  0            5000      10000       15000      20000        25000      30000

        >80% of Capacity is Low Cost and Required to Meet System Average Demand

1.    Under construction.

Contains Forward-Looking Statements                                                                                                                                      21
Increased Residential Tariff Due to Decreased Subsidies
and FX Devaluation; Tariff Remains Competitive
Residential Tariff in Argentina Residential Tariff Comparison Annual Energy Demand in
(US$/KWh)1 (US$/KWh) Argentina (TWh)
Expected
2019 Tariff
$0.19 133.1
Increase $0.18 132.4
$0.10 132.1
$0.03
Expected
$0.12 2019 Tariff
Increase
126.5
$0.08 $0.03 125.2
$0.04
$0.07
$0.07
$0.01
2015 2016 2017 2018 Colombia Mexico Brazil Arge ntina Chile 2013 2014 2015 2016 2017
Residential Tariff Still Lower Than Neighboring Countries;
Demand Not Impacted by Sizable Tariff Increases
1. Tariff as of December 2015, December 2016, December 2017 and September 2018; 2018 tariff reflects significant devaluation that occurred in 2018.
Contains Forward-Looking Statements 22Year-to-Go 2018 Guidance Estimated Sensitivities
Interest Rates1 l 100 bps move in interest rates over year-to-go 2018 is forecasted to have a change in EPS of approximately $0.010
10% appreciation in USD against the Year-to-Go 2018
following key currencies is forecasted to
have the following negative EPS impacts: Average Rate Sensitivity
Brazilian Real (BRL) 3.91 Less than $0.005, Long Exposure
Colombian Peso (COP) 2,944 $0.005, Long Exposure
Currencies Euro (EUR) 1.18 Less than $0.005, Long Exposure
Great British Pound (GBP) 1.33 Less than $0.005, Long Exposure
Argentine Peso (ARS) 30.36 $0.005, Long Exposure
Chilean Peso (CLP) 654 Less than ($0.005), Short Exposure
Mexican Peso (MXN) 20.19 ($0.010), Short Exposure
10% increase in commodity prices is Year-to-Go 2018
forecasted to have the following EPS
impacts: Average Rate Sensitivity
Illinois Basin Coal $39/ton
Less than $0.005, Short Exposure
Rotterdam Coal (API 2) $97/ton
Commodity NYMEX WTI Crude Oil $72/bbl
Less than $0.005, Long Exposure
IPE Brent Crude Oil $79/bbl
NYMEX Henry Hub Natural Gas $3.0/mmbtu
$0.005, Long Exposure
UK National Balancing Point Natural Gas £0.6/therm
US Power (DPL) – PJM AD Hub $32/MWh Less than $0.005, Long Exposure
Note: Guidance provided on August 7, 2018. Sensitivities are provided on a standalone basis, assuming no change in the other factors, to illustrate the magnitude and direction of
changing market factors on AES’ results. Estimates show the impact on year-to-go 2018 Adjusted EPS. Actual results may differ from the sensitivities provided due to execution of risk
management strategies, local market dynamics and operational factors. Full year 2018 guidance is based on currency and commodity forward curves and forecasts as of June 30,
2018. There are inherent uncertainties in the forecasting process and actual results may differ from projections. The Company undertakes no obligation to update the guidance
presented. Please see Item 1 of the Form 10-K for a more complete discussion of this topic. AES has exposure to multiple coal, oil, and natural gas, and power indices; forward curves
are provided for representative liquid markets. Sensitivities are rounded to the nearest $0.005 cent per share.
1. The move is applied to the floating interest rate portfolio balances as of June 30, 2018.
Contains Forward-Looking Statements 23Foreign Exchange (FX) Risk Before Hedges
Cents Per Share, Exposures Before Hedges
Full Year 2020 FX Sensitivity by Currency1
Long Exposures
2.0
1.0 1.0
0.5 0.5
0.5
1.5
Short Exposures
Argentine Peso Brazilian Real Chilean Peso Colombian Peso Euro Indian Rupee Total
l 2020 correlated FX risk before hedges is $0.02 for 10% USD appreciation
l FX risk mitigated on a rolling basis by active FX hedging
1. Sensitivity represents full year 2020 exposure to a 10% appreciation of USD relative to foreign currency as of December 31, 2017.
Contains Forward-Looking Statements 24Commodity Exposure is Mostly Hedged in the Medium- to
Long-Term
Cents Per Share
Full Year 2020 Adjusted EPS1 Commodity Sensitivity2 for 10% Change in
Commodity Prices
0.5 0.5
Coal Gas Oil
1. A non-GAAP financial measure. See “definitions”.
2. Domestic and International sensitivities are combined and assumes each fuel category moves 10% relative to commodities as of December 31, 2017. Adjusted
EPS is negatively correlated to coal price movement, and positively correlated to gas, oil and power price movements.
Contains Forward-Looking Statements 25AES Modeling Disclosures
$ in Millions
Parent Company Cash Flow Assumptions 2017 2018
Subsidiary Distributions (a) $1,203 $1,100-$1,175
Cash Interest (b) ($290) ($250)
Corporate Overhead ($179) ($140)
Parent-Funded SBU Overhead ($93) ($90)
Business Development ($4) ($20)
Cash for Development, General & Administrative
($276) ($250)
and Tax (c)
Parent Free Cash Flow1 (a – b – c) $637 $600-$675
1. A non-GAAP financial measure. See “definitions”.
Contains Forward-Looking Statements 262018 Adjusted PTC Modeling Ranges
$ in Millions
2018 Adjusted PTC Modeling
SBU Drivers of Growth Versus 2017
Ranges as of 5/8/181
+ Solar
US and Utilities $440-$500 + DPL regulatory
+ 2017 impact of hurricanes
+ Argentina reforms
+ Higher generation at Chivor
South America $530-$590
+ Higher generation in Chile
− 2017 gain on legal settlement
MCAC $300-$330 + Full year of DPP CCGT
− Masinloc
Eurasia $180-$210
− Kazakhstan
Total SBUs $1,450-$1,630
+ G&A savings
Corporate & Other2 ($340)-($380)
+ Parent interest
Total AES Adjusted PTC1,2 $1,110-$1,250
1. A non-GAAP financial metric. See “definitions”.
2. Total AES Adjusted PTC includes after-tax adjusted equity in earnings.
Contains Forward-Looking Statements 27Projects Under Construction: Earning Double Digit After-
Tax Returns
$ in Millions, Unless Otherwise Stated
Total
AES Fuel/ Gross Expected
Project Country Total Capex AES Comments
Ownership Technology MW COD
Equity
Construction Projects Coming On-Line 2018-2021
Wind/Solar/ 2H 2018-
Global Renewables Various 24%-100% 737 $808 $136
Energy Storage 1H 2021
OPGC 2 India 49% Coal 1,320 2H 2018 $1,585 $227
Southland
US-CA 100% Gas 1,284 1H 2020 $2,287 $329
Repowering
Alto Maipo Chile 62% Hydro 531 2H 2020 $3,439 $683
Total 3,872 $8,119 $1,375
Contains Forward-Looking Statements 28PPAs Signed Year-to-Date 20181
AES Equity Expected PPA Length
Project Location Technology Gross MW Interest COD2 (Years)
Winterfell (sPower) US-ID Solar 40 50% In Operation3 18
Riverhead Solar (sPower) US-CA Solar 20 50% 2H 2018 30
Rhode Island C&I (AES DE) US-RI Solar 12 100% 2H 2018 25
LIPA-PSEG (AES DE) US-NY Solar 6 100% 2H 2018 17
Six Flags – Valencia (sPower) US-CA Solar 10 50% 1H 2019 25
Six Flags – Vallego (sPower) US-CA Solar 6 50% 1H 2019 25
San Pablo (sPower) US-CA Solar 100 50% 1H 2019 22
AGV Solar 2 (AES Tietê) Brazil Solar 75 24% 1H 2019 20
Highlander (sPower) US-VA Solar 501 50% 2H 2019 15
Basin Electric (sPower) US-SD Wind 220 50% 2H 2019 30
MA SMART (AES DE) US-MA Solar 102 100% 2H 2019 20
Sand Hill C (sPower) US-CA Wind 80 50% 2H 2019 21
Energética (AES Argentina) Argentina Wind 100 100% 1H 2020 20
Seneca Phase 1 (sPower) US-OH Wind 201 50% 2H 2020 25
Total 1,473
1. As of August 6, 2018.
2. Commercial Operations Date.
3. Acquisition expected to close in 2H 2018.
Contains Forward-Looking Statements 29Reconciliation of YTD Adjusted PTC1 and Adjusted EPS1
YTD 2018 YTD 2017
Per Share Per Share
Net of NCI2 (Diluted) Net of Net of NCI2 (Diluted) Net of
$ in Millions, Except Per Share Amounts NCI2 NCI2
Income from Continuing Operations, Net of Tax, Attributable to AES and
$781 $1.18 $29 $0.04
Diluted EPS
Add: Income Tax Expense from Continuing Operations Attributable to AES $291 $70
Pre-Tax Contribution $1,072 $99
Adjustments
Unrealized Derivative and Equity Securities Losses (Gains) ($12) ($0.02) $1 -
Unrealized Foreign Currency Losses (Gains) $49 $0.073 ($33) ($0.04)
Disposition/Acquisition Losses (Gains) ($839) ($1.26)4 $108 $0.165
Impairment Expense $92 $0.146 $262 $0.407
Losses (Gains) on Extinguishment of Debt $178 $0.278 ($5) ($0.01)
Restructuring Costs $3 - - -
Less: Net Income Tax Expense (Benefit) $0.149 ($0.13)10
Adjusted PTC 1 & Adjusted EPS 1 $543 $0.52 $432 $0.42
1. Non-GAAP financial measures. See “definitions”.
2. NCI is defined as Noncontrolling Interests.
3. Amount primarily relates to unrealized FX losses of $22 million, or $0.03 per share, associated with the devaluation of long-term receivables denominated in Argentine pesos, and unrealized FX
losses of $12 million, or $0.02 per share, associated with the devaluation of receivables denominated in Chilean pesos.
4. Amount primarily relates to gain on sale of Masinloc of $777 million, or $1.17 per share, gain on sale of Eletrica Santiago of $49 million, or $0.07 per share, and realized derivative gains
associated with the sale of Eletropaulo of $17 million, or $0.03 per share.
5. Amount primarily relates to loss on sale of Kazakhstan CHPs of $48 million, or $0.07 per share, realized derivative losses associated with the sale of Sul of $38 million, or $0.06 per share, and
costs associated with early plant closures at DPL of $20 million, or $0.03 per share.
6. Amount primarily relates to the asset impairment at a U.S. generation facility of $83 million, or $0.13 per share.
7. Amount primarily relates to asset impairments at Kazakhstan HPPs of $90 million, or $0.14 per share, Kazakhstan CHPs of $94 million, or $0.14 per share, and DPL of $66 million, or $0.10 per
share.
8. Amount primarily relates to loss on early retirement of debt at the Parent Company of $169 million, or $0.26 per share.
9. Amount primarily relates to the income tax expense under the GILTI provision associated with gain on sale of Masinloc of $155 million, or $0.23 per share, and income tax expense associated
with the gain on sale of Eletrica Santiago of $23 million, or $0.04 per share; partially offset by income tax benefits associated with the loss on early retirement of debt at the Parent Company of
$52 million, or $0.08 per share, and income tax benefits associated with the impairment at a U.S. generation facility of $26 million, or $0.04 per share.
10. Amount primarily relates to the income tax benefit associated with asset impairments of $81 million, or $0.12 per share.
Contains Forward-Looking Statements 30Assumptions Forecasted financial information is based on certain material assumptions. Such assumptions include, but are not limited to: (a) no unforeseen external events such as wars, depressions, or economic or political disruptions occur; (b) businesses continue to operate in a manner consistent with or better than prior operating performance, including achievement of planned productivity improvements including benefits of global sourcing, and in accordance with the provisions of their relevant contracts or concessions; (c) new business opportunities are available to AES in sufficient quantity to achieve its growth objectives; (d) no material disruptions or discontinuities occur in the Gross Domestic Product (GDP), foreign exchange rates, inflation or interest rates during the forecast period; and (e) material business-specific risks as described in the Company’s SEC filings do not occur individually or cumulatively. In addition, benefits from global sourcing include avoided costs, reduction in capital project costs versus budgetary estimates, and projected savings based on assumed spend volume which may or may not actually be achieved. Also, improvement in certain Key Performance Indicators (KPIs) such as equivalent forced outage rate and commercial availability may not improve financial performance at all facilities based on commercial terms and conditions. These benefits will not be fully reflected in the Company s consolidated financial results. The cash held at qualified holding companies ( QHCs ) represents cash sent to subsidiaries of the Company domiciled outside of the U.S. Such subsidiaries had no contractual restrictions on their ability to send cash to AES, the Parent Company; however, cash held at qualified holding companies does not reflect the impact of any tax liabilities that may result from any such cash being repatriated to the Parent Company in the U.S. Cash at those subsidiaries was used for investment and related activities outside of the U.S. These investments included equity investments and loans to other foreign subsidiaries as well as development and general costs and expenses incurred outside the U.S. Since the cash held by these QHCs is available to the Parent, AES uses the combined measure of subsidiary distributions to Parent and QHCs as a useful measure of cash available to the Parent to meet its international liquidity needs. AES believes that unconsolidated parent company liquidity is important to the liquidity position of AES as a parent company because of the non-recourse nature of most of AES’ indebtedness. Contains Forward-Looking Statements 31
Definitions

l   Adjusted Earnings Per Share, a non-GAAP financial measure, is defined as diluted earnings per share from continuing operations excluding gains or
    losses of both consolidated entities and entities accounted for under the equity method due to (a) unrealized gains or losses related to derivative transactions
    and equity securities; (b) unrealized foreign currency gains or losses; (c) gains, losses, benefits and costs associated with dispositions and acquisitions of
    business interests, including early plant closures, and the tax impact from the repatriation of sales proceeds; (d) losses due to impairments; (e) gains, losses
    and costs due to the early retirement of debt; (f) costs directly associated with a major restructuring program, including, but not limited to, workforce reduction
    efforts, relocations, and office consolidation; and (g) tax benefit or expense related to the enactment effects of 2017 U.S. tax law reform.
l   Adjusted Pre-Tax Contribution, a non-GAAP financial measure, is defined as pre-tax income from continuing operations attributable to The AES
    Corporation excluding gains or losses of the consolidated entity due to (a) unrealized gains or losses related to derivative transactions and equity securities;
    (b) unrealized foreign currency gains or losses; (c) gains, losses, benefits and costs associated with dispositions and acquisitions of business interests,
    including early plant closures; (d) losses due to impairments; (e) gains, losses and costs due to the early retirement of debt; and (f) costs directly associated
    with a major restructuring program, including, but not limited to, workforce reduction efforts, relocations, and office consolidation. Adjusted PTC also includes
    net equity in earnings of affiliates on an after-tax basis adjusted for the same gains or losses excluded from consolidated entities. Adjusted PTC reflects the
    impact of NCI and excludes the items specified in the definition above. In addition to the revenue and cost of sales reflected in Operating Margin, Adjusted
    PTC includes the other components of our income statement, such as general and administrative expenses in the corporate segment, as well as business
    development costs, interest expense and interest income, other expense and other income, realized foreign currency transaction gains and losses, and net
    equity in earnings of affiliates.
l   NCI is defined as noncontrolling interests.
l   Parent Company Liquidity (a non-GAAP financial measure) is defined as as cash available to the Parent Company plus available borrowings under existing
    credit facility plus cash at qualified holding companies (“QHCs”). The cash held at qualified holding companies represents cash sent to subsidiaries of the
    Company domiciled outside of the U.S. Such subsidiaries have no contractual restrictions on their ability to send cash to the Parent Company.
l   Parent Free Cash Flow (a non-GAAP financial measure) should not be construed as an alternative to Net Cash Provided by Operating Activities which is
    determined in accordance with GAAP. Parent Free Cash Flow is equal to Subsidiary Distributions less cash used for interest costs, development, general
    and administrative activities, and tax payments by the Parent Company. Parent Free Cash Flow is used for dividends, share repurchases, growth
    investments, recourse debt repayments, and other uses by the Parent Company.
l   Subsidiary Liquidity (a non-GAAP financial measure) is defined as cash and cash equivalents and bank lines of credit at various subsidiaries.
l   Subsidiary Distributions should not be construed as an alternative to Net Cash Provided by Operating Activities which is determined in accordance with
    GAAP. Subsidiary Distributions are important to the Parent Company because the Parent Company is a holding company that does not derive any
    significant direct revenues from its own activities but instead relies on its subsidiaries’ business activities and the resultant distributions to fund the debt
    service, investment and other cash needs of the holding company. The reconciliation of the difference between the Subsidiary Distributions and Net Cash
    Provided by Operating Activities consists of cash generated from operating activities that is retained at the subsidiaries for a variety of reasons which are
    both discretionary and non-discretionary in nature. These factors include, but are not limited to, retention of cash to fund capital expenditures at the
    subsidiary, cash retention associated with non-recourse debt covenant restrictions and related debt service requirements at the subsidiaries, retention of
    cash related to sufficiency of local GAAP statutory retained earnings at the subsidiaries, retention of cash for working capital needs at the subsidiaries, and
    other similar timing differences between when the cash is generated at the subsidiaries and when it reaches the Parent Company and related holding
    companies.

Contains Forward-Looking Statements                                                                                                                                       32
You can also read