Investor Presentation - May - June 2019 - Gerresheimer
←
→
Page content transcription
If your browser does not render page correctly, please read the page content below
Investor Presentation

May – June 2019

Disclaimer

 This presentation may contain certain forward-looking statements, including assumptions, opinions and views of the
 Company or cited from third party sources. Various known and unknown risks, uncertainties and other factors could
 cause the actual results, financial position, development or performance of the Company to differ materially from the
 estimations expressed or implied herein.

 The Company does not guarantee that the assumptions underlying such forward-looking statements are free from
 errors nor does the Company accept any responsibility for the future accuracy of the opinions expressed in this
 presentation or the actual occurrence of the forecast development.

 No representation or warranty (express or implied) is made as to, and no reliance should be placed on, any
 information, including projections, estimates, targets and opinions, contained herein, and no liability whatsoever is
 accepted as to any errors, omissions or misstatements contained herein, and, accordingly, none of the Company or
 any of its parent or subsidiary undertakings or any of such person‘s officers, directors or employees accepts any
 liability whatsoever arising directly or indirectly from the use of this document.

 For an overview of abbreviations and definition please see the glossary slide in the backup section

           Investor Presentation                                                                                     2
Agenda

  1         Gerresheimer at a glance                            P. 4

  2         Excellent fundament for profitable growth           P. 7

  3         Q1 2019: A good start into the year                 P. 16

  4         Operational and financial framework for 2019-2022   P. 18

  5         Appendix                                            P. 21

      Investor Presentation                                             3
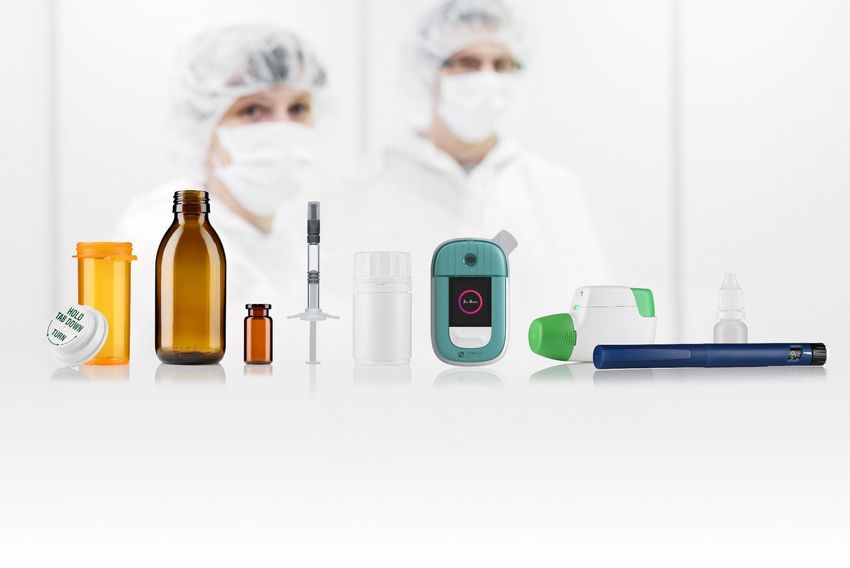
A leading international manufacturer for the global pharma and
healthcare industry

 Pharmaceutical packaging solutions made out of glass and plastics

 Primary packaging products and medical devices for storage, dosage and safe administration
 of drugs as well as packaging for the cosmetics industry

          Investor Presentation                                                               4
Strong business foundations, developing our business model
beyond our current setup to capture longer term potential
Solid financial profile                    Leading market positions in Well invested assets &                                                            Clearly identified
                                           attractive niche markets    factories, solid customer                                                         revenues streams
                                                                       basis
                                                                                                                                   Delivering to
   Revenues
                       Adj. EBITDA                   #1                           #1                                                                             5%          REVENUE SPLIT BY SECTOR
                        FY 2018                                                                        38 plants in                    95                 13%
 EUR 1.37bn                                 in Europe for plastic             in the US for                                                                                  Pharma & Healthcare: 82%
                    EUR 298.6m                 packaging and                prescription and           14 countries              countries over 5                            Cosmetics: 13%
                                                 inhalation                    injectables                                         continents                                Others: 5%
                                                                                                                                                                      82%
 Strong Cash Flow generation                                                                                Over                   Supplying all
  and lower capital intensity                    #2                                                                                                                          REVENUE SPLIT BY REGIONS
                                                               Strong emerging market                     1500                      Top 10                       2%
                                                               presence in South America,                                                                  15%               Europe (ex. GER): 34%
                                            in Europe for                                                customers             Pharma customers                        34%   Germany: 22%
                                           diabetes, pens           India and China for plastic
 Op. CF margin at 12.3% for FY 2018                                                                                                                                          Americas: 27%
                                            and syringes            packaging, pens, moulded
                                                                                                                                                        27%                  Emerging markets1: 15%
                                                                    glass, ampoules, vials and      Largest customer makes up for only 7% of total
 Leverage at 3.1x as of Nov 30, 2018                                                                                                                                         Other regions: 2%
                                                                            cartridges                                revenues                                    22%

Plastics & Devices                                                          Primary Packaging Glass                                            Advanced Technologies
   Revenues            Adj. EBITDA          Margin                                Revenues          Adj. EBITDA           Margin
     2018                  2018             2018                                    2018                2018              2018                      Technology & Platform operator
EUR 751.3m          EUR 203.0m             27.0%                             EUR 605.3m           EUR 114.7m             19.0%
                                                                                                                                                              Created July 20182

                                                                                                                                                          Revenues              Adj. EBITDA
                                                                                                                                                            2018                   Revenues
                                                                                                                                                                                    2018
                                                                                                                                                                                    FY 2017
                                                                                                                                                       EUR 12.9m              EUR1,348.3m
                                                                                                                                                                              EUR 1.9m

                                           1.   According to IQVIA definition of emerging markets for FY 2018. For further details see note 8 of consolidated financial statements within FY 2018
                                                annual report
                   Investor Presentation                                                                                                                                                                5
                                           2.   Incl. Sensile Medical since July 2018, and respimetrix since February 2019
Agenda

  1         Gerresheimer at a glance                            P. 4

  2         Excellent fundament for profitable growth           P. 7

  3         Q1 2019: A good start into the year                 P. 16

  4         Operational and financial framework for 2019-2022   P. 18

  5         Appendix                                            P. 21

      Investor Presentation                                             6
A solid base in place to launch the next phase of our journey
EXECUTION
U N D E R W AY
IDENTIFIED
POTENTIAL
Decisive steps to
STRONG accelerate mid-term
F O U N D AT I O N S earnings growth have
Advanced Technologies
5 been made in FY 2018,
4 is clearly upgrading our
leading to significant
investments in FY 2019
business model
and FY 2020
Attractive growth
Solid platform to
2 capitalize on market
3 opportunities in
existing core business
trends
Great human capital
1 New management
Investor Presentation 71 Great human capital. Management board complete and
stabilized
Great human capital New management board
CO MPLET E AND ST ABILIZED
Pride and commitment in
manufacturing products that contribute
to health and well being
Strong engineering and production
DNA
Process and quality driven
Proven track record in driving business
expansion organically and un-organically
Solid middle management with broad
industry experience Production and engineering background
applied to various industries
Investor Presentation 82 Strong foundations to capitalize on market trends
Expectations from customers,
Megatrends consumers, patients
Rise in chronic diseases Stricter regulatory Personalization
and aging population requirements
Compliance and Documentation
New drugs especially
Rapid growth in
in Biosimilars and
generics Cost efficiency
Biotech
Growing healthcare Growing trend toward Pain reduction
provision to self medication
in Emerging Markets Quality
Gx offers a great platform for future growth in both Pharma & Healthcare as well as Cosmetics
Leading global player in Solid and balanced blue chip
Well invested global
Healthcare & Cosmetics customer base with long-term Enhanced product portfolio
manufacturing footprint
Packaging relationships
Investor Presentation 92 Gerresheimer is operating in large and attractive markets
Drug
Cosmetics Pharma Pharma
Syringes Delivery
Glass Glass1 Plastic
Devices
Estimated Market
Size 2017² ~ 1.8 ~ 2.2 ~ 5.8 ~ 0.9 ~ 4.0
(in € bn)
Market CAGR '17-’22²
LOW SINGLE DIGIT MID SINGLE DIGIT
(in %)
The strategic relevant core market for Gerresheimer is today ~ € 15bn
1. Tubular Glass + Moulded Glass Pharma
2. Strategic relevant markets, Gerresheimer estimates
Investor Presentation 103 Clear definition of target markets in Pharma & Healthcare …
PHARMA Product & Delivery
Primary Marketing &
VALUE Research Process Production Systems & Logistics Services
CHAIN
Packaging Sales
Development Assembly
HARDWARE
Gx accessible market
Gx strategic relevant market
Filling machines Tools,
Assembly lines for devices
CONSUMABLES
Suppliers
Blisters Primary packaging Inhalation, Infusion, trans-
glass & plastic, injection dermal, implants,
syringes, eye treatment,
closures ear-nose-throat
SERVICES
Formulation Product Filling Device (Pre-) Logistics
analytics design assembly
(e.g. sterility) & dev.
MUST
HAVES 1 Superior product and
Technologies 2 Cost leadership 3 Min. #3 for market shares
Investor Presentation 113 … as well as in Cosmetics
COSMETIC Product & Primary Delivery
Marketing &
VALUE Research Process Production Packaging & Systems & Logistics Services
CHAIN
Sales
Development Decoration Assembly
HARDWARE
Filling machines
CONSUMABLES
Suppliers
Plastic Moulded Glass Packaging Components
Gx strategic
relevant market
Bottles Samples & Decoration (Pumps & Caps)
Gx accessible market
SERVICES
Formulation Product Filling Innovative bottle Component
analytics design & pre-assembly &
development sealing
MUST
HAVES 1 Superior product and
Technologies 2 Cost leadership 3 Min. #3 for market shares
Investor Presentation 124 Expanding with Advanced Technologies to a full solution
provider to the Pharma Industry
A D VA N C E D T E C H N O L O G I E S
Flow measurement
Data gathering
Data management
Electronics + ... /…
Sensile Medical
+ Connectivity
respimetrix
Biosimilar/
Biotech Companies + OEM / ODM2
Other therapeutic business
areas
Precision injections
PLASTICS & DEVICES
Large Pharma & Gerresheimer
Generics Medical Plastic Systems
Chronic Diseases
CMO / CDMO1
Business
Today + ~ 5 Years ~ 10 Years
1. CMO / CDMO: Contract Manufacturer Organization, Contract Development Manufacturer Organization.
2. OEM / ODM: Original Equipment Manufacturer / Original Design Manufacturer
Investor Presentation 135 Decisive steps to accelerate mid-term earnings growth have
been made in FY 2018 and drive investments for 2019 and 2020
Growth | M A I N P R O J E C T S Productivity | M A I N P R O J E C T S
P&D 2019 2020 STATUS P&D 2019 2020 STATUS
Extension Horsovsky Tyn (Devices) X X On plan Optimized Packaging Syringes X — On plan
New Plant North Macedonia (Devices & Automatic driving systems Pfreimd X X On plan
X X On plan
Syringes)
New Plant Brazil Anapolis (GPP) X X On plan
Extension TCC Wackersdorf (Syringes PPG 2019 2020 STATUS
X — On plan
Small Batch production)
Automation Packing / Packaging (Moulded) X X On plan
Buende Safety Systems Innosafe (Syringes) X X On plan
Automation Printing (Moulded) X X On plan
Buende new forming line (Syringes) X X On plan
Automation Spraying (Moulded) — X 2020
Buende RTF 5 & 6 (Syringes) X X On plan
Automation Ampules (Converting) X — On plan
Automation clean rooms (Queretaro) X X On plan
PPG 2019 2020 STATUS
System digitalisation (MES PPG) X X On plan
Furnace Repair Essen including Extension X — On plan
Furnace Repair Lohr including Extension — X 2020
Decoration Tettau Cosmetics X — On plan
Queretaro ETF line #2 — X 2020
Converting machine strategy (Poland:
X X On plan
cartridges, India: vials)
Investor Presentation 14Agenda
1 Gerresheimer at a glance P. 4
2 Excellent fundament for profitable growth P. 7
3 Q1 2019: A good start into the year P. 16
4 Operational and financial framework for 2019-2022 P. 18
5 Appendix P. 21
Investor Presentation 15A good start into the year
Strict monitoring of all business and macro drivers
Q1 2019 Financials Markets & Macro Operations
Revenues and profitability Currency movements result in slight Strong performance of PPG across all
developments in line with expectations translation tailwinds businesses
Reported revenues up 6.3% Over 65% of 2019 energy volume fixed Encouraging revenue growth in
for the current year Syringes as well as in Plastic
Adjusted EBITDA at EUR 145.9m
Packaging
(EUR 53.6m + EUR 92.3m)
US prescription business and Inhalation
Adjusted EBITDA Leverage at 2.4x
lower year-on-year (strong flu season in
Confirming 2019 guidance and outlook Q1 2018 and inhalation contract loss
for 2020-2022 set higher comparison base in 2018)
Performance of Advanced
Technologies in line with expectations
Systematic execution of capex plan
Investor Presentation 16Agenda
1 Gerresheimer at a glance P. 4
2 Excellent fundament for profitable growth P. 7
3 FY 2018 operational and financial highlights P. 16
4 Operational and financial framework for 2019-2022 P. 18
5 Appendix P. 21
Investor Presentation 17FY 2019 guidance updated, FY 2020-2022 indications unchanged.
Focus on execution
At Group level & FXN1
METRICS EXPECTED FY 2019 (FXN1)
Revenues ~ EUR 1.40bn to EUR 1.45bn
~ EUR 295m (plus/minus EUR 5m) + EUR 92.3m leads to following upgrade:
Adj. EBITDA incl. derecognition of liabilities (Q1 19)
~ EUR 387m (plus/minus EUR 5m)
Capex (% FXN sales) ~ 12%
FY 2020 - 2022
EXPECTED TOP LINE EXPECTED ADJUSTED EXPECTED CAPEX
GROWTH EBITDA MARGIN REQUIREMENTS
DEVELOPMENT
4% to 7% FXN1 revenue growth Temporary increase of capex
per annum for the financial years ~ 21% in FY 2020 to revenues in 2019 and 2020
2020 – 2022 based on ~ 23% for the financial years up to 12%
Market volume growth 2021 – 2022 Thereafter back to 8% of
Gx market outperformance revenues
Growth projects
Sensile Medical
1. See page 105 of annual report FY 2018 for currency assumptions regarding FY 2019
Investor Presentation 18Thank you!
Agenda

  1         Gerresheimer at a glance                            P. 4

  2         Excellent fundament for profitable growth           P. 9

  3         FY 2018 operational and financial highlights        P. 18

  4         Operational and financial framework for 2019-2022   P. 20

  5         Appendix                                            P. 23

      Investor Presentation                                             20
Leading market positions in attractive niche markets
PRIMARY
DIVISION PLASTICS & DEVICES
PACKAGING GLASS
Ampoules,
Plastic Inhalation Diabetes Syringe MG Pharma
PRODUCT Packaging1 (DPI)2 Diagnostics3 Pens
Systems (Type I)
Vials,
Cartridges
EUROPE #1 #1 #2 #2 #2 #2 #3
NORTH
AMERICA
#1 #1 #2 #1 #1
EMERGING #1 #1 #2 #1
(South America (South
MARKETS and India) America)
(India) (China)
1. North America: plastic vials for oral prescription drugs
Investor Presentation 2. DPI = Dry Powder Inhaler (World market) 21
3. Lancets and lancing devicesWe provide solutions across all key product categories
DIVISION PLASTICS & DEVICES PRIMARY PACKAGING GLASS GAT
OTC
Liquids and
Plastic Inhalation Diabetes Syringe MG Pharma TG
PRODUCT Packaging (DPI)2 Diagnostics3 Pens
Systems (Type I)
Syrups
Injectables
Sensile Medical
(Type II &
III)
Gerresheimer
Schott
Becton
Dickinson1
Nipro1
Ompi
Jabil Circuit
(Nypro)1
Consort Medical1
West Pharma1
Nemera
Berry Plastics1
Facet
Ypsomed1
Desjonquères
Rocco Bormioli
Insulet
Investor Presentation 1. Public company // 2. DPI = Dry Powder Inhaler (World market) // 3. Lancets and lancing devices 22
Source: Company estimatesMarket context as defined by IQVIA
Historic development of Pharma market volumes1 Expected development of Pharma market volumes1
(in %) CAGR ’19-‘23 (in %)
Global
Developed Markets
Phamerging Markets 4.9%
ROW
’18
’14-’18 3.7%
global
volume
volume 2.9%
CAGRs
growth 2.2%
1.8% 1.7%
Medicine 0.1%
1.7% 0.3%
standard units
-0.3%
Medicine standard unit Generic standard unit
Generic
3.0% 1.8%
standard units2
Overall market trends point towards 2% to 3% CAGR
volume growth, underpinned by megatrends, with regional
variations
Within categories, Pharmerging markets particularly well-
placed to benefit from growth
1. IQVIA (former Quintiles IMS) January 2019
2. Generic units are included in Medicine units
Investor Presentation 23Current customer overview 1
L‘Oreal Beiersdorf
Teva Mylan
Astra Bayer
ABOUT 7% generated
with our Top 1 customer
P&G
Sanofi
Coty 35% of revenues generated with
our Top 10 Pharma & Generics Merck
customers in 2018
Roche
GsK
48% of revenues generated with
J&J our Top 20 Pharma & Generics Avon
customers in 2018
Pfizer Novartis
Novo
Nordisk Fresenius
Boehringer Ingelheim
1. Customers names have been inputted randomly and clock-wise presentation does not correspond to revenues ranking
Investor Presentation 24Development of net working capital
FEB 28, 2019 Nov 30, 2018 FEB 28, 2018
EUR M EUR M EUR M
Inventories 190.0 171.5 168.0
thereof prepayments made 5.5 4.7 2.7
Trade receivables 227.2 273.5 221.3
Trade payables 163.82 207.42 130.6
Payments received on account of orders - 34.9 34.7
Net working capital 253.4 202.7 224.0
Average NWC in % of LTM revenues1 17.8% 17.3% 16.7%
1. In percentage of FXN revenues.
2. Including EUR 0.4m of non-current trade payables as of February 28, 2019 (EUR 0.1m as of November 30, 2018).
Investor Presentation 25Q1 2019 FXN Revenues growth up 6.3%
EUR m FXN1 growth YoY: +6.3%
FXN1 Excluding inhalation impact
6.8 6.6 307.4
1.8 5.6
300 290.4 292.2
289.1 (0.7)
275 (3.1)
250
225
200
Q1 2018 Currency Q1 2018 @ Impact 2018 Q1 2018 FXN Δ P&D Δ PPG Δ GAT Δ Internal Sales Q1 2019
reported impact 2019 budget lost inhalation Guidance Base FXN
rate (FXN) contract (P&D)
FXN P&D Q1 2019 performance review
FXN PPG Q1 2019 performance review FXN GAT Q1 2019 performance review
+ 3.6% (excl. 2018 impact loss inhalation)
+ 5.0% EUR 6.6m
+1.6% (including impact)
— Good take up in Syringes — US injectable business with strong growth YoY — Revenues for Sensile Medical in line with
— Satisfying quarter for Plastic Packaging expectations
— Strong growth in Cosmetics
— Almost exclusively development revenues
— US prescription business temporarily down due to — European pharma glass up YoY
tough comparables in Q1 2018 (flu season)
— Good quarter in Emerging Markets
— Contract Manufacturing impacted by loss of
inhalation contract in 2018
— Tooling higher YoY
1. See page 105 of annual report FY 2018 for currency assumptions regarding FY 2019.
Investor Presentation 26Q1 FXN Adj. EBITDA at EUR 145.5m including EUR 92.3m of
derecognition of liabilities
EUR m
FXN1
90.8 145.5
Including
OOI
Derecogntion
52.6 0.8 53.4 52.3 4.6 1.0 of liabilities
-
(1.1) (3.2)
Q1 2018 Currency Q1 2018 Impact 2018 Impact 2018 Q1 2018 FXN Δ P&D Δ PPG Δ GAT Δ HQ Q1 2019 FXN
adjusted impact adjusted Loss Inhalation Network base for 2019
EBITDA EBITDA @ contract (P&D) Charges (PPG) guidance
reported 2019 budget & Triveni put
rate (FXN) option (P&D)
P&D Q1 2019 performance review
PPG Q1 2019 performance review GAT Q1 2019 performance review
EUR -3.2m YoY (excl. 2018 impact loss
EUR 4.6m YoY EUR 1.0m
inhalation) or EUR -4.3m including impact
— Lower revenues contribution from US prescription — Higher contribution across all PPG business units as — Adj. EBITDA development in line with expectations
business impacts Q1 2019 profitability YoY (timing) a result of higher revenue growth, operating leverage given the nature of revenues
— Contract Manufacturing impacted by loss of and capacity utilization
inhalation contract in 2018
— Other business units delivering in line with
expectations
1. See page 105 of annual report FY 2018 for currency assumptions regarding FY 2019.
Investor Presentation 27Reported revenues up 6.3% in Q1 2019, adjusted EBITDA at EUR
145.9m. Small currency tailwinds
Group Q1 2019 review
EUR M Q1 2019 Q1 2018 Change in %
Revenues 308.5 290.4 +6.3%
- of which FX effect 1.1 -1.8
Adj. EBITDA 145.9 52.6 +177.2%
- of which FX effect 0.4 -0.8
- Adj. EBITDA margin % 47.3% 18.1% N.A.
P&D Q1 2019 review PPG Q1 2019 review GAT Q1 2019 review
Q1 Q1 Change Q1 Q1 Change Q1 Q1 Change
EUR M EUR M EUR M
2019 2018 in % 2019 2018 in % 2019 2018 in %
Revenues 160.7 157.3 2.2% Revenues 141.9 133.1 +6.6% Revenues 6.6 - N.A.
Adj. EBITDA 34.2 37.6 -9.2% Adj. EBITDA 25.2 20.31 +23.9% Adj. EBITDA 1.0 - N.A.
- Adj. EBITDA - Adj. EBITDA - Adj. EBITDA
21.3 23.9 -260bps 17.8 15.3 +250bps 15.5 - N.A.
margin % margin % margin %
Investor Presentation 28Adjusted net income after non-controlling interests EUR 51.1m
higher than 2018
EUR m 2.4
93.3(1) 4.5 thereof
Impact US tax
reform Q1
0.0 (6.1) 2018 (43.6m) 99.3 109.2
thereof
FX-effects
-0.4m (44.0) 10.3 (0.4)
49.2 58.1
Net income Delta Adj. Delta Delta Total Delta Delta Net Delta Income Net income Total one-off Adjusted NI Adjusted NI Adjusted NI
Q1 2018 EBITDA Depreciation one-off items Amortization finance taxes Q1 2019 items (incl. attributable to after non- after non-
FVA expense Amortization non-controlling controlling controlling
FVA) interests interests in interests in
Q1 2019 Q1 2018
Change in Adjusted net income after
Change in net income Q1 2019 YoY
non-controlling interests Q1 2019 YoY
EUR +50.1m
EUR +51.1m
— Higher Adj. EBITDA due to derecognition of contingent purchase — Adjusted net income after non-controlling interests is EUR 51.1m
price liabilities Sensile Medical EUR 92.3m higher as in Q1 2018
— Limited one-off items in Q1 2019. Q1 2018 one-off items mostly — Adjusted EPS after non-controlling interests at EUR 3.48 in Q1
relating to severances costs for board members 2019 versus EUR 1.85 in Q1 2018
— Increase in amortization of fair value adjustments as a result of
acquisition of Sensile Medical
— Lower interest expenses due to redemption of bond in May 2018
— Higher income taxes variation, mainly due to US tax reform in 2018
(EUR 43.6m positive one off in Q1 2018)
1. Incl. EUR 92.3m from derecognition of liabilities.
Investor Presentation 29Net Financial Debt increase led by a further payment related to
Sensile Medical acquisition and temporarily higher NWC
EUR m
Operating CF FCF Acquisition
Adj. EBITDA Other cash out
excluding effect Net (incl. Interest, Purchase
Net Financial Debt from derecogn. Derecogn. Working Capital Taxes, Pension, Derecogn. price pay. FX- Net financial Debt
Nov 2018 Liabilities Liabilities Capital Expenditure etc.) Liabilities SM effetcs Q1 2019
Non cash
92 (49) (17) (17)
(886) 54 (92) (25) 1 (939)
EUR +80m EUR -29m
Operating and Free Cash Flow Acquisitions
— Derecognition of liabilities in relation with the Sensile Medical — EUR 25m paid in December in conjunction with the Sensile
acquisition is a non-cash item Medical acquisition
— Higher net working capital consumption in Q1 2019 mainly
driven by increase in inventory
— Other mainly includes cash outflow related to Pensions,
Taxes and Interest payments
Investor Presentation 30Adjusted EBITDA Leverage temporarily at 2.4x. Capital structure
remains solid
NET FINANCIAL DEBT AND ADJ. EBITDA LEVERAGE
Net Financial Debt 886.4 939.1
Adj. EBITDA leverage (x)
EXPIRY DATE MAIN FACILITIES
3.1x
2.4x 500 450.0 RCF
450 Promissory loans
400
350 305.5
Nov 30, 2018 Feb 28, 2019 300
250 189.5
200
150 109.0
Net Financial Debt Summary 100 45.5
50 25.5
IN EUR M Nov 30, 2018 Feb 28, 2019 0
FY FY FY FY FY FY FY FY FY
Drawn portion of RCF 264.4 318.5 2019 2020 2021 2022 2023 2024 2025 2026 2027
Promissory loans (2017) 250.0 250.0
Promissory loans (2015) 425.0 425.0
Local borrowings and leasing 27.6 30.5
Cash and cash equivalents (80.6) (84.9)
Net Financial Debt 886.4 939.1
Investor Presentation 31GXI Key Data
in EUR per share 2008 2009 2010 2011 2012 2013 2014 2015 2016 2017 2018
Dividend 0.40 – 0.50 0.60 0.65 0.70 0.75 0.85 1.05 1.10 1.15
Dividend yield 1.5% – 1.8% 1.9% 1.7% 1.4% 1.7% 1.2% 1.5% 1.6% 1.8%
Payout ratio 22% – 26% 25% 25%1 23% 26% 25% 25% 27% 20%
Share price high 38.20 27.05 29.85 36.62 41.34 50.14 56.42 76.32 76.86 78.01 79.80
Share price low 23.99 13.24 22.09 28.30 31.00 37.60 42.31 41.99 57.10 61.03 59.75
Share price at FY end 27.10 23.05 28.20 31.17 39.41 49.67 44.44 73.90 68.85 67.06 62.90
Book value per share 15.26 15.29 16.86 17.59 17.14 17.94 19.25 22.23 24.31 25.14 28.35
P/E ratio2 14.81 17.20 14.46 12.77 15.041 16.13 15.38 21.67 16.31 16.51 11.09
Market cap in EUR m 851 724 886 979 1,238 1,560 1,395 2,320 2,162 2,106 1,975
MDAX weighting year
11.48%3 1.33% 1.24% 1.40% 1.47% 1.33% 1.01% 1.42% 1.33% 1.00% 0.87%
end
Number of shares in
31.4 31.4 31.4 31.4 31.4 31.4 31.4 31.4 31.4 31.4 31.4
million
1. Retrospective restatement due to the early adoption of IAS 19 (amended in 2011) from December 1, 2012.
2. Based on adj. EPS after non-controlling interests.
3. SDAX weighting at year end.
Investor Presentation 32Overview of Abbreviations and Definitions
ABBREVIATIONS AND DEFINITIONS
Adj. EBITDA Earnings before income taxes, net finance expense, amortization of fair value adjustments, depreciation and amortization, impairment losses, restructuring
expenses and one-off income and expenses
Adjusted EPS Adjusted net income divided by 31.4m shares
Adjusted net income Consolidated net income before non-cash amortization of fair value adjustments, restructuring expenses, impairment losses, one-off income and expenses
(including non-cash expenses) and the related tax effects.
CAGR Compound Annual Growth Rate
Capex Investments in tangible and intangible assets
EBIT Earnings before interest and taxes
EBITA Earnings before interests, taxes and amortization
EBITDA Earnings before interests, taxes and depreciation and amortization
FXN "Foreign currency neutral" - based on budgeted FX-rates
Gx ROCE Adjusted EBITA divided by capital employed (total assets minus investments, investments accounted for using the equity method and other loans, minus
cash and cash equivalents, minus pensions (without pension provisions), deferred tax liabilities, and income tax liabilities, minus prepayments received,
trade payables, and other non- interest bearing liabilities)
Gx RONOA The ratio of adjusted EBITA to average net operating assets, comprising the sum of property, plant and equipment and net working capital
Leverage The relation of net financial debt to adjusted EBITDA of the preceding twelve months, according to the current credit facility agreement.
Net debt Short and long term debt minus cash and cash equivalents
Net finance expense Interest income and expenses and related to the net financial debt of the Gerresheimer Group. It also includes net interest expenses for pension provisions
together with exchange rate effects from financing activities and from related derivative hedges.
Net working capial
(NWC) Inventories plus trade receivables minus trade payables plus/minus prepayments
Op. CF margin Adjusted EBITDA plus/minus the change in net working capital, minus capex and in relation to revenues
Operating cash Flow Adjusted EBITDA plus/minus change in net working capital, minus capex
P/E Ratio Company's share price divided by the adj. EPS after non-controlling interests
RCF Revolving credit facility
yoy year-on-year
Investor Presentation 33Financial calendar and contact details
FINANCIAL CALENDAR
June 6, 2019 AGM
July 11, 2019 Interim Report 2nd Quarter 2019
October 10, 2019 Interim Report 3rd Quarter 2019
CONTACT DETAILS
Name Corporate Investor Relations
Phone +49 211 6181 257
Fax +49 211 6181 121
E-mail Gerresheimer.ir@gerresheimer.com
IR website www.gerresheimer.com/ir
Investor Presentation 34Our Vision Gerresheimer will become the leading global partner for enabling solutions that improve health and well-being. Our success is driven by the passion of our people.
You can also read


