INVESTOR PRESENTATION - June 2019 2019 SPARTAN MOTORS, INC.
←
→
Page content transcription
If your browser does not render page correctly, please read the page content below

INVESTOR
PRESENTATION

June 2019

© 2019 SPARTAN MOTORS, INC.
FORWARD LOOKING STATEMENTS
This presentation contains several forward-looking statements that are not historical facts, including statements concerning our
business, strategic position, financial projections, financial strength, future plans, objectives, and the performance of our
products and operations. These statements can be identified by words such as "believe," "expect," "intend," "potential," "future,"
"may," "will," "should," and similar expressions regarding future expectations. These forward-looking statements involve various
known and unknown risks, uncertainties, and assumptions that are difficult to predict with regard to timing, extent, and likelihood.
Therefore, actual performance and results may materially differ from what may be expressed or forecasted in such forward-
looking statements. Factors that could contribute to these differences include operational and other complications that may arise
affecting the implementation of our plans and business objectives; continued pressures caused by economic conditions and the
pace and extent of the economic recovery; challenges that may arise in connection with the integration of new businesses or
assets we acquire or the disposition of assets; restructuring of our operations, and/or our expansion into new geographic
markets; issues unique to government contracting, such as competitive bidding processes, qualification requirements, and
delays or changes in funding; disruptions within our dealer network; changes in our relationships with major customers,
suppliers, or other business partners, including Isuzu; changes in the demand or supply of products within our markets or raw
materials needed to manufacture those products; and changes in laws and regulations affecting our business. Other factors that
could affect outcomes are set forth in our Annual Report on Form 10-K and other filings we make with the Securities and
Exchange Commission (SEC), which are available at www.sec.gov or our website. All forward-looking statements in this
presentation are qualified by this paragraph. Investors should not place undue reliance on forward-looking statements as a
prediction of actual results. We undertake no obligation to publicly update or revise any forward-looking statements in this
presentation, whether as a result of new information, future events, or otherwise.

                                                      © 2019 SPARTAN MOTORS, INC.                                              2
SPARTAN AT A GLANCE
SEGMENT OVERVIEW                                  North American leader in specialty vehicle
    2018 Sales                                      manufacturing and assembly for the
                                            $816M        commercial vehicle market
                                             2018 SALES

                      $246M

$388M
                                             $15M                                       ‘18
                                          2018 NET INCOME
                  $193M
                                              $32M                                ‘18
                                          2018 ADJ. EBITDA
                                                                                  ‘18

 Emergency Response (ER)

 Specialty Chassis & Vehicles (SCV)

 Fleet Vehicles & Services (FVS)      13 MFG OPERATIONS
                                           IN 8 STATES & 2
                                             COUNTRIES
                                          © 2019 SPARTAN MOTORS, INC.                         3
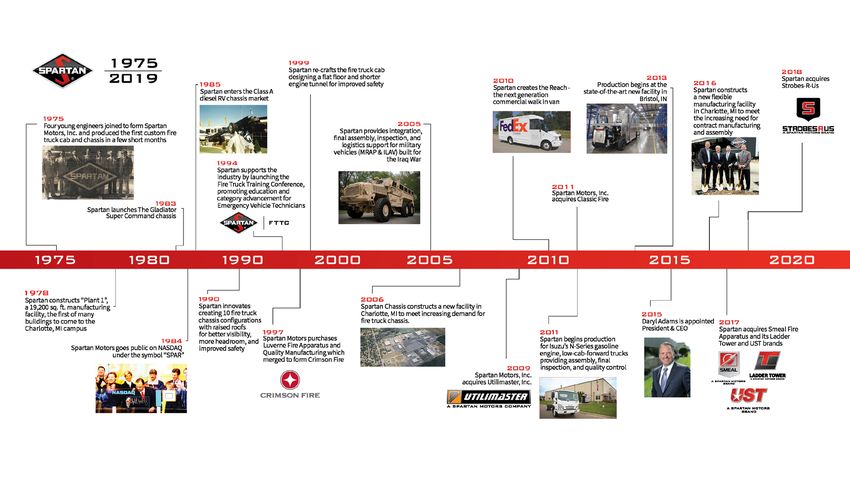
COMPANY TIMELINE

            © 2019 SPARTAN MOTORS, INC.   4
LEADERSHIP TEAM
QUICK STATS & DRIVERS
145 years of combined executive leadership
“One-team” mentality
Daryl Adams
Culture of accountability and ownership President & CEO
Mantra of “no surprises”
Solution and proactive based mindset Interviewing
Candidates
SHARED SKILL SETS
Tom Schultz Rick Sohm
COO
Big-company DNA with growth experience
CAO CFO
Blended automotive and non-automotive experience
Lean manufacturing expertise
Successful M&A activity
Chad Heminover Todd Fierro Steve Guillaume
Progressive experience President, Fleet
Vehicles & Services
President, Emergency
Response
President, Specialty
Chassis & Vehicles
© 2019 SPARTAN MOTORS, INC. 5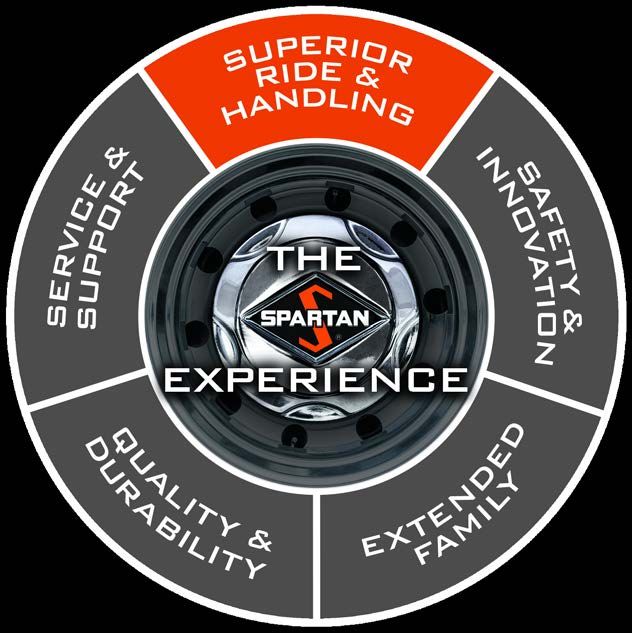
SPARTAN MOTORS - BUSINESS SNAPSHOT
Sales & Adj. EBITDA TAM: $5.6B
(millions) $816.2
$707.1
$590.8
$506.8 $550.4
$31.3 $31.8
CAGR 11.8% FVS ER SCV
$22.9 CAGR 31.1% $3.8B $1.2B $620M
$10.1 $12.2
eCommerce to 66% of all fire 18% CAGR Class A
grow 9x the rate of trucks are ten Diesel >400 HP
2014 2015 2016 2017 2018 2019* other retail sales years or older shipments (‘12-’18)
Sales Adj EBITDA *Based on 2019 Guidance through 2022
1Q19 Sales and Adj. EBITDA Financial Objective – Adj. EBITDA %
(millions) Adj EBITDA
Quality & M&A
Volume, Warranty
$234.0 Material Productivity
Mix, &
Product Cost ~10%
Expansion
$173.0
$5.6 3.9%
$4.6
1Q18 1Q19 2018
© 2019 SPARTAN MOTORS, INC. 6
MANUFACTURING IMPROVEMENTS –
GAINING TRACTION
                 Product Recalls                                                                                          Backlog
                  21                                                            $400 M                                                       $359.2     $359.2
                                                                                                                                    $384.2
                         16
          15                                                                    $300 M                           $270.8
                                           12                                                          $243.7             $249.5
                                 11                                                                                                                                      ER
Recalls

                                                                                $200 M
                                                                                                                                                                         FVS
                                                                                                                                                                         SCV
                                                         2                      $100 M

                                                                                                  $M
          2014    2015   2016   2017      2018        2019*
                                                                                                       2014      2015      2016      2017*   2018*      1Q19*
                                 *Thru 1Q19 -   Includes 1 OEM pass-thru                                                                            *Excluding USPS Order

           Sales Productivity                                                                           Adjusted EBITDA Margin

                                                                             Adj. EBITDA Margin
                                                                                                                                             4.4%
                                                                                                                                   3.9%                  3.9%

                                                                                                          2.0%          2.2%

                                                                                                          2014          2015       2016      2017        2018

                                                             © 2019 SPARTAN MOTORS, INC.                                                                             7
MARKET CONDITIONS
Industry Headwinds Operating Focus
Tariffs driven increases in materials and Continued emphasis on operational improvements
component costs
Optimization of manufacturing facilities
Chassis shortages • Additions
Increased component lead times – Ephrata, PA
– Ladson, SC
Higher freight costs
– Pompano Beach, FL (StrobesRUs)
Logistics delays • Consolidations
Labor shortages – Delevan, WI
Design for manufacturing
2019 Guidance • Engineering-driven new manufacturing innovations
MP% Increase – Lighter materials
($M except per share) Low Mid-point High Over 2018
– Lower cost manufacturing
Revenue $865.0 $885.0 $905.0 8%
Net income $19.5 $21.1 $22.6 41%
Investment in Aftermarket Parts
Adjusted EBITDA $37.1 $39.1 $41.1 23% • New VP
EPS $0.56 $0.60 $0.64 40% • Inventory management
Adjusted EPS $0.57 $0.61 $0.65 27% – New ERP implementation
© 2019 SPARTAN MOTORS, INC. 8
FLEET VEHICLES
& SERVICES

© 2019 SPARTAN MOTORS, INC.

FLEET VEHICLES & SERVICES (FVS)
A leader in the fleet vehicle market, including truck bodies, walk-in vans,
  highly-customized global fleets, and vocation-specific vehicle upfits

                                                              Cargo
       Walk-in                         Truck
                                                               Van
        Vans                           Bodies
                                                              Upfits

                              © 2019 SPARTAN MOTORS, INC.                 10
FVS – GO-TO-MARKET STRATEGY
National Accounts/ Large Leasing Companies OEM Dealerships
Business Fleets
© 2019 SPARTAN MOTORS, INC. 11FVS – BUSINESS SNAPSHOT
Sales & Adj. EBITDA TAM: $3.8B
(millions)
$387.5
$278.4
$251.1
$210.5 $227.7 $31.2 CAGR 15.8% US eCommerce
$27.0 $26.7
CAGR 27.7% expected to double
$17.6 from $517B in 2018
$11.0 to over $1T by 2027
2014 2015 2016 2017 2018 2019*
Note: Nominal GDP
Sales Adj EBITDA *Based on 2019 Guidance Sources: FedEx, UPS Rates & Forecasting, eMarketer, FTI Consulting Report, CBO GDP Report
1Q19 Sales and Adj. EBITDA Financial Objective – Adj. EBITDA %
(millions) Adj EBITDA
Quality & M&A
Volume, Warranty
$122.6 Material Productivity
Mix, &
Product Cost 15+%
Expansion
$59.7
6.9%
$7.0
$4.6
1Q18 1Q19 2018
© 2019 SPARTAN MOTORS, INC. 12FVS – MARKET SHARE
TAM: $2.6 Billion TAM: $1.2 Billion
WALK- IN VANS TRUCK BODIES CARGO VAN UPFITS
Walk-in Van Market Share Truck Body Market Share Van Up-fit Market Share
4% 2%
8%
39% 14%
50% 40%
7%
50% 64% 5%
17%
Spartan/Utilimaster Morgan Corp Spartan/Utilimaster MasterRack
Spartan/Utilimaster Morgan Olson
Wabash/Supreme Others
Adrian Steel Ranger Design
Weather Guard Regional Upfitters
Spartan’s Utilimaster is #3 in the Van/Truck Body Market
Source: 2017-2018 SpecialtyTransportation.net Reports
© 2019 SPARTAN MOTORS, INC. 13FVS – VAN/TRUCK BODY & CARGO VAN
UPFIT OUTLOOK
2021 / 2022 Total Addressable Market $3.8 Billion
Van/Truck Body Market Growth Cargo Van Upfit Market Growth
600
180 $2,633 $2,700 $1,150 $1,200
170 $2,477 $1,103
Units (thousands)
Units (thousands)
$1,038
Sales (millions)
$2,332
Sales (millions)
$2,400 500
160 $2,193 $968 $1,000
150 $2,039 $874
$2,100
$1,827 400 $786
140 $800
$1,800
130
120 $1,500 300 $600
2017 2018 2019 2020 2021 2022 2016 2017 2018 2019 2020 2021
Van/Truck Body Sales Van/Truck Body Units Cargo Van Upfit Sales Cargo Van Upfit Units
Well positioned for accelerating growth Well positioned for expanding Euro cargo van segment
• Flexible regional facilities in Ephrata, PA; Ladson, NC; & • Ship-Thru programs in Saltillo, MX (Dodge Promaster) Kansas
Pompano Beach, FL City (Ford Transit) & Ladson, SC (Mercedes Sprinter)
• FVS 2018 Backlog up 109%* to $112.3M from $53.7M a • Flexible regional upfit facilities – Pompano Beach, FL &
year ago Ephrata, PA
Product Segments – Growth Driven By:
Walk-in/style Dry Freight Euro van/style Upfit
Parcel Delivery Refrigeration Last mile delivery - Grocery/Refrigeration
* Excludes the USPS truck body order and impact of ASC 606 Source: 2017-2018 SpecialtyTransportation.net Reports
© 2019 SPARTAN MOTORS, INC. 14FLEET GROWTH OPPORTUNITIES
$3.8B Market Opportunity
Source Distribution Hub Doorstep
CLASS 1 CLASS 2 CLASS 3 CLASS 4 CLASS 5 CLASS 6 CLASS 7
GVWR GVWR GVWR GVWR GVWR GVWR GVWR
6,000 lbs. 10,000 lbs. 14,000 lbs. 16,000 lbs. 19,500 lbs. 26,000 lbs. 33,000 lbs.
© 2019 SPARTAN MOTORS, INC. 15FVS – BUILDING LONG-TERM
RELATIONSHIPS
PEOPLE Van Upfit Walk-in
Van
Truck
Body
Parts Field
Service
x x x x x
PROCESS
x x x x x
PRODUCT x x x x x
x x x x x
x x x x x
x x x x x
x x x
x x x
x x x
x x
© 2019 SPARTAN MOTORS, INC. 16FVS – COMPETITIVE ADVANTAGE
Utility Food & Beverage Parcel Linen & Laundry Retail Government
WIV | TB WIV | TB WIV | TB | Upfit WIV | TB WIV | TB | Upfit WIV | TB | Upfit
ConEd | SDG&E | LAPW Coca-Cola | Frito Lay UPS | FedEx | USPS | Purolator Cintas | Aramark Sysco | Starbucks | Walmart GSA | Military | State
Consumers Power | COM Ed Bimbo | Sara Lee Speedy | Canada Post | Canpar Virginia Linen | Ziker | CTS Amazon | GFS | Compass US Customs/Border Protection
Work-Driven Design = “The Utilimaster Difference”
PEOPLE
PROCESS
Needs Design & Build & Optimized
PRODUCT Listen & Learn
Assessment Innovate Implement Partnership
© 2019 SPARTAN MOTORS, INC. 17ACQUISITION UPDATE
Located in Pompano Beach, Florida
Expands manufacturing footprint into southeastern
US market
Major customers include;
• Departments of Transportation
• FBI, Department of Homeland Security
• Utility and gas companies
• US Coast Guard, Army Corps of Engineers
• US Fish & Wildlife
Expected to be accretive to 2019 earnings
© 2019 SPARTAN MOTORS, INC. 18STRATEGY AT WORK – FVS
Last Mile Delivery – momentum grows
• FVS Backlog at 1Q19 up 10%
sequentially, excluding USPS order
• Includes major eCommerce upfit order
Ephrata, PA facility now receiving truck body
orders in addition to fulfilling USPS order
Introduced temperature controlled grocery
delivery truck with climate controlled zones
EV continues to gain momentum – ability to
produce vehicles across GVWR Classes 1 – 6
Hired a seasoned VP of Operations to drive
operational improvements
Expanded East Coast manufacturing footprint
• 3 new facilities in place (PA, SC & FL)
adding increased capacity
© 2019 SPARTAN MOTORS, INC. 19EMERGENCY RESPONSE © 2019 SPARTAN MOTORS, INC.
EMERGENCY RESPONSE (ER)
         A top three fire truck and cab & chassis manufacturer
            with an emphasis on broad categorical coverage
  Customers We Serve             Cabs & Chassis           Complete Apparatus

                            © 2019 SPARTAN MOTORS, INC.                        21
ER – BUSINESS SNAPSHOT
Sales & Adj. EBITDA TAM: $1.2B
(millions) $302.9
$245.6
$190.0 $193.2 $183.0 4%
$3.2 CAGR 7.0%
$1.0 CAGR 59.7% 19%
-$2.7 Average 30% 66% of all fire trucks are
-$8.7 -$7.5 Fleet Age ten years or older
47%
2014 2015 2016 2017 2018 2019*
Source: FAMA shipped data and
Sales Adj EBITDA *Based on 2019 Guidance 1-4 yrs 5-9 yrs 10-15 yrs 16+ yrs Management’s estimates
1Q19 Sales and Adj. EBITDA Financial Objective – Adj. EBITDA %
(millions) Adj EBITDA
Quality & M&A
Volume, Warranty
Material Productivity
Mix, &
$66.7 Product Cost 6-8%
Expansion
$61.8
$1.2
0.4%
-$2.3
1Q18 1Q19 2018
© 2019 SPARTAN MOTORS, INC. 22ER – PRODUCT OFFERINGS
Pumpers Tankers Wildland Apparatus
Cabs & Chassis Rescues Aerials
© 2019 SPARTAN MOTORS, INC. 23ER – INNOVATION
Spartan Advanced Protection
Professional Engineering System®
Certification (Aerial Device Structure Certification)
Ladder Tower Company aerial products
Industry leading airbag
technology
Snorkel Articulating Boom Platform
Squrt Articulating Water Tower
Telesqurt Telescoping Boom-Ladder Intelligent seat belts
Renewed interest/demand
Spartan Independent Front
Suspension (IFS) Side impact protection
Outperforms category leader
Product performance
Value equation
Outboard sensors
© 2019 SPARTAN MOTORS, INC. 24STRATEGY AT WORK – ER
New ER management team in place
to drive future growth
Todd Fierro – President of ER
Realigned sales team and dealer
network
Multiple new orders include:
13-unit fire apparatus order for
large municipality in Texas
8-unit fire apparatus order for city
of Philadelphia, PA
11-unit fire apparatus order for
city of St. Louis, MO
7-unit fire apparatus order for city
of Lincoln, NE
ER backlog up 13% at 1Q19 vs 1Q18
© 2019 SPARTAN MOTORS, INC. 25SPECIALTY VEHICLES © 2019 SPARTAN MOTORS, INC.
SPECIALTY CHASSIS & VEHICLES (SCV)
The “Premier Foundation” (custom chassis) for the Class A diesel Luxury Motor Coach
 (LMC) market, with a core competency in custom manufacturing and assembly for the
               light duty truck, specialty vehicle, and defense markets.

LMC Customers We Serve    LMC Chassis               Contract Manufacturing          EV / AV

                                                      N-Gas
                                                 GVWR 14,000 lbs.

                                                                    F-Series
                                                                 GVWR 26,000 lbs.

                                   © 2019 SPARTAN MOTORS, INC.                                27
SCV – BUSINESS SNAPSHOT
Sales & Adj. EBITDA TAM: $620M
(millions) $193.2 ($420M > 400HP | $200M < 400HP)
$158.8
$132.5 $134.8
$112.4
$18.7 Class A Diesel >400hp
CAGR 12.0%
$14.1
CAGR 16.9% Spartan LMC market
26%
$8.9 $8.8
SPAR share has seen positive
$8.3
74%
Other growth of 44% since 2014
(4 companies)
2014 2015 2016 2017 2018 2019*
Sales Adj EBITDA *Based on 2019 Guidance Source: Statistical Surveys MarketScope, 1/2008 – 12/2018, U.S. Data and Management’s estimates
1Q19 Sales and Adj. EBITDA Financial Objective – Adj. EBITDA %
(millions) Adj EBITDA
Quality &
M&A
Volume, Warranty
Material Productivity
Mix, &
$51.7 Product Cost 10+%
Expansion
$48.2
$5.0 9.7%
$3.1
1Q18 1Q19 2018
© 2019 SPARTAN MOTORS, INC. 28RV CHASSIS – CLASS A DIESEL
LMC MARKET SHARE AND OUTLOOK
Spartan LMC market share has seen positive
growth of 44% since 2014 STRATEGY AT WORK – LUXURY MOTOR COACH
5,000 40%
4,500 35% SCV increasing LMC market share with Entegra,
4,000 Newmar, Foretravel, Jayco and NeXus manufacturers
30%
3,500
25%
• Up 2% to 26% share in 2018 despite Class A
3,000
Diesel industry being down 8%
2,500 20%
2,000 • Benefiting from new customer platform
15%
1,500 introductions that are gaining share
10%
1,000 • 400 HP SPAR Share momentum, including:
• Population and demographic trends
Total Addressable Market • “Active/outdoor lifestyle” continues to grow
$620 Million ($420M > 400HP | $200M < 400HP)
• RV manufacturers are broadening offerings
Spartan makes chassis for Class A Diesel > 400 HP - 26% share
Source: Statistical Surveys MarketScope, 1/2008 – 12/2018, U.S. Data and Management’s estimates
© 2019 SPARTAN MOTORS, INC. 29SCV – CATEGORY-LEADING INNOVATION
Digital Dash v2.0
Adaptive cruise control
Collision mitigation
Electronic stability control
Lane departure warning
Spartan Safe Haul™ Expansion
Bluetooth Interface w/
Connected Care App
© 2019 SPARTAN MOTORS, INC. 30SCV – FIRST-TO-MARKET INNOVATION
Custom tuned suspension
Automatic air leveling
Tire pressure monitoring system
Independent Front Suspension (IFS)
Passive steer tag axle
Rollover mitigation
© 2019 SPARTAN MOTORS, INC. 31STRATEGY AT WORK – SCV
Continues to gain share in Class A
Diesel luxury motor coach chassis
market
• 26% market share in diesel
>400hp segment
Continued growth of our smaller
format K1 360 chassis
• Jayco Embark (37’and 39’)
• Entegra Coach’s Reatta (37’
and 39’)
© 2019 SPARTAN MOTORS, INC. 32THE PATH FORWARD
Our Goal Well-positioned Financial Objectives Shareholder Alignment
To become #1 or #2 in each Focused management team $1 Billion in Sales Management’s long-term goals
market we serve Operational improvements ~10% Adj. EBITDA Margins closely aligned with
Improved product portfolio Improved Cash Flows shareholders
Customer-centric focus Increase ROIC
Financial strength Enhance shareholder returns
Leading purpose-built Strengthen and grow Accelerate the path Increase shareholder
vehicle manufacturer the core business forward value
© 2019 SPARTAN MOTORS, INC. 33FINANCIAL REVIEW © 2019 SPARTAN MOTORS, INC.
OVERVIEW – 1Q19 VS. 1Q18
Revenue ($ M) Net Income ($ M) (EPS)
$234.0
$4.2
$173.0
$1.4
$0.12 $0.04
1Q18 1Q19 1Q18 1Q19
Revenue for 1Q19 up $61.0M, or 35.2%, to $234.0M from Net Income for 1Q19 fell by $2.8M, or 66.7%, to $1.4M from $4.2M
$173.0M • Prior year includes $1.4M compensation tax benefit and a $1.5M
• FVS up $62.9M – USPS order and higher truck body, net working capital adjustment related to the Smeal acquisition
walk-in-van and upfit center volume
EPS decreased $0.08, or 66.7%, to $0.04 from $0.12 last year.
• ER down $4.9M – unfavorable sales mix
• Prior year EPS includes $0.04 compensation tax benefit and
• SCV up $3.5M – higher contract manufacturing $0.03 net working capital adjustment
volume and continued strength of luxury motor coach
sales
© 2019 SPARTAN MOTORS, INC. 35OVERVIEW – 1Q19 VS. 1Q18
Adjusted EBITDA ($ M) (Adj EBITDA as % of Sales) Adjusted Net Income ($ M) (Adj EPS)
$5.6
$4.6
$3.3
$1.5
3.2% 2.0% $0.09 $0.04
1Q18 1Q19 1Q18 1Q19
Adjusted EBITDA fell $1.0M, or 17.9%, to $4.6M from $5.6M Adjusted net income fell 54.5% to $1.5M from $3.3M
Adjusted EBITDA margin decreased 120 basis points to Adjusted EPS of $0.04 versus $0.09 a year ago
2.0% of sales compared to 3.2% of sales • Prior-year includes a $1.4 million, or $0.04 per share, tax
benefit related to the appreciation in value of stock
• Primarily driven by $2.3 million in higher input costs compensation
resulting from tariff driven increases in commodity
Backlog down 22.0% to $432.3M from $554.6M a year ago.
costs and components
• Excluding the unique USPS truck body order, backlog totaled
$359.2M, up 5.5% compared to $340.6M in 2018
See GAAP reconciliation in Appendix
© 2019 SPARTAN MOTORS, INC. 36FLEET VEHICLES & SERVICES – 1Q19
FVS Revenues ($ M)
$122.6 Revenue up $62.9M to $122.6M from $59.7M
• Increased volume relating to USPS truck body,
other truck body and upfits
$59.7 Adjusted EBITDA increased $2.4M to $7.0M from
$4.6M primarily from volume, partially offset by
1Q18 1Q19 unfavorable sales mix and tariff-driven increases in
commodity and component costs
FVS Adjusted EBITDA ($ M) (Adj EBITDA as % of Sales)
$7.0 Adjusted EBITDA margin decreased 200 basis points
to 5.7% of sales from 7.7%
$4.6
Excluding the USPS truck body order, sequential
backlog up 9.9%
7.7% 5.7% • Reported backlog decreased to $188.5M from
$335.3M a year ago
1Q18 1Q19
© 2019 SPARTAN MOTORS, INC. 37EMERGENCY RESPONSE – 1Q19
ER Revenues ($ M)
Revenue down 7.4% to $61.8M from $66.7M
$66.7 Reflects industry-wide decline in fire
$61.8
apparatus sales, product mix, dealer
realignment, partially offset by pricing
changes realized in 2018
1Q18 1Q19
Adjusted EBITDA fell $3.5M to a loss of $2.3M
compared to $1.2M last year
ER Adjusted EBITDA ($ M) (Adj EBITDA as % of Sales)
Driven primarily by product mix, tariff-driven
$1.2 increases in costs, warranty expense,
1.9% partially offset by pricing changes realized
-3.7% in 2018
Backlog up 13.2% to $214.7M compared to
-$2.3
$189.6M a year ago
1Q18 1Q19
© 2019 SPARTAN MOTORS, INC. 38SPECIALTY CHASSIS & VEHICLES – 1Q19
SCV Revenues ($ M)
Revenue up $3.5M, or 7.2%, to $51.7M from $48.2M
$51.7 last year
$48.2 • Increased volume from contract manufacturing
and luxury motor coach chassis
SCV adjusted EBITDA increased $1.9M to $5.0M from
$3.1M
1Q18 1Q19
Adjusted EBITDA margin improved 310 basis points
SCV Adjusted EBITDA ($ M) (Adj EBITDA as % of Sales) to 9.6% of sales from 6.5% of sales
$5.0
• Due to mix and increased volume
$3.1 Backlog down 2.0% to $29.1M compared to $29.7M a
year ago
6.5% 9.6%
1Q18 1Q19
© 2019 SPARTAN MOTORS, INC. 39BALANCE SHEET – 1Q19
Spartan Motors, Inc.
Summary Balance Sheet
(unaudited) Total liquidity of $97.0M at 1Q19 reflects:
Mar 31, Dec 31,
($000's) 2019 2018
• $21.4M cash on hand
Assets • $75.6M of borrowing capacity
Cash $ 21,368 $ 27,439
Accts Receivable 104,399 106,801
Adequate liquidity/capacity to fund:
Contract Assets 44,055 36,027
Inventory 84,457 69,992 • Working capital requirements
PP&E 56,175 56,567
Right of Use Assets-Operating Leases 12,930 - • Pursue strategic bolt-on acquisitions
Other Assets 58,675 56,958
Total Assets $ 382,059 $ 353,784 • Share buy-back
Liabilities & Shareholders' Equity - Purchased 191,000 shares, for $1.4M, or
Accts Payable $ 87,803 $ 76,399
Long-term Operating Lease Liability 10,517 - average share price of $7.55 since
Long-term Debt 26,042 25,547 December 21, 2018
Other Liabilities 71,046 65,854
Total Liabilities 195,408 167,702 Contract assets of $44.1M at 1Q19
Shareholders' Equity 186,651 186,082
Total Liabilities & Equity $ 382,059 $ 353,784 • Represents revenue with corresponding profit
Total Liquidity
recognized on products in process, but not yet
Cash $ 21,368 $ 27,439 invoiced to the customer as a result of adopting
Net Borrowing Capacity 75,602 86,410
the new revenue recognition standard
Total Liquidity $ 96,970 $ 113,849
© 2019 SPARTAN MOTORS, INC. 40APPENDIX © 2019 SPARTAN MOTORS, INC.
RECONCILIATION OF NON-GAAP
 FINANCIAL MEASURES
This presentation contains adjusted EBITDA (earnings before interest, taxes, depreciation and amortization), which is a non-GAAP financial
measure. This non-GAAP measure is calculated by excluding items that we believe to be infrequent or not indicative of our continuing operating
performance. For the periods covered by this presentation such items include expenses associated with restructuring actions taken to improve
the efficiency and profitability of certain of our manufacturing operations, expenses related to product recall campaigns, litigation settlements,
long-term strategic planning expenses, non-cash charges related to the impairment of assets, expenses related to a recent business acquisition,
the impact of the step-up in inventory value associated with the recent business acquisition, and the impact of the business acquisition on the
timing of chassis revenue recognition.

We present the non-GAAP measure adjusted EBITDA because we consider it to be an important supplemental measure of our performance. The
presentation of adjusted EBITDA enables investors to better understand our operations by removing items that we believe are not representative
of our continuing operations and may distort our long term operating trends. We believe this measure to be useful to improve the comparability
of our results from period to period and with our competitors, as well as to show ongoing results from operations distinct from items that are
infrequent or not indicative of our continuing operating performance. We believe that presenting this non-GAAP measure is useful to investors
because it permits investors to view performance using the same tools that management uses to budget, make operating and strategic decisions,
and evaluate our historical performance. We believe that the presentation of this non-GAAP measure, when considered together with the
corresponding GAAP financial measures and the reconciliations to that measure, provides investors with additional understanding of the factors
and trends affecting our business than could be obtained in the absence of this disclosure.

Our management uses adjusted EBITDA to evaluate the performance of and allocate resources to our segments. Adjusted EBITDA is also used,
along with other financial and non-financial measures, for purposes of determining annual and long-term incentive compensation for our
management team.

                                                           © 2019 SPARTAN MOTORS, INC.                                                        42
RECONCILIATION OF NON-GAAP
FINANCIAL MEASURES Financial Summary (Non-GAAP)
Consolidated
(In thousands, except per share data)
(Unaudited)
($000) Thre e Months Ende d March 31,
Spartan Motors, Inc. 2019 2018
Net income attributable to Spartan Motors, Inc. $1,397 $4,194
Add (subtract):
Restructuring charges 112 20
Joint venture expenses 27 -
Acquisition related expenses 45 162
Litigation costs 16 -
Nebraska flooding costs 123 -
Purchase accounting impact - (1,500)
Deferred tax asset adjustment (99) 74
Tax effect of adjustments (78) 315
Adjusted net income attributable to Spartan Motors, Inc. $1,543 $3,265
Net income attributable to Spartan Motors, Inc. $1,397 $4,194
Add (subtract):
Depreciation and amortization 2,525 2,452
Taxes on income 13 (48)
Interest expense 374 323
EBITDA $4,309 $6,921
Add (subtract):
Restructuring charges 112 20
Joint venture expenses 27 -
Acquisition related expenses 45 162
Litigation costs 16 -
Nebraska flooding costs 123 -
Purchase accounting impact - (1,500)
Adjusted EBITDA $4,632 $5,603
Diluted net earnings per share $0.04 $0.12
Add (subtract):
Restructuring charges 0.00 0.00
Joint venture expenses 0.00 -
Acquisition related expenses 0.00 0.00
Litigation costs 0.00 -
Nebraska flooding costs 0.00 -
Purchase accounting impact - (0.04)
Deferred tax asset adjustment (0.00) 0.00
Tax effect of adjustments (0.00) 0.01
Adjusted diluted net earnings per share $0.04 $0.09
© 2019 SPARTAN MOTORS, INC. 43RECONCILIATION OF NON-GAAP
FINANCIAL MEASURES Financial Summary (Non-GAAP)
Consolidated
(In thousands, except per share data)
(Unaudited)
($000) Twe lve Months Ende d De ce mbe r 31,
Spartan Motors , Inc. 2018 2017 2016 2015 2014
Net income attributable to Spartan Motors, Inc. $15,012 $15,935 $8,610 ($16,972) $1,029
Add (subtract):
Restructuring charges 1,881 1,252 1,095 2,855 2,157
Asset impairments - - 406 2,234 -
Joint venture expenses - 1 7 508 289
Impact of acquisition on timing of chassis revenue recognition - 2,073 - - -
Acquisition related expenses 1,952 1,543 882 - -
NHTSA settlement - - - 2,269 -
Recall expense (46) (368) 3,457 8,600 -
Long term strategic planning expenses 995 - - - -
Litigation settlement 447 - - - -
Purchase accounting impact-net working capital (2,193) - - - -
Deferred tax asset adjustment (313) (3,260) (2,932) 9,472 -
Tax effect of adjustments (729) (2,289) (460) (2,392) -
Adjusted net income attributable to Spartan Motors, Inc. $17,006 $14,887 $11,065 $6,574 $3,475
Net income attributable to Spartan Motors, Inc. $15,012 $15,935 $8,610 ($16,972) $1,029
Add (subtract):
Depreciation and amortization 10,370 9,937 7,903 7,437 8,378
Taxes on income 2,261 90 100 4,880 (2,103)
Interest expense 1,080 864 410 365 341
EBITDA $28,723 $26,826 $17,023 ($4,290) $7,645
Add (subtract):
Restructuring charges 1,881 1,252 1,095 2,855 2,157
Asset impairments - - 406 2,234 -
Joint venture expenses 0 1 7 508 289
Impact of acquisition on timing of chassis revenue recognition - 2,073 - - -
Acquisition related expenses 1,952 1,543 882 - -
NHTSA settlement - - - 2,269 -
Recall expense (46) (368) 3,457 8,600 -
Long term strategic planning expenses 995 - - - -
Litigation settlement 447 - - - -
Purchase accounting impact-net working capital (2,193) - - - -
Adjusted EBITDA $31,759 $31,327 $22,870 $22,267 $10,091
Diluted net earnings per share $0.43 $0.46 $0.25 ($0.50) $0.03
Add (subtract):
Restructuring charges 0.05 0.04 0.03 0.08 0.06
Asset impairments - - 0.01 0.07 -
Joint venture expenses - 0.00 0.00 0.02 0.01
Impact of acquisition on timing of chassis revenue recognition - 0.06 - - -
Acquisition related expenses 0.06 0.04 0.03 - -
NHTSA settlement - - - 0.07 -
Recall expense - (0.01) 0.10 0.25 -
Long term strategic planning expenses 0.03 - - - -
Litigation settlement 0.01 - - - -
Purchase accounting impact-net working capital (0.06) - - - -
Deferred tax asset valuation allowance (0.01) (0.09) (0.09) 0.28 -
Tax effect of adjustments (0.02) (0.07) (0.01) (0.07) -
Adjusted diluted net earnings per share $0.48 $0.43 $0.32 $0.20 $0.10
© 2019 SPARTAN MOTORS, INC. 44RECONCILIATION OF NON-GAAP
FINANCIAL MEASURES
Financial Summary (Non-GAAP)
Consolidated
(In thousands, except per share data)
(Unaudited)
Forecast
Year Ending December 31, 2019
Low Mid High
Net income $ 19,539 $ 21,085 $ 22,630
Add:
Depreciation and amortization 10,405 10,405 10,405
Interest expense 1,281 1,281 1,281
Taxes 5,649 6,096 6,542
EBITDA $ 36,874 $ 38,867 $ 40,858
Add (subtract):
Restructuring and other charges, net 200 200 200
Adjusted EBITDA $ 37,074 $ 39,067 $ 41,058
Earnings per share $ 0.56 $ 0.60 $ 0.64
Add:
Restructuring and other charges, net 0.01 0.01 0.01
Less tax effect of adjustments - - -
Adjusted earnings per share $ 0.57 $ 0.61 $ 0.65
© 2019 SPARTAN MOTORS, INC. 45© 2019 SPARTAN MOTORS, INC.
You can also read