Investor Briefing HY 2020/2021
←
→
Page content transcription
If your browser does not render page correctly, please read the page content below
Investor Briefing
HY 2020/2021

27th November 2020

Agenda

     Business Review    Dr. James Mworia – Group Chief Executive Officer

     Financial Review   Wambua Kimeu – Group Chief Finance Officer

     Outlook            Dr. James Mworia – Group Chief Executive Officer

     Q&A

2
About Centum
 Company Snapshot
                                                                                     Portfolio composition – 30 September 2020
           KES 13.5Bn              Market Capitalisation(1)

                                                                                                 Real Estate 64%
           KES 45.3Bn              Net Asset Value(2)
                                                                                              Private Equity 17%
                                                                                                Development 3%
                          11x NAV growth FY2009– FY2020
                                                                                       Marketable Securities 16%
                             3      Business Segments of Focus: Centum Real
                                    Estate, Private Equity & Marketable Securities                          KES 51.5Bn
                                                                                                               Total
                        30% Centum 4.0 target annualized cost-to-income ratio                                 Assets

                         0%         Long Term Gearing (2)

           A+(KE), A1(KE) National scale Long and Short-term ratings
                          affirmed on account of strong financial profile(3)

1. Share price as of 30 September 2020
2. As at 30 September 2020
3. Rating accorded by Global Credit Ratings (GCR) in Sep 2020

 3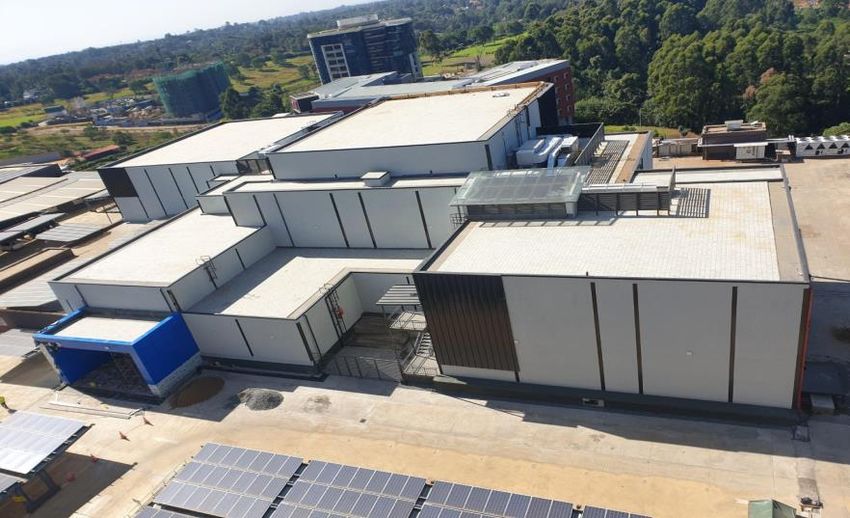
Centum 4.0 Strategy
Underlying Themes for HY 2020/2021
        Objective                                               Status
                                          Achieved the strategic objective of zero long-term debt at company level
      Balance sheet
                                  ▪   Maturing KES 6.6 billion bond redeemed on 8 June 2020.
      strengthening: Deleverage
      and build up liquidity
                                  ▪   Early repayment of USD 75 million RMB facility saved the group approximately Kes 300
                                      million in potential FX losses. Kes 892m reduction in finance cost.

                                  ▪   Marketable securities and cash holdings of Kes 8.3 Billion as at 30 Sep 2020.

                                  ▪   Completed reorganization of the real estate business unit into Centum Real Estate
                                      Limited (100% stake, HoldCo for fully owned RE assets) and Two Rivers Development
                                      (58% stake)

     Portfolio monetization       ▪   Centum Real Estate paid Kes 3.75 Billion of shareholder loans to Centum in the period
                                      April 2020 to Sep 2020, compared to nil repayment in a similar prior period. We
                                      expect further bulk land sales going forward.

                                  ▪   Active portfolio management to build resilience in PE portfolio companies.

      Returns to Centum           ▪   Kes 1.6 billion cash dividend paid in FY2020 and FY2021 representing Kes 1.2
                                      per share for each of the years.
      shareholders
                                  ▪   Capital preservation: focus was on capital preservation; -2.7% return achieved
                                      which compares favorably with market performance.

4
Centum 4.0 Strategy: HY 2020/2021
   Key Updates and Performance Drivers
                                                                                        Marketable
               Real Estate                       Private Equity                                                           Development
                                                                                        Securities & cash

       64%                   60%        17%                       18%         16%                      18%         3.2%                  3.6%

   of Total            of Net Asset   of Total              of Net Asset    of Total               of Net Asset   of Total          of Net Asset
    Assets                Value        Assets                  Value         Assets                   Value        Assets              Value

       Kes 3.75 billion                       KShs 8.1 billion                         Kes 8.3 billion               KShs 1.6 billion
Shareholder Loans Repaid                          Total Assets                 Total MSP Assets + Cash                    Total Assets

        Kes 4.2 billion                                                                Kes 1.74 billion            Geothermal Positive
  Profit potential of units                       5 out of 8                    Included as Cash & cash                 findings
    under construction                Portfolio companies remained                    equivalents                    Geoscientific studies
                                         profitable in HY2020/21
                                                                                           79%                     concluded on Akiira with
   KShs. 1.7 billion                                                                                                   positive finding.
Value of new sales in last                    Cash sufficiency             Allocated to Fixed Income and
       six months                       Despite covid-19 impact, all        Cash for capital preservation                     67%
                                       portfolio companies remained                                                 Increased production
   Kes 650 million                    self funded with no capital calls                    11.5%                  efficiency at Greenblade
Cash collection over the                         to Centum                    Annualized cash return                Growers significantly
    last six months                                                        generated on MSP to Sep 2020           improving Gross Margins.

   5
Centum 4.0 Strategy Progress
Company Total Return Statement
KShs. Millions                       HY2021 HY2020        %Δ    ▪   Company PBT increase from loss of KShs
                                                                    804m to profit of KShs 95m.
Investment income                       729     3,022    -76%
                                                                ▪   Prior Year exceptions included
Operating expenses                     (299)     (312)    -4%         ✓ Gain on disposal of bottlers KShs 2.2b
Finance costs                          (335)   (1,228)   -73%         ✓ Impairment provision of KShs 2.3b
                                                                      ✓ Income Tax on Gain of KShs 0.8b
Impairment of assets                       -   (2,286)   100%
Profit before tax                        95     (804)    112%   ▪   Investment income
                                                                      ✓ Lower dividends received as companies
Income tax expense                         -     (800)   100%             withheld cash
                                                                      ✓ Total Interest income from MSP of KShs
Profit after tax                         95    (1,604)   106%
                                                                          280m and KShs 323m from inter
Unrealised gains                     (1,392)       58 -2500%              company loans.

Return for the year                  (1,297)   (1,546)   16%    ▪   Revaluation losses of KShs 1.4b driven by
                                                                    lower business performance and decline in
                                                                    multiples due to Covid-19 impact.
Total comprehensive (loss)/ income   (1,297)   (1,546)   16%
                                                                ▪   Cost containment measures effected by
                                                                    company reducing operating expenses by 4%
Return on opening NAV                 -2.7%     -2.9%           ▪   Finance Costs declined 73% driven by debt
                                                                    payment through redeeming of KShs 6b bond.
6
Centum 4.0 Strategy Progress
NAV Movement | April – September 2020

                                           Excluding dividend
                                         payout, the decline in
                                              NAV is 2.7%,
                                           occasioned by fair
                                        value movements as on
                                          30 September 2020.

7
Centum 4.0 Strategy Progress
 Company NAV | Business Segment Contribution
                              Private Equity            Real estate               TRDL                MSP               Total
Kes M                         Sep-20       Mar-20       Sep-20        Mar-20   Sep-20    Mar-20   Sep-20    Mar-20   Sep-20     Mar-20
Investment portfolio            9,836          10,235   26,312        29,846    6,486     7,034    2,902     2,902   45,536     50,017
Marketable securities               -               -        -             -        -         -    3,623     3,151    3,623      3,151
Cash and cash equivalent            -               -        -             -        -         -    1,743     2,912    1,743      2,912
Receivables and prepayments       470            629         -             -        -         -        -         -      470        629
PPE and intangible assets         134            142         -             -        -         -        -         -      134        142
Total assets                  10,440       11,006       26,312        29,846   6,486     7,034    8,269     8,965    51,506     56,850
Borrowings                          -               -    3,065         6,722      522       763        -         -    3,587      7,486
Deferred tax liabilities           58             88       799           869      231       238        -         -    1,087      1,196
Other liabilities                 415            730     1,074             -        -         -        -         -    1,488        730
Total liabilities                473             818     4,937         7,592     753     1,001         -         -    6,163      9,411
                                    -               -        -             -        -         -        -         -        -          -
Net asset value                9,967       10,188       21,375        22,254   5,733     6,032    8,269     8,965    45,344     47,439
NAV/Share (Kes)                  15.0           15.3      32.1          33.4      8.6       9.1     12.4      13.5     68.1       71.3

 8
Centum 4.0 Strategy Progress
     Share Price, Market Performance & NAV

                                       Centum Share Price vs NSE 20 Index                                             Centum’s share price has
                90.0                                                                                         6,000     declined over the past 6
                               5,248                                                                                    years in pace with the
Kes per Share

                80.0   4,946
                                                                                79.0                         5,000   overall bearish performance
                70.0                                               73.2                    71.3
                                                                                                                       of local equities market.
                               63.5       3,982        67.3       3,845                            68.1
                60.0                                                                                         4,000
                                          59.1                                                                             Thus, our market
                                                   3,113
                50.0
                                                                            2,846                                       capitalization does not
                               48.0       46.0                    44.5                                       3,000
                40.0                                                                                                 reflect the intrinsic value of
                       36.5                            34.5                               1,891    1,852
                                                                                                                      the underlying portfolio of
                30.0   34.5                                                     32.0                         2,000
                                                                                                                                 assets.
                                                                                           22.7
                20.0                                                                               20.3
                                                                                                             1,000    2.7% decline in NAV vs 2%
                10.0
                                                                                                                        decline in NSE 20 and
                 -                                                                                           -       12.85% decline in MSCI EFM
                       FY14    FY15       FY16         FY17       FY18          FY19       FY20   Sep 2020           Africa ex ZA between March
                                       NAV per Share          Price per Share          NSE 20                               and Sep 2020.

    9
Centum 4.0 Strategy Progress
                  Significant opportunity for value investors
                                                                                     Asset contribution to Centum’s NAV per Share | September 2020
                        Simulated share price attribution to our portfolio
                                                                                   Portfolio Assets                     NAV/Share            Valuation Methodology       Multiple | Discount
                                                                                                                 Sep 2020    March 2020
                       20.3                                                  Kes
                                                           7.9          vs         Marketable Securities             12.4             14           Market price                  na
                                                                             46
                                                                                   Sidian Bank                        3.15           3.88          PB Multiple              0.51x | 20%
                                                                                   Isuzu East Africa                  3.67           3.67        EBITDA Multiple            6.51x | 30%
                                                                                   Longhorn Publishers
KShs. Per Share

                                                                                                                      1.17           1.30          Market price                  na
                                                                                   NAS Servair                        0.92           0.92        EBITDA Multiple             4.17x |30%
                                                                                   ACE Holdings                       1.40           1.40             Cost                       na
                                      12.4                                         Other Private Equity Assets        2.07           2.19             Cost                       na
                                                                                   Private Equity                      12             13

                                                                                   Vipingo Development               18.07          23.11       Market comparison                na
                                                                                   Pearl Marina                      11.38           8.52       Market comparison                na
                                                                                   Other Real Estate Assets           2.82           1.30             Cost                       na
                                                                                   Centum Real Estate                  32             33
                                                                                   Akiira                             2.21           2.18             Cost                       na
                                                                                   Amu Power                             -              -              na                        na
                                                                                   Greenblade Growers                 0.24           0.20             Cost                       na
                                                                                   Other Development Assets              -           0.04             Cost                       na
  Share Price as at                    Cash +          Implied Market
                                                                                   Development                          2              2
          30th Sep 2020              Marketable       Valuation for rest           Total for PE and Centum RE
                                     Securities          of portfolio              Portfolios                          47             49
                                                                                                                                            Market comparison; DCF for
                                                                                   Two Rivers Development
                                                                                                                      8.61           9.10             Mall                       na
                                                                                   Total NAV per Share               55.7             58

                  10
Centum 4.0 Strategy Progress
Company Cash Flows
Kes M Sept ‘20 Sept ‘19
▪ Centum received its first cash distribution from
Centum Real Estate of Kes 3.75 billion in
Opening cash and cash equivalents 2,912 252 repayment of shareholder loans.
Net cash from operations 3,908 19,776 ▪ Prior period cash mainly consist of proceeds from
disposal of the bottlers.
Net cash used in investing activities (934) (663) ▪ Kes 6.6 billion spent on repayment of Centum
Bond including accrued interest.
Cash generated from/ (used in)
(4,143) (7,420) ▪ Short-term borrowing of Kes 2.5 billion expected
financing activities
to be repaid within the next 6 to 12 months.
Closing cash and cash equivalents 1,743 11,945
11Portfolio Review 12
Centum Real Estate Limited
           Managed by

  13
Centum Real Estate
Organization structure |Centum Real Estate Limited
We completed the consolidation of real estate assets under Centum Real Estate Limited – a HoldCo which is 100% owned by Centum
Investment Plc. This structure excludes Two Rivers which we hold separately alongside other investors.
Centum Investment Plc
100% 58%
Centum Real Estate Two Rivers Development 50%
Two Rivers Mall
Limited Limited
100% 100% 100%
100%
Uhuru Heights Limited Vipingo Development Limited Centum Development Company
Kenya Centum Development Kenya Limited (Mauritius)
Kenya Limited
100%
Projects:
Cascadia Apartments • Awali Pearl Marina Estates Limited
• Palmridge Uganda
Projects:
• Mirabella Villas
Riverbank Loft Two Elmer • Bellavista Apartments
365 Pavilion Mzizi
Two Rivers Rivers Kasarani • Riviera Townhouses
• La Perla Bungalows
14 Project SPVS • Signature VillasCentum Real Estate Limited
Strategic Pillars
Under Centum 4.0, Centum Real Estate is pursuing a three-pronged strategy to deliver Kes 16 Billion cash to
Centum Investment Plc
Pillar Objective Achievement
1 ✓ Market validated projects of 1,482 units under construction with a
profit potential of Kes 4.2 billion.
Infill To generate a cash return of Kes 9 billion
to Centum over the strategy period. ✓ Increased sales* from 999 units at March to 1,086 units at Sep 2020.
Projects
✓ Increased deposits collected from ongoing projects from
Kes 1.95 billion at March 2020 to Kes 2.6 billion at Sep 2020.
2 Repayment of Financed by the sale of bulk land within
Shareholder our current land bank.
✓ KES 3.0 billion: Gross value of bulk land sales closed to date.
Loans
*Units pre-sales and bulk land sales are not yet reflected on the 1HY2021 income statement. Under IFRS 15, unit sales and profits to be
booked progressively as seller and buyers fulfil their obligations.
15Centum Real Estate Limited
Infill developments cash potential
Key Metrics Sep 2019 March 2020 Movement Sep 2020 Movement
No. of Units U/C 1,316 1,442 126 1,482 40
Centum Real Estate Limited has
No. Sold 797 999 202 1,086 87
locked in Kes 10.1 billion or 63% of
% achieved 61% 69% 9% 73% 4% their five-year Kes 16 billion targeted
cash distribution to Centum. The
Revenue potential of sold funds will flow up as the projects and
units 5,867 7,574 1,707 9,235 1,661
land transactions are completed.
Deposits collected* 1,249 1,973 724 2,623 650
% achieved 21% 26% 28% Kes 4.2Bn profit potential of units
Profit potential of units U/C 3,610 3,674 65 4,183 508 under construction includes Kes 2.2 Bn
to be realized from residential unit
developments and Kes 2.0 Bn value of
Balance of Sales to collect 4,618 5,600 982 6,612 1,012
own land to be unlocked through sale
Cost to complete 6,419 5,217 (1,202) 5,400 184
of those residential units.
Cost coverage 0.7x 1.1x 1.2x
*Deposits relate to residential units only. An additional Kes 369 Mn has been collected on land sales to date.
16Centum Real Estate Limited
Fund raising | Kes 4Bn Bond issue is underway
Issuer Centum Real Estate Limited (subsidiary of Centum Investment Plc)
Purpose Bridge funding for the construction of residential development projects
Tenor 3 years
Amount KES 4,000,000,0000 (with a KES 2bn green shoe option)
Description Secured Zero Coupon Notes
Currency KES
Interest rate/coupon Zero coupon
Discount rate 3 year Treasury bond plus the margin
Security • Floating charge over the receivables and any unsold units within funded projects.
• Fixed charge over a sinking fund managed by the trustee.
Embedded options • Conversion of the outstanding amount into housing units
• Equity linked component with variable return based on project IRR.
Credit Rating Short term and long term issuer ratings of A2(KE) and BBB+(KE) by Global Credit Ratings
(GCR).
Status The Bond is currently underway
This a is restricted offer for eligible investors only. To subscribe, visit
https://bond.candrgroup.co.ke/
17Two Rivers Development 18
Two Rivers Development
Strategic objectives

     Pillar                           Objective                                    Achievement

     Monetization of   ▪ To generate cash through sale of bulk     •   Kes 1.9 billion in sales of development rights
1                        development rights.
     the Land Bank     ▪ Use proceeds in debt reduction
                                                                       under negotiation.

                       • Management of rental assets such as Two   •   Growth in mall letting from 81% in April 2020 to 82% in
2    Rentals             Rivers Mall and Theme Park                    Sep 2020 despite the impact of COVID-19;
                                                                   •   Completion of 4DX cinema construction.

19
Two Rivers Development
Two Rivers Lifestyle Centre update as at 30 September 2020
Mall Occupancy on the Gross Lettable Area
+1% on
59,032 sq.
82% metres
81%
78%
75% 76%
72%
HY18 FY18 HY19 FY19 FY20 HY21
Office Towers Occupancy on the Gross
Lettable Area
20% 20%
14%
9% 11%
6% The first 4DX cinema and the largest Imax screen in East and
Central Africa, set on the mall rooftop and expected to drive
HY18 FY18 HY19 FY19 FY20 HY21 higher traffic.
20Private Equity
Managed by
21Private Equity
Portfolio Highlights | HY2020/21
1
• 5 out of 8 assets remained profitable in the period, including Isuzu, Sidian,
Nabo Capital.
Profitability
2 • Portfolio companies demonstrated resilience in the the covid-19 environment,
preserving sufficient cash to remain self funded.
Liquidity
• As a result, no dividend payments were made by portfolio companies to
Centum in H1 FY2021.
3
• The assets maintained their leading market positions with all of the
Market Leadership portfolio companies either retaining or growing their market shares in the
period.
22Private Equity
Sidian Bank
26% growth in loan book and significant improvement in asset quality as NPL ratio drops from 20% to 12%
September 2020 update
Sidian’s Net Interest and Non-funded Sidian’s Profit (Loss) After Tax 12% -6%
Income FY2016 to HY2021 NPL ratio
113
596
38%
28
1,045
1,449 NFI contribution to total
656 revenues
KShs million
KShs million
2016 2017 2018 2019 June 2020
(86)
3,096
651
2,014 2,118 2,133 46%
1,050
Liquidity Ratio
2016 2017 2018 2019 June 2020 (378) Improved performance in 2HY20
(422) expected to unwind the loss.
Interest Income Non-Funded Income
23Private Equity
Longhorn Publishers
Digital and geographical diversification present the next growth frontiers
Diversification to digital products
❑Extended schools closure in Kenya has
significantly reduced business activity
9 markets
Geographical
❑Performance expected to improve going
operations
forward driven by increased focus on digital
products and regional diversification.
24.5%
❑Schools expected to fully re-open in
Market Share in KE
January 2020, which will ramp up business
activity.
https://elearning.longhornpublishers.com/
24Private Equity
Isuzu East Africa
Isuzu has continued its market dominance at 40% market share
Strategic partnership with consumer financiers to boost sales... Kes 2.6 Bn 5%
Carrying Value Dividend Yield
+4.3%
Market share gained in 2020
40.0%
35.7%
28.1%
2018 2019 Oct-20
Source: Kenya Motor Industry Association (KMI)
25Private Equity
NAS Servair
Market leadership in airline catering
❑ Provides in-flight airline catering with > 90% market share.
❑ Business has been impacted by reduced air travel due to Covid-19.
❑ Expected recovery over the next 6 – 12 months as activity
gradually resumes.
❑ Currently focusing on diversification of revenue streams into
corporate catering and in-train catering (e.g for SGR).
26Private Equity
Zohari Leasing
Total Assets | 25% CAGR from FY2017 – HY2021
KShs. 470 million +8%
Total Assets (Kes M) Total Assets
500 470
446
450
400 KShs. 18 million +8%
350 316
333 EBIT
300 264
241
250 217
197
200
Sector diversification
150
consumer, agribusiness, business
100 technology, construction
50 equipment and healthcare
0
FY 2017 HY 2018 FY 2018 HY 2019 FY 2019 HY 2020 FY 2020 HY 2021
27Development
Managed by
28Development
Status Update on Akiira Geothermal
37.5% Stake
KShs. 1.45 billion
Carrying Value
Milestones to date
✓ Geoscientific studies
Power Purchase Agreement (PPA)
✓ completed and reports
Government of Kenya Letter of Support
✓ showed significant
Land acquired
✓ resource potential.
✓ Commenced exploratory drilling
29Marketable Securities
Managed by
30Marketable Securities
Portfolio Allocation and Performance Highlights
Portfolio composition | 31 March 2020 Portfolio composition | 30 September 2020
5% 5% 5%
16%
21%
Equities 30% Equities
Fixed Income Kes 8.9 Bn Fixed Income
Kes 8.3 Bn
Cash Cash
60%
Mutual Funds Mutual Funds
58%
❑ 79% of the portfolio made up of Cash and Fixed Income at Sep 2020. MSP Composition – Sep 2020 Kes M
Equities 1,305
Fixed Income 4,818
❑ KES 443 million cash return generated in HY2020/21.
Cash 1,743
Mutual Funds 402
❑ Annualized gross return achieved to September 2020 was 11.5%.
Total 8,268
31Marketable Securities
Strategy is to preserves value and optimize cash return
Dampened YTD Performance of Emerging Markets Equities Yield on total Nabo Capital AUMs remain on an upward trajectory
110
0.85%
105
0.80%
0.79%
100 0.80%
0.76%
95 0.75%
0.70%
90 0.70% 0.7%
0.70% 0.69%
0.67%
85 0.66%
0.64% 0.64%
0.65%
0.63%
80 0.60% 0.61%
0.60%
0.60% 0.58%
75 0.57% 0.56%
0.56%
0.55% 0.54%
70 0.52%
0.51%
65 0.50%
Jan-20 Feb-20 Mar-20 Apr-20 May-20 Jun-20 Jul-20 Aug-20 Sep-20 Oct-20
MSCI World MSCI Emerging MSCI Africa ex-ZA NSE All Share
Our MSP strategies continued to outperform emerging markets even in the uncertain covid-19 environment.
32CSR Engagement
Managed by
33Tackling Youth Unemployment
Ajiry’s mission is to create empowerment and employment for individuals as well as small businesses/start ups
1 Ajiry App 2 Ajiry Learning
• Ajiry platform (https://www.ajiry.com/jobs)
connects skilled job seekers to opportunities. • Our County teams have
developed over 100
• To date, Ajiry has over 42,000 skills listed, courses tailor made to
advertised 10,000+ job connections. compliment the needs and
• Over 13,000 successful hires to formal and social economic activities
informal sectors. of each specific county.
• To date, Ajiry has over
30,000 skills listed,
3 Zero Contact Distribution System (ZCDS)
advertised 10,000+ job
• Developed a system to enable the contactless connections.
distribution of food hampers during the • Over 13,000 successful
covid-19 pandemic. hires to formal and
informal sectors.
• Adopted by 10 partners, including counties to
safely distribute relief food.
• 75,000+ families reached through the
system.
34Covid-19 Mitigation
Standing together with our communities
Short- and long-term intervening measures to mitigate covid-19 impact
35Financial Performance 36
Consolidated Income Statement
                                                                        ▪   Trading income declined due to
KShs. Millions                            HY2021     HY2020        %
                                                                              ✓ Disposal of Almasi in prior year
Trading (loss)/profit                       (404)       254    -259%          ✓ Impact of Covid 19 on trading businesses
Operating income /(loss) from financial
                                                        131
services                                       38               -71%    ▪   Operating Income from financial services
Investment income                             417     12,391    -97%          ✓ Profitability impacted by reduction in non-funded
Other income                                 (62)         23   -362%             income at Sidian.
Operating expenses                          (503)      (697)    -28%
Finance costs                             (1,331)    (2,037)    -35%    ▪   Prior Year exceptions included
Share of losses in joint ventures and                                         ✓ Gain on disposal of bottlers KShs 12b
associates                                  (204)       (62)    230%          ✓ Impairment provision of KShs 2.3b
Provision for impairment of assets                   (2,286)                  ✓ Income Tax on Gain of KShs 0.8b
Profit before tax                         (2,049)     7,717    -127%
                                                                        ▪   Investment income
Income tax credit/(expense)                    67      (926)    -107%
                                                                              ✓ Lower dividends
Profit after tax                          (1,982)     6,791    -129%          ✓ Interest from MSP of KShs 280m.

Other comprehensive income, net of tax        268      (194)    -238%   ▪   Sale of Residential Units
Total comprehensive income                (1,714)     6,597    -126%          ✓ Moving forward expecting to recognize revenue
                                                                                  and income from Centum RE.
Earnings per share                         (2.09)     10.70
                                                                        ▪   Finance costs reduced due to settlement of Centum
Attributable to:                                                            Bond of KShs 6b.
Owners of the parent                       (1,122)    6,929    -116%
Non-controlling interest                     (592)     (332)     78%    ▪   Share of loss of KShs 592m mainly attributable to
                                                                            Minority Shareholders of TRDL and Longhorn.
Total comprehensive income                (1,714)     6,597
37
Consolidated Statement of Financial Position
KShs. millions HY2021 FY 20
Property, plant and equipment 4,157 4,099 ▪ Inventory – Residential Units
Investment property 41,568 41,181 ✓ Centum RE Inventory - residential
Inventory - Residential houses under construction 4,257 3,016 projects increased by KShs 1.2b to
Right of use assets 1,014 1,062
KShs 4.2b
Goodwill and intangible assets 1,397 1,369
Investment portfolio:
✓ Expected to gradually convert to
- Associates 1,469 1,450
Costs of Sales as some residential
- Joint ventures 2,686 2,890
- Unquoted equity investments 4,574 4,550
units are handed over in H2.
- Quoted investments 513 399
- Government securities and corporate bonds 11,183 8,913 ▪ Deferred Income – Real Estate
Loans and advances 18,294 14,961 ✓ Represents deposits received from
Inventory 548 621 bookings of residential units and for
Receivables and other assets 7,966 9,168 land transactions.
Cash and cash equivalent 8,850 8,182
Total assets 108,476 101,861 ✓ Expected to gradually convert to
Borrowings 26,216 22,197 Revenue as some residential units
Customer deposits 21,641 17,460 are handed over and land sales are
Payables, accruals and other liabilities 4,639 3,971 completed in H2.
Deferred income – Real Estate 2,937 2,223
Lease liability 1,203 1,270
Deferred tax liabilities 1,880 2,118
Total liabilities 58,517 49,239
Net asset value 49,960 52,622
38Company Income Statement
KShs. Millions HY2021 HY2020 %Δ ▪ Company PBT increased from loss of KShs
804m to profit of KShs 95m.
Investment income 729 3,022 -76%
Operating expenses (299) (312) -4% ▪ Prior Year exceptions included
✓ Gain on disposal of bottlers KShs 2.2b
Finance costs (335) (1,228) -73% ✓ Impairment provision of KShs 2.3b
Impairment of assets - (2,286) 100% ✓ Income Tax on Gain of KShs 0.8b
Profit before tax 95 (804) 112% ▪ Investment income
Income tax expense - (800) 100% ✓ Lower dividends received
✓ Total Interest income from MSP of KShs
Profit after tax 95 (1,604) 106% 280m and KShs 323m from inter
company loans.
Unrealised gains (1,392) 58 -2500%
▪ Revaluation losses of KShs 1.4b driven by
Return for the year (1,297) (1,546) 16%
lower business performance and decline in
multiples due to Covid-19 impact.
Total comprehensive (loss)/ income (1,297) (1,546) 16% ▪ Cost containment measures effected by
company reducing operating expenses by 4%
Return on opening NAV -2.7% -2.9% ▪ Finance Costs declined 73% driven by debt
payment through redeeming of KShs 6b bond.
39Company Statement of Financial Position KShs. millions HY2021FY 2020 %Δ KShs. millions HY2021FY 2020 %Δ Investment portfolio: Borrowings 3,587 7,486 (52%) - Investment in Subsidiaries 28,731 30,236 (5%) Other Liabilities 2,575 1,925 34% - Debt Investment in Subsidiaries 12,656 15,631 (19%) Total Liabilities 6,162 9,411 (35%) - Unquoted Investments 4,126 4,126 0% - Government securities and Share Capital 922 922 - corporate bonds 3,455 3,151 10% Retained Earnings 22,281 23,984 (7%) - Quoted Investments 191 23 730% Revaluation Reserves 22,141 22,533 (1.7%) Total Portfolio 49,159 53,167 (8%) Shareholder Funds 45,344 47,439 (4%) Other Assets 604 771 (22%) Cash and Equivalents 1743 2,912 (40%) Equity and Liabilities 51,506 56,850 (9%) Total Assets 51,506 56,850 (9%) NAV Per Share (KShs.) 68.14 71.29 (4%) Centum to receive distributions in the form of Dividends and Repayment Shareholder Loans from Centum RE and Other subsidiaries Company has capacity to distribute dividends from accumulated Retained Earnings of KShs 22.1bn and Revaluation Reserves of KShs 22.2bn 40
Company Cash Flow Statement
KES millions                                               HY 21      HY 20
Cash flows from operating activities
Net cash generated from operating activities               3,908     19,776
                                                                                ▪   Centum received its first cash
Cash flows from investing activities                                                distribution from Centum Real
Investments in subsidiaries (equity)                             -       (45)       Estate of Kes 3.75 billion in
Net debt investment in subsidiaries                          (461)      (501)       repayment of shareholder loans.
Investment in government securities and corporate bonds      (304)          -
                                                                                ▪   Prior period cash mainly consist
Purchase of shares in quoted investments                     (169)          -       of proceeds from disposal of the
Purchase of shares in unquoted investments                       -      (117)       bottlers.
Net cash used in investing activities                       (934)      (663)
Cash flows from financing activities                                            ▪   Kes 6.6 billion spent on
                                                                                    repayment of Centum Bond
Proceeds from borrowings                                     2,550      1,394
                                                                                    including accrued interest.
Repayment of borrowings                                    (6,210)    (7,754)
Interest paid on borrowings                                  (483)    (1,060)   ▪   Short-term borrowing of Kes 2.5
Net cash generated from financing activities              (4,143)    (7,420)        billion expected to be repaid
Net increase in cash and cash equivalents                 (1,169)    11,693         within the next 6 to 12 months.
At start of period (March 2020/March 2019)                  2,912        252
At end of period (Sep 2020/Sep 2019)                        1,743    11,945

41
Company Statement of Financial Position
Gearing & Liquidity
Kes. Mn FY '16 FY '17 FY '18 FY'19 FY'20 HY’21 ▪ Bond redeemed in June 2020, leading to full
repayment of long-term in HY2020/21.
Short Term Debt (982) (3,482) (108) (7,486) (3,587)
-
▪ Reducing debt and improving liquidity resulted
Long Term Debt (10,475) (13,674) (11,360) (16,036) - - in stronger balance sheet with a positive net
debt.
Total Debt (10,475) (14,656) (14,843) (16,145) (7,486) (3,587)
Cash and Cash Equivalents 3,849 2,447 1,078 253 2,912 1,743 ▪ Kes 300 million savings on potential FX losses
on RMB USD debt repaid.
Marketable Securities 2,673 3,133 3,566 3,781 6,053 6,526
Net (Debt) / Cash Position (3,953) (8,094) (10,198) (12,110) 1,480 4,682 ▪ Kes 892 million (73%) reduction in company
finance cost compared to a similar period last
Equity 22,936 44,808 48,686 52,600 47,439 45,344
year.
Net Debt to Equity 17% 18% 21% 23% nill nill
▪ Business units can utilize debt capital to the
Long Term Debt to Equity 46% 31% 30% 31% nill nill extent supported by their free cash flows.
42Outlook
Outlook | 2HY 2020/21
                                                                                            Marketable
                       Real Estate                     Private Equity                                                           Development
                                                                                            Securities
 objectives

                                                                                                                         •   Drive value creation in the
  Strategic

              •   Monetization of              •   Portfolio management for         •   Liquidity preservation and
                                                                                                                             underlying assets and
                  underlying portfolio             value creation.                      generating stable cash
                                                                                                                             unlock value across the
                  value and generate                                                    return to Centum.
                                               •   Redeployment into new                                                     portfolio.
                  cash return to Centum.           opportunities.

              ✓ 60% of pre-COVID sales         ✓ No dividend payout as                                                   ✓ No major impact.
Covid-19

                                                                                    ✓ Low dividend payout.
 Impact

                realized                         portfolio companies conserve
                                                 liquidity.                                                              ✓ Scheduled milestones are on
              ✓ 90% of prior year cash                                                                                     course.
                collections achieved.          ✓ Attractive valuation of targets.   ✓ Interest rate and FX volatility.

              ✓ Completes ongoing projects     ✓ Active portfolio management        ✓ Maintain capital preservations     ✓ Drive project milestones
Management

                and recognize their profits,     for continued resilience and         strategies and stable cash           towards financial close.
                include the value of the         value preservation.                  returns.
   Focus

                land they sit on.
                                               ✓ Support    management      to      ✓ Optimize portfolio cash yield,     ✓ Cash realization or transition
              ✓ Further pay down                 shorten business recovery and        taking      advantage       of       the assets to generating
                shareholder loans.               resume dividend payment.             opportunities during recovery        positive cash flows.

        44
Q&A
Centum Investment Company Plc
         9th Floor South Tower, Two Rivers
                   P.O. Box 10518 – 00100
                            Nairobi Kenya

Tel: (+254) 20 228 6000 / (+254) 709 902000
      Email: investorelations@centum.co.ke
You can also read