Investor Meetings in Bangkok & Kuala Lumpur - 11-13 November 2019 - Keppel REIT
←
→
Page content transcription
If your browser does not render page correctly, please read the page content below
Investor Meetings in
Bangkok &
Kuala Lumpur
11-13 November 2019
Outline

       • Key Highlights                                                                                                                                               3
       • Market Review                                                                                                                                                6
       • Portfolio Optimisation                                                                                                                                      11
       • Additional Information                                                                                                                                      24

IMPORTANT NOTICE: The past performance of Keppel REIT is not necessarily indicative of its future performance. Certain statements made in this presentation may not be based on historical information or facts and may be
“forward-looking” statements due to a number of risks, uncertainties and assumptions. Representative examples of these factors include (without limitation) general industry and economic conditions, interest rate trends, cost of
capital and capital availability, competition from similar developments or shifts in expected levels of property rental income, changes in operating expenses, including employee wages, benefits and training, property expenses
and governmental and public policy changes, and the continued availability of financing in the amounts and terms necessary to support future business.

Prospective investors and unitholders of Keppel REIT (“Unitholders”) are cautioned not to place undue reliance on these forward-looking statements, which are based on the current view of Keppel REIT Management Limited, as
manager of Keppel REIT (the “Manager”) on future events. No representation or warranty, express or implied, is made as to, and no reliance should be placed on, the fairness, accuracy, completeness or correctness of the
information, or opinions contained in this presentation. None of the Manager, the trustee of Keppel REIT or any of their respective advisors, representatives or agents shall have any responsibility or liability whatsoever (for
negligence or otherwise) for any loss howsoever arising from any use of this presentation or its contents or otherwise arising in connection with this presentation. The information set out herein may be subject to updating,
completion, revision, verification and amendment and such information may change materially. The value of units in Keppel REIT (“Units”) and the income derived from them may fall as well as rise. Units are not obligations of,
deposits in, or guaranteed by, the Manager or any of its affiliates. An investment in Units is subject to investment risks, including the possible loss of the principal amount invested.

Investors have no right to request the Manager to redeem their Units while the Units are listed. It is intended that Unitholders may only deal in their Units through trading on Singapore Exchange Securities Trading Limited (“SGX-
ST”). Listing of the Units on SGX-ST does not guarantee a liquid market for the Units.

                                                                                                                                                                                                                     2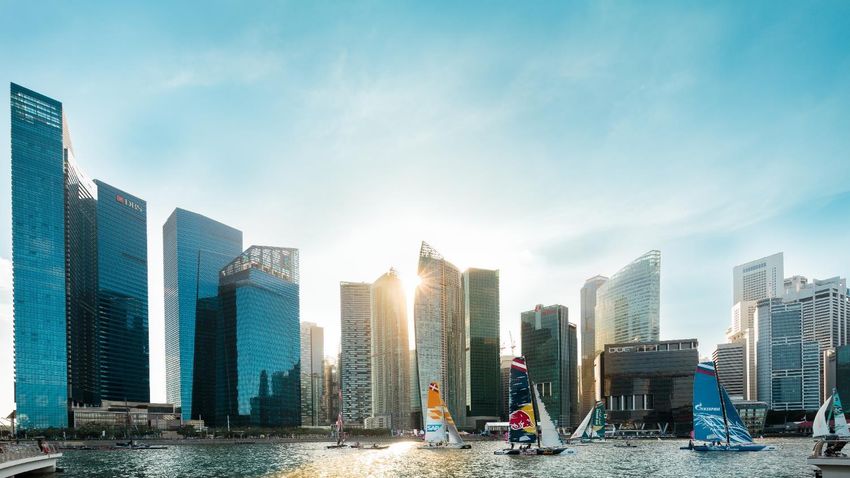
Green and Sustainable Portfolio

   Large Portfolio of             Strong Portfolio                  Commitment to
 Premium Office Assets          Occupancy and WALE                   Sustainability
                                 High portfolio committed       BCA Green Mark Platinum
 Approximately $8 billion of   occupancy of 98.9% and long    award for all Singapore assets;
 Grade A commercial assets      WALE of 5.1 years provide     5 Stars NABERS Energy rating
         pan-Asia                   income resilience            for most Australian assets

           Marina Bay                           One Raffles    Ocean Financial
        Financial Centre                          Quay             Centre

                                                                                          3
                                                                                              3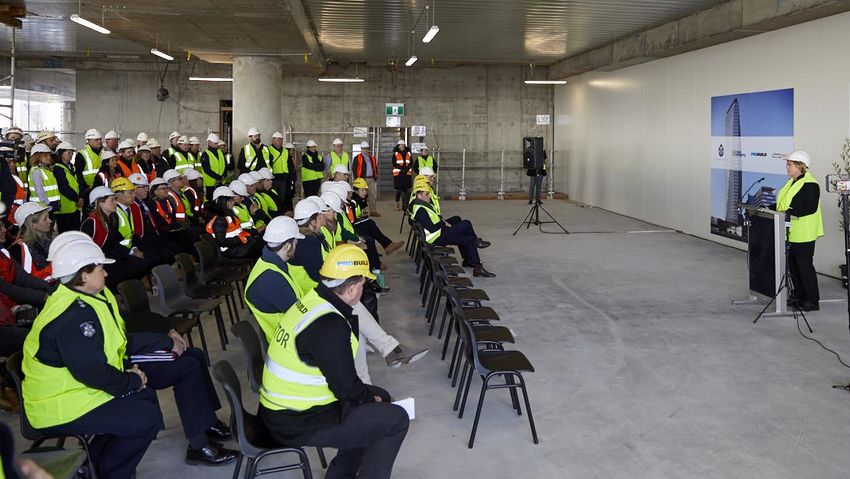
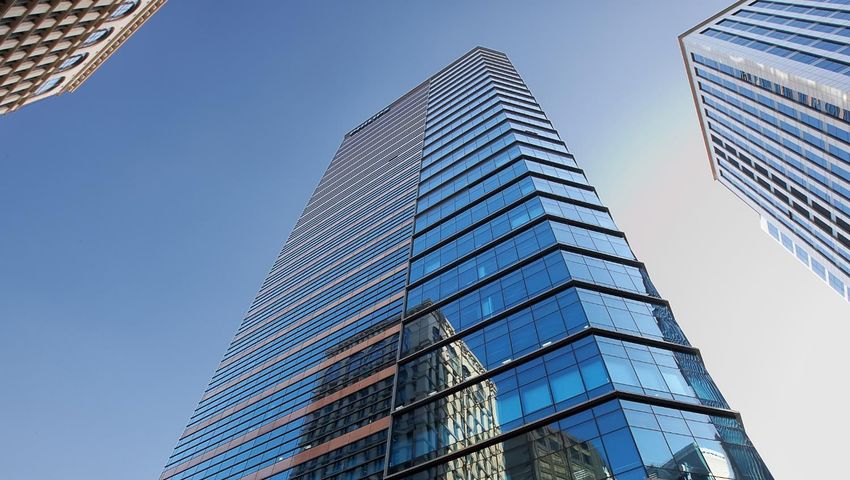
Pan-Asian REIT with Premium Office Portfolio
                      $7.9 billion portfolio in key business districts of Singapore, Australia and South Korea
                                      enhances income diversification and long-term stability

                                                                                                   T Tower, Seoul
                                  311 Spencer Street,
                                                                                                   99.38% Interest
                                       Melbourne
                                                                          South Korea
                                      50% Interest                                                                                        Ocean Financial
                                   (Under development)                       3.8%
                                                                                                                                              Centre
        8 Exhibition Street,                                                                                                               79.9% Interest
            Melbourne
           50% Interest

275 George Street,
                                                                                             Singapore                                              Marina Bay
                                                                                                                                                 Financial Centre
    Brisbane
   50% Interest
                                Australia
                               15.2%                                                       81.0%                                                  33.3% Interest

    David Malcolm
    Justice Centre,
                                                                                                                                           One Raffles Quay
         Perth
                                           8 Chifley Square,                                                                                33.3% Interest
     50% Interest
                                                Sydney
                                              50% Interest

       Note: Based on assets under management assuming that the divestment of Bugis Junction Towers was completed on 30 September 2019.

                                                                                                                                                            4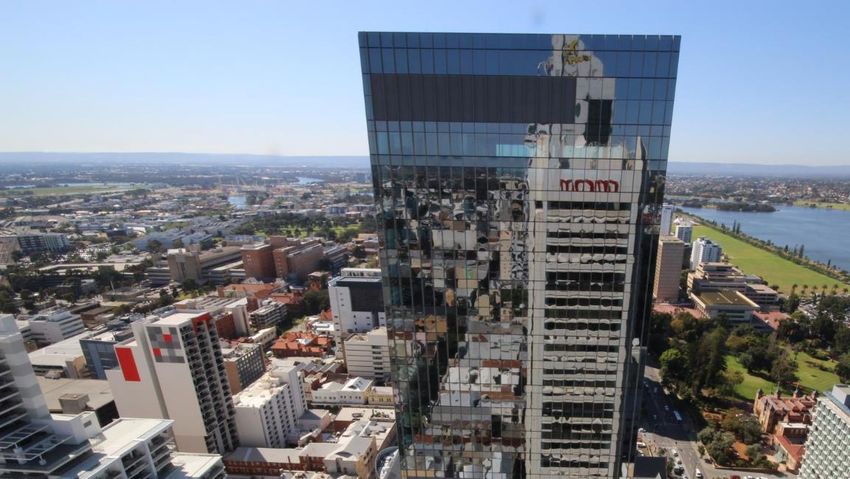
Performance Highlights
                                                      Financial Review
                                                  ▪     3Q 2019 distributable income was $47.5 million(1); 3Q 2019
                                                        DPU was up 2.9% year-on-year at 1.40 cents

                                                  ▪     9M 2019 distributable income was $142.1 million(1); 9M 2019
                                                        DPU was down 0.5% year-on-year at 4.18 cents

                                                  ▪     Continued with DPU-accretive Unit buy-back programme
 Topped out 311 Spencer Street in Melbourne       ▪     All-in interest rate down from 2.86% p.a. to 2.82% p.a.

                                                      Portfolio Updates
                                                  ▪     High portfolio committed occupancy of 98.9% and long
                                                        portfolio weighted average lease expiry (WALE) of 5.1 years

                                                  ▪     311 Spencer Street topped out with development completion
                                                        expected in 2Q 2020

                                                  ▪     Divestment of Bugis Junction Towers as part of ongoing
 Divesting Bugis Junction Towers in Singapore           portfolio optimisation strategy
                                                (1) Includes distribution of capital gains of $2.0 million for 3Q 2019 and $8.0 million for 9M 2019.   5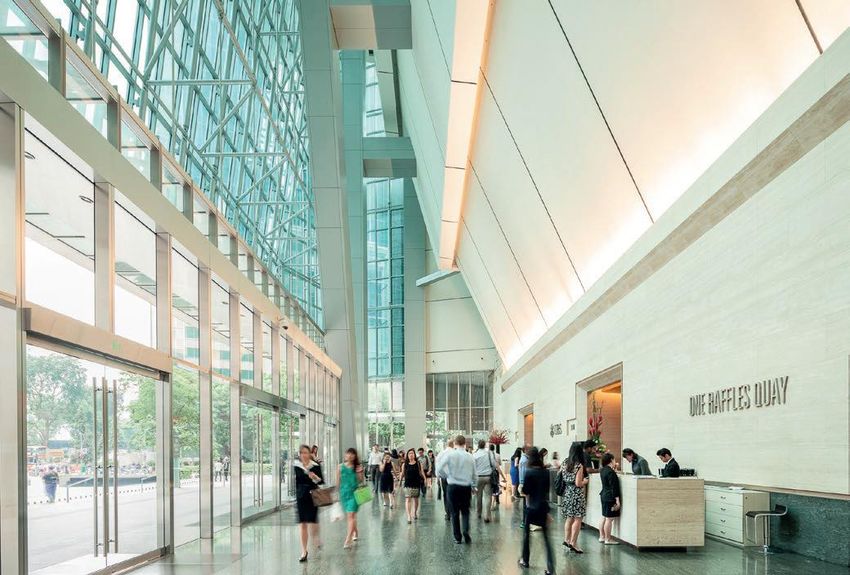
Looking Ahead

Singapore CBD Skyline

                        6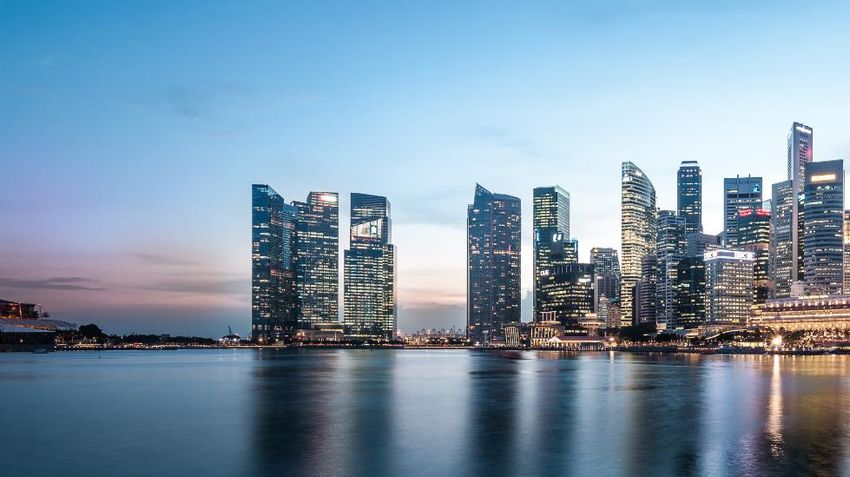
Singapore Office Market

▪ Average Grade A office rents increased to $11.45 psf pm as average occupancy in core
  CBD rose to 96.0% in 3Q 2019

                          95.7%     94.8%     95.8%     93.8%    94.8%    95.2%    95.8%    96.0%
                   $15                                                                               100%
                          $11.20                                 $10.80   $11.15   $11.30   $11.45
                   $12              $10.40                                                           80%
                                              $9.10      $9.40
                    $9                                                                               60%

                    $6                                                                               40%

                    $3                                                                               20%

                    $0                                                                               0%
                         Dec-2014 Dec-2015 Dec-2016 Dec-2017 Dec-2018 Mar-2019 Jun-2019 Sep-2019

                             Average Grade A Rent ($ psf pm)       Core CBD Average Occupancy (%)

Source: CBRE, 3Q 2019.

                                                                                                            7
Singapore Office Market (Cont’d)

Office Demand and Supply
 Past average annual net demand(1):                                                               Key Upcoming Supply in CBD(2)                                 sf
            0.7 million sf
  Past average annual net supply(1):               Forecast average annual supply(2):                  HD 139                                          84,000
            1.0 million sf                                   0.9 million sf               4Q 2019
                                                                                                       9 Penang Road                                  381,000

                         2.1                                                                           55 Market Street (AEI)                          76,000
                                 1.9                                        1.8
                                             1.7                                                       30 Raffles Place                               313,000
                                                                                           2020
                                                                                                       Afro-Asia I-Mark                               154,000
                                                          1.1                                          79 Robinson Road                               514,000
                                     0.8   0.8     0.8            0.8
                  0.4      0.4                                                                         CapitaSpring                                   635,000
       0.3                                                                                 2021
          0.2 0.02
                                                                                                       Hub Synergy Point Redevelopment                128,000
                                                                                   0.0

       2014    2015      2016    2017      2018    2019   2020    2021      2022   2023                Central Boulevard Towers                     1,138,000
                                                                                           2022
                        Net Supply     Net Demand         Forecast Supply                              Guoco Midtown                                  650,000

  1)   Based on URA data on historical net demand and supply of office space in Downtown Core and Rest of Central Area. Supply is calculated as net change of
       stock over the year and may include office stock removed from market due to demolitions or change of use.
  2)   Based on CBRE data on CBD Core and CBD Fringe.

                                                                                                                                                           8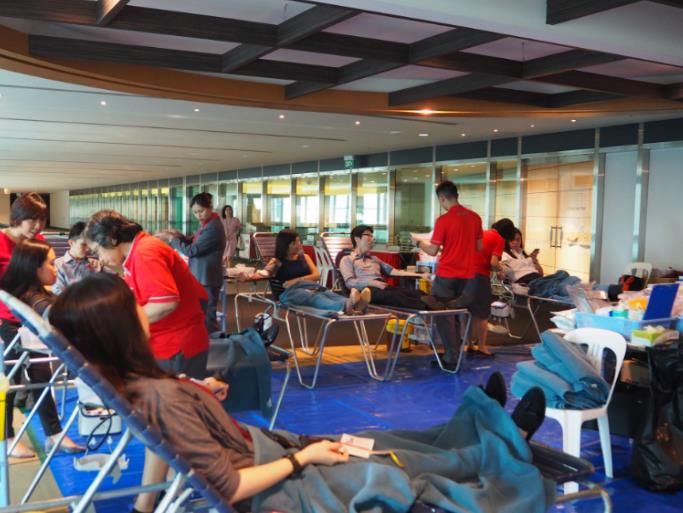
Australia Office Market
▪ National CBD office market occupancy was stable quarter-on-quarter at 91.7% as at
  end June 2019
                                                                  96.0% 96.4% 95.9%                                               88.4% 86.8% 86.0% 89.6% 92.8% 92.1% 92.3% 100%
   Sydney CBD                                 91.8% 91.3% 94.9%                        100%   Brisbane CBD
                                      89.0%
                             1,200                                                                                    1,200
                                                            964 1,032 1,039 1,041      80%                                                                                              80%
   Prime Grade occupancy 900                   679
                                                     799
                                                                                       60% Prime Grade occupancy
                                                                                                               900                                                                      60%
                                       620
   was lower at 95.9%    600                                                           40% rose to 92.3%       600                 410     397    389    386    396     400    403      40%
                               300                                                     20%                              300                                                             20%
   Steady leasing demand and                                                                  Leasing demand to         0                                                 0%
                             0                                                 0%
   limited supply to support   4Q14 4Q15 4Q16 4Q17 4Q18 1Q19 2Q19                             improve and vacancy to      4Q14 4Q15 4Q16 4Q17 4Q18 1Q19 2Q19
   high occupancy                    Prime Gross Effective Rent (AUD psm/year)                decline over the short term       Prime Gross Effective Rent (AUD psm/year)
                                               Prime Grade Occupancy (%)                                                                   Prime Grade Occupancy (%)

                                                                  97.0% 97.6% 97.5%
   Melbourne CBD                      89.7% 90.1% 92.1%94.0%                           100%                                        85.1%                 81.4% 84.0% 84.7% 85.1% 100%
                                                                                              Perth CBD                1,200               76.5% 77.7%
                              1,200                                                    80%                                                                                       80%
   Prime Grade occupancy 900                                                                                             900                                                            60%
                                                                                       60% Prime Grade occupancy                    562
                                                            503    538     539   544                                                        491                  447    447     447
   was slightly lower at 97.5%
                             600       392     406   448                               40% rose to 85.1%         600                               431    435                           40%
                               300                                                     20%                               300                                                            20%
   Vacancy to remain tight as 0                                                  0%           Vacancy to reduce with          0                                                         0%
   majority of upcoming projects 4Q14 4Q15 4Q16 4Q17 4Q18 1Q19 2Q19                           minimal supply pipeline              4Q14 4Q15 4Q16 4Q17 4Q18 1Q19 2Q19
   have been pre-committed             Prime Gross Effective Rent (AUD psm/year)                                                            Prime Gross Effective Rent (AUD psm/year)
                                       Prime Grade Occupancy (%)                                                                            Prime Grade Occupancy (%)

Source: JLL Research, 2Q 2019.

                                                                                                                                                                                  9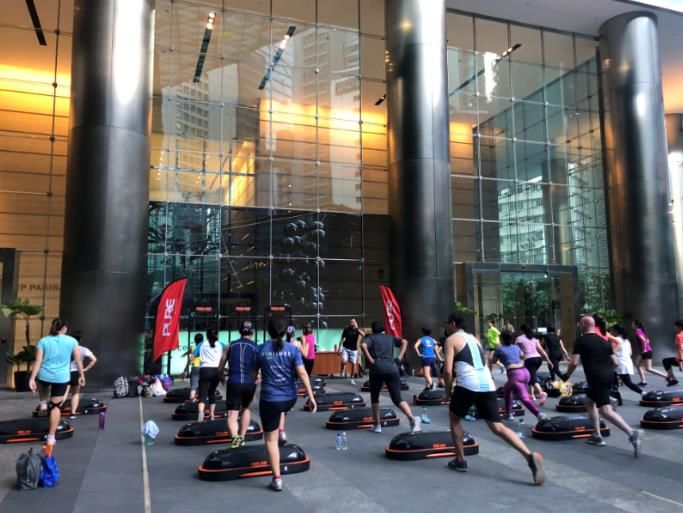
Seoul Office Market
      Occupancy Improvement                                                           Lack of New Supply After 2020

      CBD Grade A occupancy improved from 82.5% as                                    CBD Grade A occupancy is expected to decline
      at end March 2019 to 84.5% as at end June 2019                                  going into 2020, before rising in the subsequent
                                                                                      years with the lack of new supply
200,000   89.1%                                                            100%                                                                     90.3%
                   87.5%    84.9%      86.5%    82.7%    82.5%    84.5%               85.4% 89.1% 87.5% 84.9% 86.6% 82.7% 84.6% 82.6% 85.1% 87.7%           100%

160,000                                                                    80%                                                                              80%
                                                                            100,000
120,000                                                                    60%      81,041                                                                  60%
          96,540   95,618   95,164     91,704   92,148   91,665   89,514
 80,000                                                                    40%                                                                              40%
                                                                                             32,003                 37,122            33,134
 40,000                                                                    20%                                                                              20%
                                                                                                  15,670 16,011              11,572
     0                                                                     0%     0                                                                         0%
          4Q14     4Q15      4Q16      4Q17     4Q18     1Q19     2Q19                2013 2014 2015 2016 2017 2018 2019F 2020F 2021F 2022F 2023F

                    CBD Grade A Net Effective Rent (KRW per py pm)                                           CBD Grade A Supply (py)
                    CBD Grade A Occupancy (%)                                                                CBD Grade A Occupancy (%)

      Source: JLL Research, 2Q 2019.

                                                                                                                                                    10
Portfolio
Optimisation
T Tower, Seoul
11Completed Acquisition in Seoul
▪ Acquired a 99.38%(1) interest in T Tower, a freehold
Grade A office building in Seoul CBD
▪ The DPU-accretive acquisition with an initial NPI yield
of 4.7% is part of ongoing portfolio optimisation efforts
T Tower in Seoul CBD
T Tower
Building Completion 2010
Attributable NLA 226,945 sf
Occupancy 100% committed
Agreed Property Value KRW 252.6 billion(2) ($301.4 million)(3)
(1) The remaining 0.62% stake was acquired by Keppel Capital Investment Holdings Pte. Ltd.,
a wholly-owned subsidiary of Keppel Capital Holdings Pte. Ltd. (Keppel Capital)
Source: JLL Research (2) Based on an approximate 99.38% interest in T Tower. Equivalent to KRW 20.2 million/pyeong (py),
based on attributable gross floor area of 444,979 sf and conversion of 1 py to 35.6 sf.
Click to view property video (3) Based on an exchange rate of KRW 1,000 to $1.193 as at 18 April 2019.
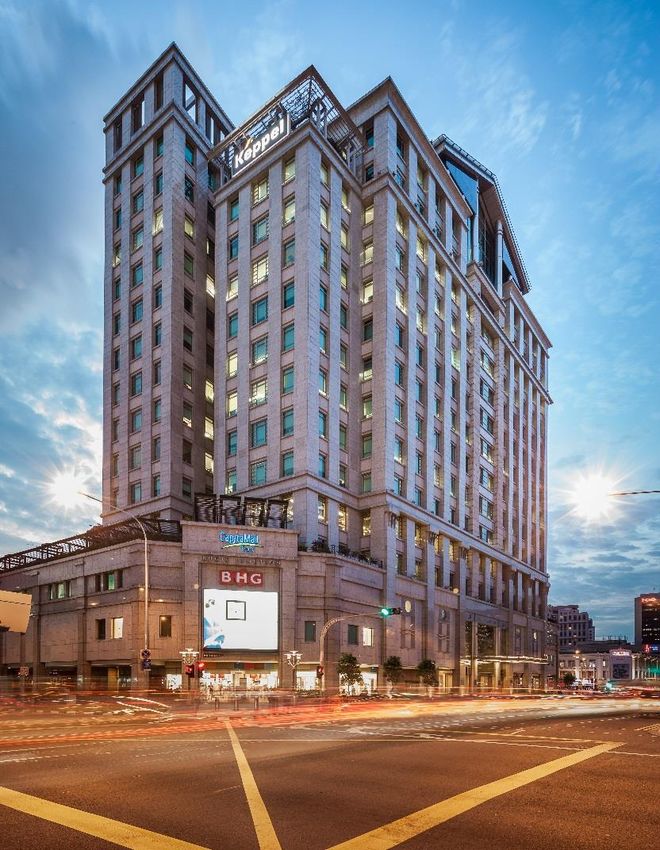
12Unlocking Value: Divestment of Bugis Junction Towers
▪ Sale of strata ownership of Bugis Junction Towers for $547.5 million ($2,200 psf), which translates
to a net property income yield of 3.0%(1)
▪ Realising capital gains of $378.1 million(2) as part of ongoing portfolio optimisation strategy
▪ Post divestment which is expected in 4Q 2019, Keppel REIT’s portfolio will remain firmly anchored
by Singapore CBD assets
Bugis Junction Towers, Singapore
Building Completion 1994
Total NLA 248,853 sf
Land Tenure ~70-year leasehold remaining until 9 Sep 2089
Occupancy (as at 30 Sep 2019) 99.0% committed
WALE (as at 30 Sep 2019) 6.0 years
Purchase Price $159.5m ($645 psf (3))
Valuation (as at 8 Aug 2019) $515.0m ($2,069 psf)
(1) Based on net property income for the 12 months preceding 30 June 2019.
(2) Based on difference between sale price and purchase price, after taking into consideration capitalised expenditures and divestment costs.
(3) Based on NLA of 247,464 sf at the time of acquisition.
13Divestment Rationale
• Attractive asset-level returns of 19.4% p.a., driven by
1
$378.1 million(1) of capital gains
▪ Unlock value of capital appreciation while maintaining
2
exposure to Singapore CBD
▪ Improved financial flexibility for ongoing portfolio
3
optimisation:
o Continue DPU-accretive Unit buy-back programme
o Redeploy funds to higher yielding assets
o Distribute capital gains
Asset-level returns
o Pare down debt
19.4% p.a.
Bugis Junction Towers has been held since ▪ In-line with strategy to continually capture opportunities
Keppel REIT’s listing in 2006 4
to achieve long-term sustainable return for Unitholders
(1) Based on difference between sale price and purchase price, after taking into consideration
capitalised expenditures and divestment costs.
14Topping Out of 311 Spencer Street
▪ Development of 311 Spencer Street in Melbourne achieved an important milestone with the topping out
and completion of the building structure
▪ The freehold Grade A office building will be internally fitted out over the coming months
▪ The 30-year lease to the Victoria Police is expected to commence in 2Q 2020 and contribute a steady
income stream to Keppel REIT
Ms Lisa Neville, Minister for Police, speaking at 311 Spencer Street
the topping out ceremony of 311 Spencer Street (Artist’s Impression)
159M 2019 Leasing Update
Total Leases Committed Leases Committed by Geography(3)
~516,400 sf
9.0%
(Attributable ~221,000 sf)
91.0%
Retention Rate
78% Singapore Australia
New leasing demand and expansions from:
Leases Committed by Type(3)
Technology, media and telecommunications 31.0%
Real estate and property services 19.4%
Average signing rent for Banking, insurance and financial services 18.9%
61.7% 32.3%
Singapore office leases
(1) Energy, natural resources, shipping and marine 8.9%
~$12.35 psf pm Retail and F&B 7.8%
above Grade A core CBD market average 6.0%
Accounting and consultancy services 3.1%
of $11.45(2) psf pm Renewal leases New leases
Services 0.1%
Review leases
Others 10.8%
(1) For the Singapore office leases concluded in 9M 2019 and based on a simple average calculation. Weighted average signing rent was $12.15 psf pm.
(2) Source: CBRE, 3Q 2019. 16
(3) Based on committed attributable area.Lease Expiry Profile and Expiring Rents
▪ Average expiring rents(1) of Singapore office leases: $9.59 psf pm in 2020, $9.53 psf pm in 2021 and
$10.00 psf pm in 2022
Geographical Breakdown of 52.0%
Expiring & Rent Review Leases(2,3)
20.8%
Singapore
23.2% 22.0%
Australia 2.0%
1.4% 3.2%
11.9% 19.8% 3.0% 10.8% 31.2%
South Korea 1.3%
15.8%
0.3%
0.8% 0.8% 0.8%
0.1% 9.8% 9.7%
0.7%
2019 2020 2021 2022 2023 2024 and beyond
Based on committed attributable NLA(2)
Expiring leases 0.8% 8.3% 16.1% 22.0% 6.9% 44.8%
Rent review leases - 3.6% 7.1% - 3.9% 7.2%
Based on committed attributable gross rent (2)
Expiring leases 1.0% 8.6% 16.5% 22.3% 7.2% 44.4%
Rent review leases - 3.5% 7.5% - 3.0% 7.3%
(1) Weighted average based on attributable NLA of office lease expiries and reviews in Singapore.
(2) Data as at 30 September 2019.
(3) Based on committed attributable NLA.
17Proactive Leasing Strategy
▪ Healthy portfolio committed occupancy of 98.9%
▪ Long overall portfolio WALE of 5.1 years (Singapore portfolio: 4.2 years, Australia portfolio: 9.2 years,
South Korea portfolio: 2.3 years); Top 10 tenants’ WALE was 7.2 years
High Portfolio Committed Occupancy Overall
(as at 30 Sep 2019) 98.9%
Singapore Australia South Korea
98.5% 99.9% 100.0%
98.6% 99.0% 97.0% 99.0% 99.6% 100.0% 100.0% 100.0% 100.0% 98.9%
Singapore’s core CBD Australia’s national CBD
(1) Seoul CBD average
average occupancy: 96.0% average occupancy: 91.7%
(2)
(2)
occupancy: 84.5%
Ocean Marina Bay One Raffles Bugis Junction 275 George 8 Exhibition 8 Chifley David Malcolm T Tower, Portfolio
Financial Financial Quay Towers Street, Street, Square, Justice Centre, Seoul
Centre Centre Brisbane Melbourne Sydney Perth
Sources: (1) CBRE, 3Q 2019 (2) JLL Research, 2Q 2019
Note: Based on committed attributable area.
18Diversified Tenant Base
Top 10 Tenants Profile of Tenant Base
37.2% of NLA 34.7% of gross rent 355(1) tenants in total
DBS 6.1%
Government of
GOWA
Western Australia 4.9%
Banking, insurance and financial services 38.5%
Standard Chartered 4.2% Technology, media and telecommunications 11.9%
Government agency 11.5%
Ernst & Young 3.8%
Energy, natural resources, shipping and marine 8.9%
Enterprise Singapore
ES 3.8% Legal 8.4%
Ocean Financial Centre
BNP Paribas 3.8% Accounting and consultancy services 5.4%
One Raffles Quay
275 George Street Real estate and property services 5.2%
Telstra 3.2%
Bugis Junction Towers Services 4.1%
UBS 2.8% 8 Exhibition Street Manufacturing and distribution 2.1%
Marina Bay Retail and food & beverage 1.8%
Drew & Napier 2.3% Financial Centre
David Malcolm
Hospitality and leisure 1.2%
ANZ 2.3% Justice Centre Others 1.0%
Total 100%
Note: All data as at 30 September 2019 and based on portfolio committed NLA.
(1) Tenants with multiple leases were accounted as one tenant.
19Commitment to Sustainability
▪ Attained the Green Star Status and was ranked 6th out of 19 listed office entities in Asia at the
Global Real Estate Sustainability Benchmark (GRESB) 2019
▪ Committed to continue engaging with tenants and have a positive impact on the community
Supporting blood donation Celebrating as a community Promoting healthy living
20Capital Management
▪ All-in interest rate declined for the second consecutive As at 30 Sep 2019
quarter to 2.82% p.a. Interest Coverage Ratio(1) 3.8x
All-in Interest Rate 2.82% p.a.
Debt Maturity Profile Aggregate Leverage 38.9%
(as at 30 Sep 2019) 34% Weighted Average Term to Maturity 3.4 years
$200m
$75m Unencumbered Assets 73%
19%
15% Managing interest rate exposure
11% 10% $855m 11%
$637m $50m
$489m (2)
$352m $375m Sensitivity to SOR
$278m
91% Every 50 bps in SOR
2019 2020 2021 2022 2023 2024 2025 Borrowings on
Fixed Rates translates to
Bank loans $50m 7-year MTN at 3.15%
(Issued in February 2015) ~0.03 cents in DPU
$75m 7-year MTN at 3.275% $200m 5-year convertible bonds at 1.9%
(Issued in April 2017) (Issued in April 2019)
(1) Computed as EBITDA (including share of results of associates and joint ventures) over borrowing costs, after adjusting for non-cash items including but not
limited to management fees paid in Units and fair value changes on derivatives.
(2) Based on the Group’s borrowings including those accounted for at the level of associates, and number of Units in issue as at 30 September 2019.
21Unit Buy-Back Programme
▪ Keppel REIT is the only Singapore REIT with Monthly Unit Buy-Back Volume
an active Unit buy-back program (since initiation of programme until 3Q 2019)
▪ Buying back Units below NAV is accretive to 13.56m
Unitholders and is part of proactive capital
management strategy
7.85m
Total Units Purchased and Cancelled 5.36m 5.80m
4.08m 4.20m
3.50m 3.25m 3.35m
In 3Q 2019 13.6m 2.50m 2.19m
1.78m
Since initiation of Unit buy-back - - -
57.4m
programme in 3Q 2018 till 3Q 2019 Jul Aug Sep Oct Nov Dec Jan Feb Mar Apr May Jun Jul Aug Sep
2018 2019
22Committed to Delivering Stable Income & Sustainable Returns
Portfolio Optimisation
• Ongoing portfolio optimisation to improve yield, while maintaining exposure to
Singapore CBD Portfolio
• Hold quality assets across different markets for improved income stability and Optimisation
to provide more long-term growth opportunities
Asset Performance Asset
• Drive individual asset performance with proactive leasing and cost management Performance
strategies
• Implement initiatives to future proof assets and enhance sustainability
Capital
Capital Efficiency Efficiency
• Optimise capital structure to reduce borrowing costs and improve returns
• Manage debt maturity and hedging profiles to reduce risk
23Additional
Information
David Malcolm Justice Centre,
Perth
24Milestones since Listing
Acquired
Listed on Increased Acquired 87.5% of Acquired 50% of David
SGX Stake in 50% of Ocean Malcolm Justice Centre Acquired Acquired 50% of Expanded footprint to
with over Prudential 8 Chifley Financial in Perth and three retail units at 311 Spencer Street South Korea with
Towers in Square in Centre in 8 Exhibition Street 8 Exhibition Street development in 99.38% of
$600m AUM Singapore Sydney in Melbourne in Melbourne Melbourne T Tower in Seoul
Singapore
2007 2010 2012 2014 2016 2018 2019
$7.9b(1)
2006 2009 2011 2013 2015 2017 AUM
Maiden Increased stake Divested Acquired Divested Divested 20% Announced
Acquisition: Asset swap of to 99.9% for stake in one-third of 77 King Street minority stake in divestment of
One Raffles Expanded footprint to Keppel Towers Ocean Financial Prudential MBFC in Sydney Ocean Financial Bugis Junction
Quay in Australia with and GE Tower Centre in Tower in Tower 3 in Centre in Towers in
Singapore 77 King Street in for one-third of Singapore Singapore Singapore Singapore Singapore
Sydney and 275 George MBFC Phase 1
Street in Brisbane in Singapore
1) Based on assets under management assuming that the divestment of Bugis Junction Towers was completed on 30 September 2019.
25Financial Performance
3Q 2019 3Q 2018 +/(-) 9M 2019 9M 2018 +/(-)
Property Income $42.4 m $36.7 m +15.6% $122.3 m $128.0 m (4.5%) (1)
Net Property Income (NPI) $33.2 m $28.2 m +17.6% $95.5 m $102.6 m (6.9%)
Less: Attributable to Non-controlling Interests ($4.2 m) -* Nm ($12.4 m) -* Nm
NPI Attributable to Unitholders $29.0 m(2) $28.2 m +2.8% $83.1 m(2) $102.6 m (19.0%)
Share of Results of Associates
$28.6 m(3) $25.0 m +14.2% $82.0 m(3) $79.9 m +2.6%
and Joint Ventures
Distribution to Unitholders $47.5 m(4) $46.3 m +2.5% $142.1 m(4) $142.9 m (0.5%)
DPU (cents) 1.40 1.36 +2.9% 4.18 4.20 (0.5%)
* Denotes less than $0.1m
Distribution Timetable (1) The decrease was due mainly to lower one-off income for early surrender of leases.
(2) Reflects amount attributable to Unitholders based on an interest of 79.9% in Ocean Financial Centre
following the divestment of a 20% stake in December 2018, as well as an interest of 99.38% in T Tower
Ex-Date: Wed, 23 Oct 2019
in Seoul which was acquired in May 2019.
(3) Share of results of associates was higher year-on-year due mainly to higher rentals and one-off income.
Books Closure Date: Thu, 24 Oct 2019
Share of results of joint ventures was lower year-on-year due mainly to depreciation of Australian dollar
against Singapore dollar.
Payment Date: Wed, 27 Nov 2019
(4) Includes distribution of capital gains of $2.0 million for 3Q 2019 and $8.0 million for 9M 2019.
26Income Contribution
Breakdown by Geography 9M 2019 % 9M 2018 %
(for 9M 2019)
Ocean Financial Centre(1) 49,413 26.7 73,457 36.2
Marina Bay Financial Centre 63,833 34.6 61,364 30.2
One Raffles Quay 18,432 10.0 19,269 9.5
77.6%
Bugis Junction Towers 11,596 6.3 11,951 5.9
8 Chifley Square 9,632 5.2 9,772 4.8
8 Exhibition Street 9,028 4.9 8,720 4.3
275 George Street 8,291 4.5 8,428 4.2
19.8%
David Malcolm Justice Centre 9,559 5.2 9,897 4.9
2.6%
Singapore Australia South Korea
T Tower(2) 4,757 2.6 - -
Total 184,541 100.0 202,858 100.0
(1) Reflects the amount attributable to Unitholders based on an interest of 79.9% (9M 2018: 99.9%) following the divestment of a 20% stake in
December 2018.
(2) Reflects the amount attributable to Unitholders based on an interest of 99.38% acquired on 27 May 2019.
27Balance Sheet
As at 30 Sep 2019 As at 30 Jun 2019 +/(-)
Deposited Property(1) $8,510 m $8,512 m (0.02%)
Total Assets $7,926 m $7,936 m (0.1%)
Borrowings(2) $3,311 m $3,267 m +1.3%
Total Liabilities $2,720 m $2,684 m +1.3%
Unitholders’ Funds $4,625 m $4,672 m (1.0%)
Adjusted NAV per Unit(3) $1.35 $1.36 (0.7%)
(1) Included interests in associates and joint ventures.
(2) Included borrowings accounted for at the level of associates and excluded the unamortised portion of upfront fees in relation to the borrowings.
(3) For 30 September 2019 and 30 June 2019, these excluded the distributions to be paid in November 2019 and paid in August 2019 respectively.
28Portfolio Information: Singapore
Marina Bay
Ocean Financial Centre One Raffles Quay Bugis Junction Towers(7)
Financial Centre(4)
Attributable NLA 700,323 sf 1,024,988 sf 442,224 sf 248,853 sf
Ownership 79.9% 33.3% 33.3% 100.0%
BNP Paribas, DBS Bank, Deutsche Bank, Enterprise Singapore,
Principal tenants(1) ANZ, Standard Chartered Bank, UBS, InterContinental Hotels
Drew & Napier Barclays Ernst & Young Group, UCommune
99 years expiring
99 years expiring 99 years expiring 99 years expiring
Tenure 10 Oct 2104(5) and
13 Dec 2110 12 Jun 2100 9 Sep 2089
7 Mar 2106(6)
Purchase Price S$1,426.8m(5)
S$1,838.6m(3) S$941.5m S$159.5m
(on acquisition) S$1,248m(6)
S$1,695.3m(5)
Valuation(2) S$2,099.0m S$1,275.6m S$515.0m
S$1,297.0m(6)
3.65%(5)
Capitalisation rates 3.60% 3.65% 3.65%
3.63%(6)
1) On committed gross rent basis.
2) Valuation as at 31 December 2018 based on Keppel REIT’s interest in the respective properties.
3) Based on Keppel REIT’s 79.9% of the historical purchase price.
4) Comprises Marina Bay Financial Centre (MBFC) office Towers 1, 2 and 3 and Marina Bay Link Mall (MBLM).
5) Refers to MBFC Towers 1 and 2 and MBLM.
6) Refers to MBFC Tower 3.
7) The divestment of Bugis Junction Towers was announced on 1 October 2019 and is expected to complete in 4Q 2019. Valuation stated as at 8 August 2019.
29Portfolio Information: Australia & South Korea
8 Chifley Square, 8 Exhibition Street, 275 George Street, David Malcolm 311 Spencer Street, T Tower,
Sydney Melbourne(3) Brisbane Justice Centre, Perth Melbourne Seoul
(Under development)
Attributable NLA 104,070 sf 244,491 sf 244,542 sf 167,784 sf 358,683 sf 226,945 sf
Ownership 50.0% 50.0% 50.0% 50.0% 50.0% 99.38%
Corrs Chambers Ernst & Young, Telstra, Queensland Hankook
Minister for Works -
Westgarth, Amazon, Minister Gas Company, Minister for Finance Corporation, SK
Principal tenants(1) Government of
Quantium, for Finance - State The State of - State of Victoria Communications,
Western Australia
QBE Insurance of Victoria Queensland(6) Philips Korea
99 years expiring 99 years expiring
Tenure Freehold Freehold Freehold Freehold
5 Apr 2105 30 Aug 2114
Purchase Price
S$197.8m S$201.3m(3) S$209.4m S$208.1m S$362.4m(7) S$301.4m(9)
(on acquisition)
Valuation(2) S$249.3m S$271.9m(3) S$232.2m S$221.6m S$233.8m(8) S$309.0m(9,10)
Capitalisation rates 4.88% 5.00%(4); 4.50%(5) 5.25% 5.50% 4.50% 4.50%
1) On committed gross rent basis. 7) Based on the aggregate consideration paid-to-date and to be paid, including
2) Valuation of Australian assets as at 31 December 2018 based on Keppel REIT’s development costs of the building, at the exchange rate of A$1=S$1.042 as
interest in the respective properties and on the exchange rate of A$1 = S$1.0071. disclosed in the announcement dated 29 June 2017.
3) Keppel REIT owns a 50% interest in the 8 Exhibition Street office building and a 8) Based on “as is” valuation as at 31 December 2018.
100% interest in the three adjacent retail units. 9) Based on Keppel REIT’s interest in T Tower and an exchange rate of KRW 1,000 to
4) Refers to Keppel REIT’s 50% interest in the office building. S$1.193 as at 18 April 2019.
5) Refers to Keppel REIT’s 100% interest in the three adjacent retail units. 10) Valuation as at 25 March 2019.
6) Refers to the Department of Housing and Public Works – The State of Queensland.
30Keppel REIT Structure
Keppel Capital Keppel Land
Institutional and
The REIT Manager can leverage
The REIT Manager can leverage Public Investors
the Sponsor‘s expertise and
the scale and resources of a larger 51.7%
asset management platform
4.8% track record in this industry
43.5%
100%
Management Acting on behalf of
services Unitholders
REIT Manager Trustee
Trustee’s
Management fees Keppel REIT fees
Keppel REIT RBC Investor Services Trust
Management Limited Singapore Limited
Ownership of Income
assets contribution
Property
management
services
Property Managers Properties
Property
management fees
Note: As of 30 September 2019.
31Thank You
32You can also read