Hard hit, New York City embraces brave new world of retail
←
→
Page content transcription
If your browser does not render page correctly, please read the page content below
MARKETVIEW

Manhattan Retail, Q2 2020
Hard hit, New York City embraces
brave new world of retail
       Consumer Confidence                       NYC Unemployment   NYC Quarterly Retail Sales            NYC Retail Job Count
       98.1                                      18.3%              $29.1B                                261.8K

*Arrows indicate change from previous quarter.                                                   Sources: The Conference Board, June 2020;
                                                                                                       NYS Department of Labor, May 2020;
                                                                                          U.S. Census Bureau, Oxford Economics, May 2020;
                                                                                                       NYS Department of Labor, May 2020.

  MARKET NEWS

  •    New York City officially began Phase Two of reopening on June 22nd, allowing outdoor dining,
       offices, retail and hair salons to resume services with new social distancing and cleaning
       guidelines. Retailers may now refuse services to those without protective equipment, must keep
       store occupancy below 50% of the maximum allowed by the certificate of occupancy and ensure six
       ft. of distance between people.1
  •    Neiman Marcus Group, Inc., the iconic chain of luxury department stores, filed for Chapter 11
       bankruptcy protection after struggling with accumulated debt and the impact of the COVID-19
       pandemic. The liquidation efforts are to include the recently opened three-story, 250,000 sq. ft.
       flagship at the Shops at Hudson Yards.2
  •    The New York State Legislature passed the NYC COVID-19 Relief Package which incorporates over
       $100 million worth of rent relief and aid to commercial tenants impacted by the COVID-19
       pandemic. The package additionally renders personal liability provisions in commercial leases
       unenforceable, prohibits landlord harassment of impacted commercial tenants, waives sidewalk
       seating consent fees, and limits fees charged by third-party food delivery services.3

MARKET OVERVIEW

As the Manhattan market began to embrace the new realities of the retail business, the city’s fundamentals
continued to be hit hard by the disruptions caused by the COVID-19 pandemic. NYC spent most of Q2 in
lockdown, as did much of the US, with all non-essential businesses closed and a dramatic decline in mobility.
After seeing infections, hospitalizations and death rates swell, the NYC retail market has slowly emerged from
the worst of the virus’ impact. A cautious economic reopening began late in the quarter, with the city moving
from Phase One to Phase Two in late June, which allows for resumption of some non-essential retail and
personal services activities, but with limited indoor capacity, strict social distancing and PPE mandates, and
enhanced cleaning guidelines. Many retailers have embraced the opportunity to partially resume business, but
most are still in survival mode, facing reduced operations, foot traffic and revenue. With office buildings still
largely empty, limited tourists and many residents still holed up or temporarily retreating out of the city, retail
demand in Manhattan is significantly diminished, even as the city entered Phase Three on July 6th.

Leasing velocity in Manhattan experienced significant deceleration in the first half of 2020. Additionally, the
number of direct, ground-floor availabilities experienced a new peak of 235 spaces on the prime 16 retail
corridors in Q2 2020.

Q2 2020 CBRE Research                                                                                       © 2020 CBRE, Inc. |        1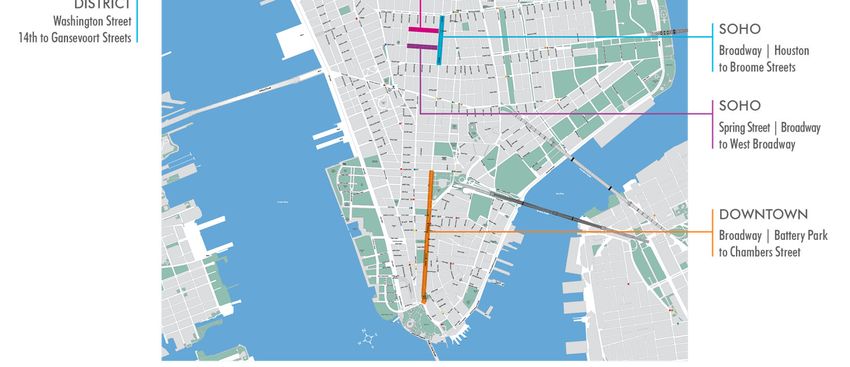
M A R K E T V I E W MANHATTAN RETAIL

Average asking rent declined for the 11th                    By late Q2, rates of new infections and mortality
consecutive quarter, with the average of the                 began to stabilize and then decline in Manhattan,
corridors dropping to $688 per sq. ft., a 11.3% year-        allowing for the gradual reopening of the city’s
over-year decline and 3.6% drop from the prior               economy. Non-essential businesses are now reopened,
quarter. This marks the first time the figure has            but at reduced capacity and with on-going social
dropped below $700 per sq. ft. since 2011. The               distancing and PPE requirements. Over 16,500 of the
ongoing repricing of trophy properties was a                 411,300 furloughed and laid off retail and hospitality
significant factor in the declining average, and with        workers were rehired in May, a small but welcome first
an increasing amount of retail vacancy along the             step toward reducing the NYC unemployment rate,
high-street corridors and the introduction of new,           which was 18.3% as of May 2020.
heavily discounted availabilities, average asking
rents will likely continue to decline through the            While NYC moved into Phase Three of economic
year.                                                        reopening on July 6, the city’s retail market continues
                                                             to face numerous uncertainties. With office buildings
ECONOMIC OVERVIEW                                            still largely empty and limited activity from both
                                                             tourists and residents, retail demand in Manhattan
Virology, not the business cycle, has dictated the           remains significantly diminished. Also, while NYC and
course of the world’s economy this year. COVID-19            the surrounding Tri-State region continue to flatten
forced a nationwide shutdown of most economic                the curve on the virus, much of the US South and West
activity in March, with the largest economic                 are seeing surges in new cases and hospitalizations,
centers, especially the Northeast and Pacific coast,         signaling that the overall US economic recovery,
facing the strictest lockdowns. The economic                 which CBRE had forecast to begin in earnest in Q3
fallout proved severe, pushing unemployment to               2020, may now be delayed and/or weaker than
over 15% and likely causing the economy to                   expected in 2020. This presents a headwind for the
contract by more than 30% per annum in the                   local market, though NYC’s early emergence from the
second quarter.                                              grip of the virus will put its recovery path a few steps
                                                             ahead of other parts of the country.
 Locally, NYC suffered a trifecta of economic
disruption in Q2, as the full impact of the NY’s        Figure 1: NYC Seasonally Adjusted Total Employment
closure of non-essential businesses, ban on large
gatherings and stay-at-home directives unfurled.
                                                                                    5,000
Confined to their homes and facing widespread                                       4,800
                                                        All employees (thousands)

layoffs and income reductions, city residents                                       4,600
refrained from discretionary spending and many                                      4,400
fled the city altogether. The closing of non-                                       4,200
                                                                                    4,000             3,712
essential businesses rendered most of NYC’s office                                          3,555
                                                                                    3,800
buildings closed, dramatically reducing the
                                                                                    3,600
daytime population of regional commuters who                                                                                         3,761
                                                                                    3,400
normally work and spend money in the city. Finally,                                 3,200
with travel restricted, cultural institutions and                                   3,000
entertainment venues closed and tourism to NYC
faltered dramatically, causing quarterly retail sales
in the city to drop nearly 15% to just $33.4B.                                                      Source: NYC Department of Labor, May 2020.

Q2 2020 CBRE Research                                                                                         © 2020 CBRE, Inc. |        2
M A R K E T V I E W MANHATTAN RETAIL
Figure 2: NYC Total Retail Sales | Annual based in Vancouver, announced a 29,000-sq.-ft.
$140 $132 direct lease at the former Dean & Deluca space at
560 Broadway. This lease is said to have a
$120
Billions of $USD forward possession date tied to the expiration of
$100
$83 Artizia’s existing lease on Broadway in 2024.
$80
$60
Times Square, a market driven by large-format
$40
retailers and heavy tourism, had a single large
$20
transaction, the 24,000-sq.-ft. renewal of Chase
$0 Bank on the second floor of 3 Times Square.
Source: US Census Bureau, Oxford Economics, May 2020. Figure 3: Four Quarter Aggregate Leasing Velocity
4.5
LEASING 4.0
Millions of Square Feet
3.5
Retail leasing velocity maintained its downward 3.0
momentum in Manhattan during the second 2.5
2.0
quarter of 2020. The rolling four-quarter aggregate
1.5
leasing velocity, which measures the total leasing
1.0
(renewals and new leases) for the four prior 0.5
quarters, significantly decelerated for the fourth 0.0
Q1 2017
Q2 2017
Q3 2017
Q4 2017
Q1 2018
Q2 2018
Q3 2018
Q4 2018
Q1 2019
Q2 2019
Q3 2019
Q4 2019
Q1 2020
Q2 2020
consecutive quarter due to impact of the COVID-
19 pandemic. In Q2 2020, the rolling aggregate
total velocity was just below 3.1 million sq. ft.,
Source: CBRE Research Q2 2020
down 16.5% from the nearly 3.7 million sq. ft. for
Q1 2020 and 24.3% from a year prior. While the
Figure 4: Rolling Four-Quarter Aggregate Total Leasing Velocity
downward trend is expected to continue through
the latter half of 2020, the figure for Q2 remained Period 12 Month Aggregate (Sq. Ft.)
8.9% ahead of the totals seen in the early parts of Q1 2017 2,831,971
2017.4
Q2 2017 3,248,727
Q3 2017 3,333,980
Upper East Side recorded the highest leasing
velocity in Q2 2020 with nearly 63,000 sq. ft. leased Q4 2017 3,236,754
across two transactions. The bulk was attributed Q1 2018 3,472,121
to the 55,000-sq.-ft., multi-level lease signed by Q2 2018 3,317,151
Target at 150 East 86th Street. Barry’s, a boutique Q3 2018 3,496,024
fitness brand offering high-intensity interval Q4 2018 3,807,460
workouts (and formerly known as Barry’s
Q1 2019 3,844,665
Bootcamp), also secured a new 7,700-sq.-ft.
Q2 2019 4,071,420
outpost a block east at 241 East 86th Street.
Q3 2019 3,888,402
NoLIta also registered a high leasing volume with Q4 2019 3,811,549
roughly 30,000 sq. ft. from a single transaction. Q1 2020 3,693,385
Aritzia Inc., an upscale women’s fashion brand Q2 2020 3,083,749
Source: CBRE Research Q2 2020
Q2 2020 CBRE Research © 2020 CBRE, Inc. | 3M A R K E T V I E W MANHATTAN RETAIL
Financial services was the most active industry in In addition to the aforementioned Chase renewal
Q2 2020, both in terms of square footage leased in Times Square, the Charles Schwab Corporation
and transaction count, surpassing Food and signed two deals, a new 13,000-sq.-ft. outpost at
Beverage as the most active category in the market. 915 Broadway and a 10,000-sq.-ft. renewal at 60
Financial services tenants secured nearly 62,000 sq. East 42nd Street.
ft. across six leases.
Figure 5: Most Active Neighborhoods by Sq. Ft. Leased | Q2 2020 Figure 6: Most Active Tenant Type by Sq. Ft. Leased | Q2 2020
Leased Leased
Neighborhood Number of deals Tenant Type Number of deals
(Sq. Ft.) (Sq. Ft.)
Upper East Side 2 62,782 Financial Services 6 61,969
NoLIta 1 29,431 Department Store 1 55,000
Times Square 1 24,101 Apparel 3 33,081
Chelsea 2 13,680 Food & Beverage 2 13,800
Flatiron/Union Square 1 12,699 Internet Related 1 8,200
Grand Central 1 10,702 Health Club 1 7,782
SoHo 2 10,300 Grocery 1 6,000
Plaza District 1 7,200 Consumables 1 2,680
Manhattan North 1 6,000 Jewelry 1 1,000
Little Italy/Chinatown 1 4,880 TOTAL 17 189,512
Source: CBRE Research, Q2 2020. Source: CBRE Research, Q2 2020.
Figure 7: Top Lease Transactions | Q2 2020
Tenant Size (Sq. Ft.) Address Neighborhood Tenant Type
Target 55,000 150 East 86th Street Upper East Side Department Store
Aritzia Inc. 29,431 560 Broadway NoLIta Apparel
Chase Bank 24,101 3 Times Square Times Square Financial Services
Charles Schwab Corporation 12,699 915 Broadway Flatiron/Union Square Financial Services
Hill Country Barbecue Market 11,000 30 West 26th Street Chelsea Food & Beverage
Charles Schwab Corporation 10,702 60 East 42nd Street Grand Central Financial Services
Barry’s 7,782 241 East 86th Street Upper East Side Health Club
312 Food Corp. 6,000 538 West 181st Street Manhattan North Grocery
Chipotle 2,800 885 Tenth Avenue Midtown West Food & Beverage
Wine Store 2,680 238 Seventh Avenue Chelsea Consumables
Source: CBRE Research, Q2 2020.
Q2 2020 CBRE Research © 2020 CBRE, Inc. | 4M A R K E T V I E W MANHATTAN RETAIL
AVAILABILITY AVERAGE ASKING RENTS
The count of direct ground-floor availabilities Manhattan’s declining average asking rent
tracked across Manhattan’s 16 premier persisted through the second quarter of 2020,
shopping corridors increased from 226 to 235 falling to $688 per sq. ft. This was a 3.6% decline
quarter-over-quarter, a 4% jump and a new high from Q1 2020 and 11.3% drop from the prior year.
watermark surpassing the previous peak of Average rents dipped below $700 per sq. ft. to
nearly 230 spaces recorded in 2018. reach a level not seen since the third quarter of
2011. The aggregate average asking rent among all
Downtown Broadway saw the largest rise in available spaces in the 16 corridors also decreased
availability over the past 12 months, with a 47% 5.4% quarter-over-quarter and 8.1% year-over-year
increase from 19 to 28 ground floor spaces. to $633 per sq. ft.
Among these new additions were the former
Chase space at 270 Broadway, a space The 37.5% annual decline on Prince Street in
previously occupied by Modell’s at 150 SoHo was the largest percentage decrease among
Broadway, and the now vacant store at 174 the corridors. Asking rents fell from $699 per sq.
Broadway last occupied by The Vitamin ft. to $437 per sq. ft. year-over-year, dipping below
Shoppe. $500 per sq. ft. for the first time since 2014. The
drop was caused by three factors. First, several
Upper Madison Avenue also saw a significant small format transactions in the higher-priced
annual spike in availabilities, from 37 to 44. spaces of the street including TAFT and Marc
Dwindling demand for the upper parts of the Jacobs contributed to some of the sharp decline in
avenue kept supply high in this corridor and pricing. Additionally, ongoing downward repricing
also led to some agency changes for lingering persisted in SoHo, and the introduction of several
available spaces new spaces with asking rents in the high to mid-
$300 per sq. ft. range exacerbated the decline.
Figure 8: Count of Direct Ground-Floor Availabilities Broadway in SoHo also saw a large annual decline
in average asking rents, falling 30.1% year-over-
250
year and 4.9% quarter-over-quarter to $399 per sq.
# of Direct Ground Floor Availabilities
ft. Rents on the corridor dropped below $400 per
200
sq. ft. for the first time since tracking began in
150 2010. While several new leases signed by Aritzia
Inc., Hugo Boss, and PacSun recently brought new
100 life to the stagnant submarket, the prolonged
downward repricing, along with the addition of
50 several new spaces with sub-$300 per sq. ft. asking
rents, maintained the pressure on pricing along
0
the corridor in the second quarter.
2019 Q2
2019 Q3
2019 Q4
2020 Q1
2020 Q2
Source: CBRE Research, Q2 2020.
Q2 2020 CBRE Research © 2020 CBRE, Inc. | 5M A R K E T V I E W MANHATTAN RETAIL
The corridor along 34th Street in Herald Square Figure 9: Year-over-Year Asking Rent Change
witnessed a substantial 19.9% annual decline,
40.0%
from $607 per sq. ft. to $486 per sq. ft. The
quarterly reduction of 2.9%, drove average rents 30.0%
below $500 per sq. ft. for the first time since 20.0%
2011. Although a flurry of significant 10.0%
transactions in the higher-priced sections of the
0.0%
corridor contributed to some leasing activity in
the last 12 months, inventory stagnation and the -10.0%
ongoing uncertainties surrounding the future of -20.0%
2012 Q2
2013 Q2
2014 Q2
2015 Q2
2016 Q2
2017 Q2
2018 Q2
2019 Q2
2020 Q2
Macy’s continued to put downward pressure on
rents in this major retail submarket.
Source: CBRE Research, Q2 2020.
Meatpacking District’s 14th Street corridor was a
bright spot for Manhattan retail in the second Figure 10: Average of Corridors
quarter. The average asking rent modestly
$1,200
Avg. Asking Rent $ per Sq. Ft.
increased 3.9% quarter-over-quarter to $345 per
$1,000
sq. ft. Several of the lowest-priced spaces on
14th Street were leased by Fjallraven and USPS, $800
resulting in the modest climb in asking rents $600
and demand in the submarket.
$400
$200
Broadway on the Upper West Side also recorded
an increase in average asking rent, reaching $0 2012 Q2
2013 Q2
2014 Q2
2015 Q2
2016 Q2
2017 Q2
2018 Q1
2019 Q2
2020 Q2
$243 per sq. ft., up 3.3% quarterly but still 8.2%
below the rate recorded a year prior. In contrast
to the aforementioned 14th Street, the addition
Source: CBRE Research, Q2 2020.
of new spaces in the highest-priced sections of
the market, such as Papyrus and Stuart
Weitzman’s former locations at 2151 Broadway,
was the main driver of this slight quarterly
increase.
Q2 2020 CBRE Research © 2020 CBRE, Inc. | 6M A R K E T V I E W MANHATTAN RETAIL
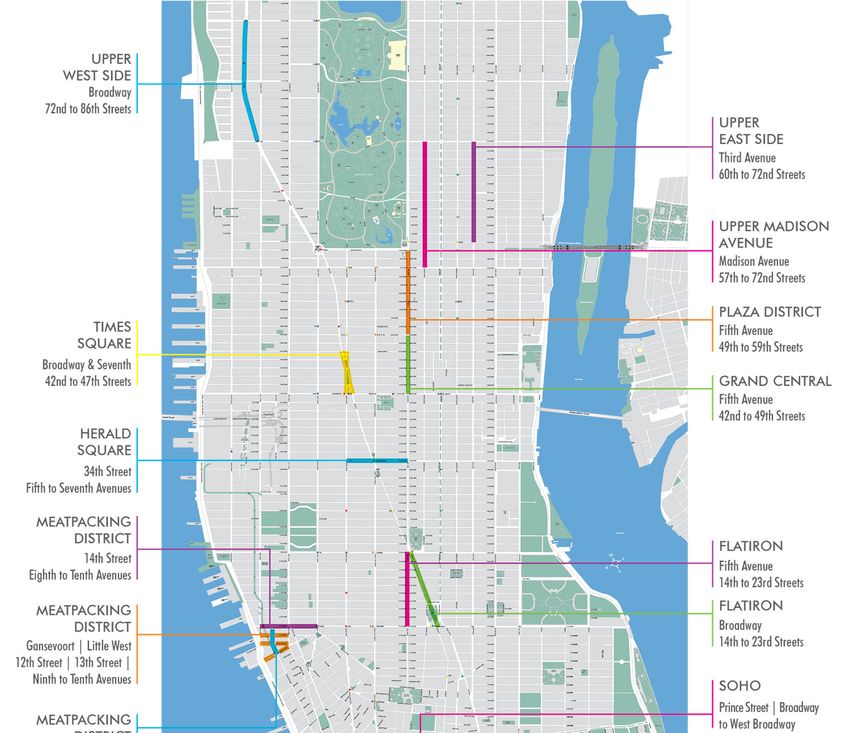
Figure 11: Average Asking Rents* | Q2 2020
Total direct
ground floor Quarter-over- Year-over-year
Neighborhood Corridor Parameters Q2 2020 Q1 2020 Q2 2019
availabilities quarter change change
Q2 2020
Upper West Side Broadway | 72nd to 86th Streets 20 $243 $236 3.3% $265 (8.2%)
Upper East Side Third Avenue | 60th to 72nd Streets 17 $206 $221 (6.5%) $231 (10.6%)
Madison Avenue | 57th to 72nd
Upper Madison Ave 44 $882 $920 (4.1%) $1,042 (15.3%)
Streets
Plaza District Fifth Avenue | 49th to 59th Streets** 10 $3,000 $3,000 0.0% $3,150 (4.8%)
Grand Central** Fifth Avenue | 42nd to 49th Streets 9 $753 $774 (2.6%) $812 (7.2%)
Broadway & Seventh Avenue | 42nd to
Times Square 10 $1,647 $1,647 0.0% $1,880 (12.4%)
47th Streets
Herald Square** 34th Street | Fifth to Seventh Avenues 8 $486 $500 (2.9%) $607 (19.9%)
Flatiron/Union Square Broadway | 14th to 23rd Streets 12 $357 $362 (1.6%) $384 (7.3%)
Flatiron/Union Square Fifth Avenue | 14th to 23rd Streets 11 $334 $338 (0.9%) $372 (10.2%)
SoHo Broadway | Houston to Broome Streets 21 $399 $420 (4.9%) $571 (30.1%)
Prince Street | Broadway to West
SoHo 6 $437 $683 (36.1%) $699 (37.5%)
Broadway
Spring Street | Broadway to West
SoHo 8 $631 $644 (1.9%) $702 (10.1%)
Broadway
Meatpacking 14th Street | Eighth to Tenth Avenues 14 $345 $332 3.9% $367 (6.1%)
Gansevoort | Little West 12th Street |
Meatpacking 14 $378 $376 0.5% $375 0.8%
13th Street | Ninth to Tenth Avenues
Washington Street | 14th to
Meatpacking 3 $503 $575 (12.5%) $550 (8.5%)
Gansevoort Streets
Broadway | Battery Park to Chambers
Downtown 28 $410 $401 2.3% $409 0.4%
Street
All Average of corridors - $688 $714 (3.6%) $776 (11.3%)
Quarter-over- Year-over-year
Total direct ground floor availabilities Q2 2020 Q2 2020 Q1 2020 Q2 2019
quarter change change
Aggregate Average Asking Rent** 235 $633 $669 (5.4%) $689 (8.1%)
*Based on ground floor only, not inclusive of subleases.
**Historic Average Asking Rent data has been revised since original publication due to updated information. Source: CBRE Research, Q2 2020.
Q2 2020 CBRE Research © 2020 CBRE, Inc. | 7M A R K E T V I E W MANHATTAN RETAIL RETAIL CORRIDORS Q2 2020 CBRE Research © 2020 CBRE, Inc. | 8
M A R K E T V I E W MANHATTAN RETAIL

                                                                                   SOURCES
DEFINITIONS

Availability — Direct space that is actively marketed; includes spaces for         1.     https://www1.nyc.gov/nycbusiness/article/reopening-
immediate and future occupancy.                                                           guide#phasetwo
Asking Rent — Average asking rent calculated using the straight line               2.     https://www.cnbc.com/2020/05/07/neiman-marcus-files-for-
average for direct ground-floor spaces that have street frontage along                    bankruptcy.html#:~:text=on%20the%20Street-
one of the 16 corridors tracked by CBRE. Does not include sublease                        ,Neiman%20Marcus%2C%20saddled%20with%20debt%20and%2
space.
                                                                                          0hit%20by%20the%20coronavirus,dwindling%20cash%20before%
Aggregate Average Asking Rent —The straight-line average of all direct,                   20the%20outbreak.
ground-floor availabilities with corridor frontage.                                3.     https://commercialobserver.com/2020/05/ny-approves-100m-rent-
Average of Corridors — The average rent for the 16 main retail corridors                  voucher-bill-coronavirus-tenants/
tracked by CBRE. This is calculated by taking the average of the 16                4.     The Q2 2020 rolling four-quarter aggregate total leasing velocity was
corridor averages for the quarter.
                                                                                          revised since original publication, based on the availability of
Leasing Velocity — Total amount of square feet leased within a specified                  additional leasing data.
period of time, including pre-leasing and renewals.
Rent Changes – Percentage changes to asking rents that are less than
1% are reported as flat or virtually unchanged. Rent changes greater
than 1% are reported as either increases or decreases.
Rolling Four-Quarter Aggregate Total Leasing Velocity - This metric is
calculated as the sum of total leasing velocity for the previous four
quarters. For example, the rolling aggregate for Q2 2020 includes total
leasing velocity over Q1 2020, Q4 2019, Q3 2019 and Q2 2019. The
rolling four-quarter aggregate figure helps track momentum in leasing
velocity while controlling for the normal up and down variations seen
between quarterly leasing totals. The aggregate data lags by one quarter,
to allow time for complete data collection of closed deals.
Total Available Spaces — Based on available ground-floor space with
street frontage that faces one of the 16 corridors tracked by CBRE.
CONTACTS

Nicole LaRusso
Director, Research & Analysis
+1 212 984 7188
Nicole.LaRusso@cbre.com

Michael Slattery
Field Research Manager
+1 212 656 0583
Michael.Slattery@cbre.com

Hironori Imaizumi
Field Research Analyst
+1 212 656 0538
Hiro.Imaizumi@cbre.com

To learn more about CBRE Research, or to access additional research reports, please visit
the Global Research Gateway at: www.cbre.com/researchgateway.

Disclaimer: Information contained herein, including projections, has been obtained from sources believed to be reliable. While we do not doubt its accuracy,
we have not verified it and make no guarantee, warranty or representation about it. It is your responsibility to confirm independently its accuracy and completeness.
This information is presented exclusively for use by CBRE clients and professionals and all rights to the material are reserved and cannot be reproduced without prior
written permission of CBRE.
You can also read