ISE Industry Forum CSISG 2020 Q1 Results Announcement - RETAIL & INFO-COMMUNICATIONS - SMU
←
→
Page content transcription
If your browser does not render page correctly, please read the page content below

ISE Industry Forum
CSISG 2020 Q1 Results Announcement

RETAIL & INFO-COMMUNICATIONS

CSISG METHODOLOGY
How Well Did Companies Satisfy Their Customers?
The CSISG Score

                              Customer
                             Satisfaction
                                CSISG
                           (Scale of 0-100)

                        1. Overall Satisfaction
                    2. Ability to Meet Expectations
                         3. Similarity to Ideal

                                                      !3
CSISG Structural Model (For Retail & Infocomm)
   Perceived Product Quality
   Perceived Product Customisation
   Perceived Product Reliability

          Perceived
       Product Quality                                                                                      Complaint Behaviour
                                         Perceived
                                       Overall Quality                                                          Customer
                                         (After Recent
                                          Experience)                                                          Complaints
          Perceived
        Service Quality

   Perceived Service Quality
   Perceived Service Customisation            Price / Quality    Perceived           Customer
   Perceived Service Reliability              Quality / Price      Value            Satisfaction

                                         Customer                            Overall Satisfaction
                                                                             Ability to Meet Expectations
                                        Expectations
                                                                             Similarity to Ideal
                                       (Predicted Quality                                                         Customer
                                         Before Recent                                                             Loyalty
                                          Experience)

                                     Predicted Overall Quality                                               Repurchase Intention
                                     Predicted Customisation                                                 Price Tolerance
                                     Predicted Reliability
                                                                                                                                    !4
General CSISG Fieldwork Methodology
                (For Info-communication Sector Local Respondents)
                Singapore citizens and PRs were interviewed at their homes.
                Homes are selected from a random address listing that matches the housing
                profile of Singapore resident population.

                (For Wireless@SG Sub-sector Tourist Respondents only)
                Departing tourists were interviewed at Changi Airport.

                (For Retail Sector Local Respondents)
                Singapore citizens and PRs were asked to complete an online survey.
                Respondents were randomly selected from a nationally representative online
                panel.

                Each respondent answers up to 21 CSISG questions and about 25 industry-
                specific attribute/touchpoint questions about the company/brand they had
                recent experiences with. Each respondent evaluates only 1 company/brand.

                Typically 50-200 respondents per company would have answered the CSISG
                questionnaire.
                                                                                             !5
Overview of Score Calculation

                1                       2                   3                      4
           Company               Sub-Sector                                   National
                                                     Sector Score
            Score                  Score                                       Score

          Local & Tourist           Company
                                                       Revenue / GDP Contribution Weights
             Weights                 Weights

                                                             Revenue Share Study /
                    Incidence Study
                                                                DOS GDP Data
        •Identify companies with highest            •Identify revenue contribution of each
         interactions with locals and tourists.      sub-sector to its respective sector.
        •Locals surveyed door-to-door.              •Identify GDP contribution of each sector
        •Tourists surveyed at Changi Airport.        to the total GDP of sectors measured in
        •DOS population and STB Visitor Arrival      the CSISG.
         data used to further identify proportion
         of locals and tourist customers.                                                       !6
CSISG 2020 Q1 Sub-sectors

       Info-Communications Sector                                 Retail Sector*
       • Mobile Telecom                                           • Department Stores
       • Broadband                                                • Supermarkets
       • PayTV                                                    • Fashion Apparels
       • Wireless@SG                                              • e-Commerce

         * Note: Data collection for Retail sector done online with locals only, as opposed to face-to-face
         interviews with both locals and tourists in 2019. No change in methodology for Infocomm Sector.
                                                                                                              !7
CSISG 2020 Q1 Quick Facts

                       Sectors Covered    Retail
                                          Info-Communications
                         Survey Period    Feb to Apr 2020
        Total Questionnaires Completed    4,479
                 Face-to-Face (Locals)    1,804

             Tourists at Changi Airport   96

                        Online (Locals)   2,579

             Distinct entities measured   77
         Entities with published scores   36
                                                                !8
CSISG 2020 Q1 RESULTS
How Well Did Companies Satisfy Their Customers?
CSISG 2020 Q1 Results Overview

                                                                                                                                       QUALIFIER FOR RESPONDENT
                                                                                                                                       (1) Recently interacted with companies/
                                                                                                                                           brands (Past 3 months)
                                                                                                                                       (2) Each respondent evaluates
                                                                                                                                           satisfaction with 1 to 2 companies/
                                                                                                                                           brands from different sectors
                        * Refers to companies/sub-sectors that are statistically significantly above their sub-sector/sector scores

        Note: Entities shown in this scorecard have samples of N≥50. For Fashion Apparels, due to the fragmented nature of the sub-sector, entities shown have N≥30.             !10
CSISG 2020 Q1 RESULTS INFO-COMMUNICATIONS SECTOR
Info-Communications Sector CSISG Trends                                                                      Info-Comms Sector

     75                                                                75
          Mobile Telecom                                                    Broadband
                                                             ◼
                                                                                                                           ◼
     65                                                                65

     55                                                                55
      2007                                             2020

                                                                       75
          PayTV                                                             Wireless@SG                                    ◼
                                                             ◼

                                                                       65

                                                                       55

                  ▲▼ Statistically significant increase/drop between the 2020 and 2019 scores at 90% confidence
                                                                                                                                 !12
                   ◼ No statistically significant change between the 2020 and 2019 scores at 90% confidence
Infocomm: Marginal Decline in Various CSISG Dimensions
Product
Quality
Perceived
Complaints
Customer
Quality
Service
Quality
Perceived
Perceived
CSISG Expectations Quality Perceived Value CSISG
Value
(Predicted Quality
Customer (After Recent
Before Recent
Customer
Expectations Loyalty
Experience)
Experience)
Mobile Telecom 75.0 75.6 76.5 71.7
(+0.7%) (-1.9%) (-1.4%) (-1.4%)
Broadband 72.2 74.7 75.5 70.1
(-0.9%) (-0.5%) (-0.8%) (-0.8%)
PayTV 72.2 74.7 75.2 70.6
(-0.4%) (-0.9%) (-0.6%) (+0.5%)
▲▼ Statistically significant year-on-year increase/drop at 90% confidence
◼ No statistically significant year-on-year change at 90% confidence !13Decline in Service Quality for Mobile Telecom
Product
Quality
Perceived Perceived Perceived Perceived
Quality
Service Product Quality Service Quality Quality
Quality
Mobile Telecom 75.6 75.6 ▼ 75.6
(-0.7%) (-3.2%) (-1.9%)
Broadband 75.1 74.3 74.7
(+0.9%) (-2.0%) (-0.5%)
PayTV 74.8 74.7 74.7
(0.0%) (-1.8%) (-0.9%)
▲▼ Statistically significant year-on-year increase/drop at 90% confidence
◼ No statistically significant year-on-year change at 90% confidence !14ASSESSING THE IMPACT OF COVID-19 ON THE DATA
Telecommuting Started Early February 2020 Due To Coronavirus

                                                                                        Source: https://www.channelnewsasia.com/news/singapore/coronavirus-work-from-home-blow-to-businesses-cbd-
                                                                                        singapore-12427002

Source: https://www.straitstimes.com/singapore/coronavirus-business-continuity-plans-
kick-in-for-companies-following-code-orange-alert

                                                                                                                                                                                                    !16
62
66
69
73
76
80
3 W
Fe eek
b
to 1 t
16 o 2
Fe
b
17 We
Fe ek
b 3t
to o
1 4
M
ar
2 W
M eek
ar
to 5 t
15 o 6
M
ar
16 W
M eek
ar 7
Mobile Telecom
to to
29 8
(Bi-Weekly Trend)
M
ar
30 Wee
M k9
ar
to to 1
9 0
Ap
r 72.7
2019
Score:
CSISG
78.1
2019
Score:
Quality
Service
Perceived
3 W
Fe eek
b
to 1 t
16 o 2
Fe
b
17 We
Fe ek
b 3t
to o
1 4
M
ar
2 W
M eek
ar
to 5 t
15 o 6
M
ar
Info-Communications Sub-Sector Scores
16 W
Broadband
M eek
ar 7
to to
29 8
M
ar
30 Wee
M k9
ar
to to 1
9 0
Ap
r
70.6
2019
Score:
CSISG
75.8
2019
Score:
Quality
Service
Perceived
3 W
Fe eek
b
to 1 t
16 o 2
Fe
b
CSISG
17 We
Fe ek
b 3t
to o
1 4
M
ar
2 W
M eek
ar
to 5 t
15 o 6
M
PayTV
ar
16 W
M eek
ar 7
to to
29 8
M
ar
30 Wee
M k9
ar
to to 1
9 0
Ap
r
!17
Perceived Service Quality
70.2
2019
Score:
CSISG
76.0
2019
Score:
Quality
Service
Perceived62
66
69
73
76
80
3 W
Fe eek
b
to 1 t
16 o 2
Fe
b
17 We
Fe ek
b 3t
to o
1 4
M
ar
2 W
M eek
ar
to 5 t
15 o 6
M
ar
16 W
M eek
ar 7
Mobile Telecom
to to
29 8
(Bi-Weekly Trend)
M
ar
30 Wee
M k9
ar
to to 1
9 0
Ap
r 72.7
2019
Score:
CSISG
78.1
2019
Score:
Quality
Service
Perceived
3 W
Fe eek
b
to 1 t
16 o 2
Fe
b
17 We
Fe ek
b 3t
to o
1 4
M
ar
2 W
M eek
ar
to 5 t
15 o 6
M
ar
16 W
Broadband
M eek
ar 7
to to
29 8
M
ar
30 Wee
M k9
ar
to to 1
9 0
Ap
r
70.6
2019
Score:
CSISG
75.8
2019
Score:
Quality
Service
Perceived
3 W
Fe eek
b
to 1 t
16 o 2
Fe
b
CSISG
17 We
Fe ek
b 3t
to o
1 4
M
ar
2 W
M eek
ar
to 5 t
15 o 6
M
PayTV
ar
16 W
M eek
ar 7
to to
29 8
M
ar
30 Wee
M k9
ar
to to 1
9 0
Ap
r
Mobile & PayTV: Perceived Service Quality Lower than 2019 Across the Period
!18
Perceived Service Quality
70.2
2019
Score:
CSISG
76.0
2019
Score:
Quality
Service
Perceived62
66
69
73
76
80
3 W
Fe eek
b
to 1 t
16 o 2
Fe
b
17 We
Fe ek
b 3t
to o
1 4
M
ar
2 W
M eek
ar
to 5 t
15 o 6
M
ar
16 W
M eek
ar 7
Mobile Telecom
to to
29 8
(Bi-Weekly Trend)
M
ar
30 Wee
M k9
ar
to to 1
9 0
Ap
r 72.7
2019
Score:
CSISG
78.1
2019
Score:
Quality
Service
Perceived
3 W
Fe eek
b
to 1 t
16 o 2
Fe
b
17 We
Fe ek
b 3t
to o
1 4
M
ar
2 W
M eek
ar
to 5 t
15 o 6
M
ar
16 W
Broadband
M eek
ar 7
to to
29 8
M
ar
30 Wee
M k9
ar
to to 1
9 0
Ap
r
70.6
2019
Score:
CSISG
75.8
2019
Score:
Quality
Service
Perceived
3 W
Fe eek
b
to 1 t
16 o 2
Fe
b
CSISG
17 We
Fe ek
b 3t
to o
1 4
M
ar
2 W
M eek
ar
to 5 t
15 o 6
M
PayTV
ar
16 W
M eek
ar 7
to to
29 8
M
ar
30 Wee
M k9
ar
Broadband: Declining Trend in Perceived Service Quality Pre-Circuit Breaker
to to 1
9 0
Ap
r
!19
Perceived Service Quality
70.2
2019
Score:
CSISG
76.0
2019
Score:
Quality
Service
PerceivedPERFORMANCE
Decline in Singtel Mobile’s CSISG Scores
(Mobile Telecom)
                                                                75                                 72.7
                               CSISG   CSISG                         Mobile Telecom                         71.7
                               2019    2020
                                                                65

                                                                             2007
                                                                      Info-Communications Sector
                                                                55
                                                                2007                                2020
               Singtel Mobile 75.2

              StarHub Mobile 71.9         72.1 StarHub Mobile
                                          71.6 M1 Mobile
                                          71.5 Singtel Mobile

                   M1 Mobile 69.7

                                                                                                          !21
Marginal Movements Across Companies
(Broadband)
75 72.7
CSISG CSISG Broadband
2019 2020 70.1
65
Info-Communications Sector
55
2007 2020
StarHub Broadband 70.9 70.9 Singtel Broadband
M1 Broadband 70.9
Singtel Broadband 70.2 70.3 M1 Broadband
69.2 StarHub Broadband
!22Marginal Movements Across Companies
(PayTV)
75 72.7
PayTV
CSISG CSISG 70.6
2019 2020
65
Info-Communications Sector
55
2007 2020
70.9 StarHub PayTV
StarHub PayTV 70.7
70.2 Singtel PayTV
Singtel PayTV 69.7
!23Mobile Telecom Attributes - YOY Movements
2020 Avg Rating
Network reliability of local mobile data
Mobile data speed Product-
Network coverage Related
Range of subscription plans to meet your needs Attributes
Network reliability of local voice calls
Descending Provides prompt service
Order Of Products and services are clear and easy to understand
Attributes
Ratings Provides efficient service
Good reputation
Loyalty & rewards program
Proactively helps you when needed Service-
Makes the effort to understand your needs Related
Makes you feel assured that your needs will be taken care of ▼ Attributes
Innovative and forward-looking ▼
▲▼ Statistically significant
Has your best interest at heart ▼ increase/drop between the
2020 and 2019 scores at
7.0 7.6 8.2 90% confidence
Attribute Rating (Scale of 1 to 10) !24MVNOs: Propositions Targeted At Data, Pain Points & Value-Added Services
Circles.Life Zero1
Customer Unlimited Vivifi
Experience Data Data
Sharing
redONE Grid Mobile
Roaming Rebates &
Cashback
Source: Respective telcos’ websites !25Broadband Attributes - YOY Movements
2020 Avg Rating
Range of subscription plans to meet your needs
Product-
Network reliability Related
Internet data speed
Attributes
Innovative and forward-looking
Makes the effort to understand your needs
Descending
Order Of Loyalty & rewards program
Attributes
Ratings Products and services are clear and easy to understand
Good reputation
Provides efficient service ▼
Proactively helps you when needed
Service-
Related
Provides prompt service ▼ Attributes
Has your best interest at heart ▼
▲▼ Statistically significant
Makes you feel assured that your needs will be taken care of ▼ increase/drop between the
2020 and 2019 scores at
7.0 7.6 8.2 90% confidence
Attribute Rating (Scale of 1 to 10) !26PayTV Attributes - YOY Movements
2020 Avg Rating
Transmission quality Product-
Variety of channels that interest you Related
Attributes
Provides prompt service
Loyalty & rewards program
Provides efficient service
Descending
Order Of Range of channel packages to meet your needs
Attributes
Ratings Products and services are clear and easy to understand
Innovative and forward-looking ▼
Makes you feel assured that your needs will be taken care of
Good reputation ▼
Service-
Related
Proactively helps you when needed ▼ Attributes
Has your best interest at heart ▼
▲▼ Statistically significant
Makes the effort to understand your needs ▼ increase/drop between the
2020 and 2019 scores at
7.0 7.6 8.2 90% confidence
Attribute Rating (Scale of 1 to 10) !27Top 3 Drivers of Quality Are Service-Related Attributes
(Infocomm: Top 3 Attributes With Impact On Quality)
Mobile Telecom Avg Rating of Subsector's Attributes
Service Provides prompt service
Service Has your best interest at heart ▼ Increasing
Impact
Service Makes you feel assured that your needs will be taken care of ▼
Broadband
Service Has your best interest at heart ▼
Increasing
Service Makes you feel assured that your needs will be taken care of ▼ Impact
Service Products and services are clear and easy to understand
PayTV
Service Makes the effort to understand your needs ▼
Increasing
Service Provides prompt service Impact
Service Provides efficient service
!28Selected Negative Comments Regarding Service
(Infocomm: Top 3 Attributes With Impact On Quality)
“Staff was not responsive and lack of knowledge at the counter,
Mobile Telecom waiting time to get
Avg Rating attended Attributes
of Subsector's was very long too..”
Service Provides prompt service
“Found a hidden charge on my bill and staff was unable or not
Service interested to help▼me settle when I called in for assistance”
Increasing
Has your best interest at heart
Impact
Service Makes you feel assured that your needs will be taken care of “Waited for very long to▼get connected to the phone staff.”
“Technical support was not clear when explaining to me on the
Broadband
line, have problem understanding and they mentioned that there
Service Has your best interest at heart is charge if I ask them
▼ to visit my house to solve the issue for me
which I think is very unfair to me…"
Increasing
Service Makes you feel assured that your needs will be taken care of ▼ Impact
“There are more frequent breakdowns and they take quite long to
Service Products and services are clear and easy to understand resolve the matter. Staff on the phone need to be more patient
when assisting as I called in to enquire on their faults"
PayTV
“Feel that they are not improving their services in terms of
Service Makes the effort to understand your needs channels and shows.▼They need to have more channels and
shows to stay competitive as the price is getting more expensive
yet services are not improving Increasing
Service Provides prompt service Impact
“Feel that they don’t value us customers, need to wait very long
Service Provides efficient service to get connected to the phone operator who was rude and
impatient…” !29CUSTOMER LOYALTY
Infocomm Landscape: “Price/Data Wars” Continues
(Timeline of New Infocomm Product & Service Launches)
Shut down of 2G network Singtel
Singtel SIM Only Plan 10+10GB
Launched new LVL UP Singtel StarHub
M1 StarHub
plan for youths Launch of Combo XO Plan Streamlined from 10 mobile plans to 3
Launched new mySIMe plans Launched Giga!
StarHub Launched mobile leasing Confirmed move from cable to fibre networks StarHub
Circles.Life plans M1
Confirmed loss of M1 Launched SmartSupport
Introduced Circles Switch for
Discovery channels Circles.Life Boosted network speed to 1Gbps Simplified mobile offering Lite, a mobile phone after-
customers to try out their with one base plan
M1 Launched $0 Flexi Plan Made digital eSIM available on iPhone sales care service for no-
services for a limited time
Launched new prepaid offering 1GB Data with no TPG Grid Mobile & redOne contract SIM Only customers
Zero Mobile strings attached Launched in Singapore
roaming plans Launched free service trial
Entry to market
2017 Q1 2017 Q2 2017 Q3 2017 Q4 2018 Q1 2018 Q2 2018 Q3 2018 Q4 2019 Q1 2019 Q2 2019 Q3 2019 Q4 2020 Q1
Singtel Singtel StarHub
Upgraded Combo 3, 6 & 12 with Obtained rights to carry full Launched brand-new
unlimited talk time and SMS Discovery channel suite OTT pack Go Max
Circles.Life Singtel
Launched DATA X INFINITY at ViViFi
Launched $3 Unlimited Data Launch of GOMO
$39.90/month Launched in Singapore
Singtel on Demand and Unlimited Cut add-on price for unlimited data to $29.90/
Launched 800Mbps mobile data
Launched 450Mbps mobile WhatsApp Roaming month
speeds at selected high traffic
data speed for all 4G users Zero1 Launched 3 new XO postpaid plans StarHub
outdoor spots
M1 Entry to market Expanded entertainment line-up with HBO GO Launched HomeHub Plus
M1
Launched M1 Mobile Sports StarHub Bundle featuring all-in-one
Launched unlimited data 4G
Launched ASEAN & Asia Launched 50GB worry-free data add-on for broadband, TV entertainment
mobile plan (mySIM3 98)
Data Passports $20/month and Netflix subscription
Launched 3 new 4G mobile M1
broadband plans
Launched 25GB add-on for $5/month
Circles.Life
Launched unlimited data add-on for $20/
month
31Decline in Components of Customer Loyalty
(Infocomm: Components of Customer Loyalty)
Mobile Telecom Broadband PayTV
8.4 15
Repurchase Intention
Price Tolerance
8.0 12
Ratings (1 to 10 scale)
% Increase In Price
7.6 9
7.2 6
6.8 3
6.4 0
2016 2017 2018 2019 2020 2016 2017 2018 2019 2020 2016 2017 2018 2019 2020
!32BROADBAND CHURN
Broadband Sub-sector - Intent to Switch
(3-Year Trend)
                                   Will you consider switching to
                                   another service provider once
                                    your current contract is up?    n=600

                                     Yes                    No

       2018       2019      2020

                          7.8%
     7.0%
                6.3%

              Broadband
                                                                            !34
Broadband Sub-sector - Intent to Switch
Will you consider switching to
another service provider once
your current contract is up? n=600
Yes No
7.8% 92.2%
2019: 6.3% 2019: 93.7%
Main Reason To Consider Switching
62.6% ▲
Internet speed and network reliability related reasons
35.1%
19.4%
Price related reasons
15.5%
13.6%
Subscription plan related reasons
21.3%
2.6% ▼
Loyalty & rewards program related reasons
16.5%
2020
Product or hardware (such as modems 1.8%
2019
and router) related reasons 6.8%
▲▼ denotes statistically significant year-on-
0.0%
Customer service related reasons year increase/decrease at 90% confidence.
4.7%
!35Broadband Sub-sector - Intent to Switch
Will you consider switching to
Internet always gets disconnected so unreliable.
another service provider once Improvement on the reliability of the network
your current contract is up? n=600
need to be in placed quickly
Speed of the internet is not as fast and stable as
Yes No other service providers, price is more expensive
7.8% 92.2% too. If they want to have more expensive service,
2019: 6.3% 2019: 93.7% they should make sure their service is up to
standard
Main Reason To Consider Switching
There are more frequent breakdowns and they
take quite long to resolve the matter. Staff on the
62.6% ▲ phone need to be more patient when assisting as
Internet speed and network reliability related reasons
35.1% I called in to enquire on their faults
19.4% Always gets disconnected when I use the internet
Price related reasons
15.5% especially during peak hour when I needed
internet for work. Need to make sure that the
13.6% network don’t get disconnected and stay stable
Subscription plan related reasons
21.3% during peak hours
2.6% ▼
Loyalty & rewards program related reasons I always have service disruption during night
16.5%
2020 time and it's so annoying cause I have this issue
Product or hardware (such as modems 1.8% for many times already. They need to constantly
2019 check on the service for everyone to make sure
and router) related reasons 6.8%
▲▼ denotes statistically significant year-on- we don’t face any disruption since we are paying
0.0% not a small sum for the service every month
Customer service related reasons year increase/decrease at 90% confidence.
4.7%
!36PAYTV VS OTT
PayTV - Paying For Video-On-Demand Services

                            To PayTV Respondents Only         n=400
                       Are you currently paying for Video-On-
                         Demand services such as Netflix,
                               Amazon Prime Video?

                           No                         Yes
                  59.3%

                                                                                 40.7%

                                                     11.5%

                                                      2019                        2020

                                                ↑↓ denotes statistically significant year-on-year
                                                    increase/decrease at 90% confidence.
                                                                                                    !38
Loyalty to PayTV Provider Lower If Customers Have OTT Subscription
(PayTV: Paying For Video-On-Demand Services)
To PayTV Respondents Only n=400
Are you currently paying for Video-On-
Demand services such as Netflix,
Amazon Prime Video?
No Yes
59.3% 40.7%
2019: 88.5% 2019: 11.5%
Score/Rating %∆ Score/Rating %∆
Score
(0 to 100)
Customer Loyalty 72.4 0.0% 70.9 -8.8% *
Overall Satisfaction
with PayTV Provider 7.87 +3.3% * 7.62 -3.6%
How well expectations were
met with PayTV Provider 7.16 +2.2% 7.11 -5.1%
Rating
How close to ideal
(1 to 10)
PayTV Provider 7.26 +2.1% 7.12 -6.7%
Likelihood to pay for Video-
On-Demand services in next 3.15 -5.6% - *denotes statistically significant year-on-year
increase/decrease at 90% confidence.
3 months
!39Satisfaction Metrics for OTT Subscribers Marginally Lower
(PayTV: Paying For Video-On-Demand Services)
To PayTV Respondents Only n=400
Are you currently paying for Video-On-
Demand services such as Netflix,
Amazon Prime Video?
No Yes
59.3% 40.7%
2019: 88.5% 2019: 11.5%
Score/Rating %∆ Score/Rating %∆
Score
(0 to 100)
Customer Loyalty 72.4 0.0% 70.9 -8.8% *
Overall Satisfaction
with PayTV Provider 7.87 +3.3% * 7.62 -3.6%
How well expectations were
met with PayTV Provider 7.16 +2.2% 7.11 -5.1%
Rating
How close to ideal
(1 to 10)
PayTV Provider 7.26 +2.1% 7.12 -6.7%
Likelihood to pay for Video-
On-Demand services in next 3.15 -5.6% - *denotes statistically significant year-on-year
increase/decrease at 90% confidence.
3 months
!40Satisfaction Ratings for PayTV Provider & OTT Service
(PayTV: Paying For Video-On-Demand Services)
To PayTV Respondents Only n=400
Are you currently paying for Video-On-
Demand services such as Netflix,
Amazon Prime Video?
No Yes
59.3% 40.7%
2019: 88.5% 2019: 11.5%
8.30
7.87 7.83
7.65 7.62
7.00
Overall Satisfaction Overall Satisfaction Overall Satisfaction
With PayTV Provider With PayTV Provider With OTT Service
!41OTT Subscribers Rate Experience with Their PayTV Provider Poorer
(PayTV Attributes: OTT Subscriber vs Non-Subscriber)
Makes the effort to understand your needs OTT Subscriber
Provides prompt service OTT Non-Subscriber
Provides efficient service ▼
Increasing Good reputation ▼
Positive Impact
on PayTV’s Loyalty & rewards program ▼
Highlighted
Quality Score
Products and services are clear and easy to understand attributes denote
statistically
Range of channel packages to meet your needs ▼ significant
differences in ratings
Variety of channels that interest you ▼ between video-on-
demand subscribers
Transmission quality ▼ vs non-subscribers
Has your best interest at heart ▼
Limited Impact Proactively helps you when needed ▼
on PayTV’s ▲▼ denotes statistically
Quality Score Makes you feel assured that your needs will be taken care of significant year-on-year
increase/decrease at 90%
Innovative and forward-looking confidence.
6.6 7.5 8.4 !42Non-OTT Subscribers Unlikely to Subscribe to OTT
(PayTV: Paying For Video-On-Demand Services)
To PayTV Respondents Only n=400
Are you currently paying for Video-On-
Demand services such as Netflix,
Amazon Prime Video?
No Yes
59.3% 40.7%
2019: 88.5% 2019: 11.5%
Score/Rating %∆ Score/Rating %∆
Score
(0 to 100)
Customer Loyalty 72.4 0.0% 70.9 -8.8% *
Overall Satisfaction
with PayTV Provider 7.87 +3.3% * 7.62 -3.6%
How well expectations were
met with PayTV Provider 7.16 +2.2% 7.11 -5.1%
Rating
How close to ideal
(1 to 10)
PayTV Provider 7.26 +2.1% 7.12 -6.7%
Likelihood to pay for Video-
On-Demand services in next 3.15 -5.6% - *denotes statistically significant year-on-year
increase/decrease at 90% confidence.
3 months
!43Non-OTT Subscribers Tend to Be Older & With More Not Working
(PayTV Attributes: OTT Subscriber vs Non-Subscriber)
To PayTV Respondents Only
Are you currently paying for Video-On-
Demand services such as Netflix,
Amazon Prime Video? n=400
No Yes
59.3% 40.7%
2019: 88.5% 2019: 11.5%
18 to 29 Years 14.8% 13.5%
Age Group 30 to 49 Years 50.2% 68.6%
50 Years & Above 35.1% 17.9%
Working 85.5% 93.9%
Work Status
Not Working 14.5% 6.1%
GREEN/RED indicates that the proportion is
HIGHER/LOWER than the other segment with
statistical significance.
!44BUNDLING
Decline in Holding of Multiple Product Types for Broadband & PayTV
                                     (Infocomm: Components of Customer Loyalty)
                                            Mobile Telecom                                     Broadband                                          PayTV

                           8.4                                                                                                                                                15
                                     Repurchase Intention
                                     Price Tolerance
                           8.0                                                                                                                                                12
Ratings (1 to 10 scale)

                                                                                                                                                                                   % Increase In Price
                           7.6                                                                                                                                                9

                           7.2                                                                                                                                                6

                           6.8                                                                                                                                                3

                           6.4                                                                                                                                                0
                                  2016       2017   2018     2019   2020    2016        2017       2018       2019       2020       2016   2017   2018    2019   2020

                          Average Product
                              Holding       1.81    1.73    1.72    1.80                2.30       2.19       2.36       1.63              2.75   2.52    2.93   2.42

                                                                           Note: Product Holding question was only added in 2017.                                       !46
Product Bundling Generally Positively Related To Repurchase Intention
(Infocomm: Others Services Subscribed With Provider & Repurchase Intention)
8.0
Repurchase Intention
Repurchase Intention
7.7
(1 to 10 scale)
7.3
7.0
One Service Only One Additional Two Additional Three Or More
Service Services Additional Services
Which of the other services are you subscribed to?
Note: Data is unweighted !47Year-on-Year Change in Product Bundling
2019
2020
% Broadband
Respondents
47.5%
39.4%
34.1% 32.3%
25.0%
7.8%
2.1% 4.1%
Broadband Only Mobile & Broadband Broadband & PayTV Mobile, Broadband & PayTV
68.9%
60.0%
Respondents
% PayTV
36.0%
11.4% 10.3% 8.8%
3.0% 0.0%
PayTV Only Mobile & PayTV Broadband & PayTV Mobile, Broadband & PayTV
▲▼ Statistically significant year-on-year increase/drop at 90% confidence !48Unbundling: Decline in Triple Play Customers
2019
2020
% Broadband
Respondents
47.5%
39.4%
34.1% 32.3%
25.0%
7.8%
2.1% 4.1%
Broadband Only Mobile & Broadband Broadband & PayTV Mobile, Broadband & PayTV
68.9%
60.0%
Respondents
% PayTV
36.0%
11.4% 10.3% 8.8%
3.0% 0.0%
PayTV Only Mobile & PayTV Broadband & PayTV Mobile, Broadband & PayTV
▲▼ Statistically significant year-on-year increase/drop at 90% confidence !49Focusing On Service Quality Attributes Remain Key For Infocomm
(Infocomm Sector: Top 5 Attributes with Impact on Quality & Loyalty)
Mobile Telecom Broadband PayTV
Quality Loyalty Quality Loyalty Quality Loyalty
Products and services Makes the effort to
Provides prompt Provides prompt Has your best interest Makes the effort to
are clear and easy to understand your
service service at heart understand your needs
understand needs
Makes you feel Makes you feel
Has your best interest assured that your assured that your Provides prompt Provides efficient
Good reputation
at heart needs will be taken needs will be taken service service
care of care of
Increasing Makes you feel
Products and services
Makes you feel Makes you feel
Positive assured that your Proactively helps you assured that your Provides efficient assured that your
are clear and easy to
needs will be taken when needed needs will be taken service needs will be taken
Impact understand
care of care of care of
Products and services
Loyalty & rewards Provides efficient Has your best interest Has your best interest
are clear and easy to Good reputation
program service at heart at heart
understand
Makes the effort to Range of channel
Innovative and Provides prompt Proactively helps you Loyalty & rewards
understand your packages to meet my
forward-looking service when needed program
needs needs
Legend: Service Quality Brand Product Loyalty Program
!50CSISG 2020 Q1 RESULTS RETAIL SECTOR
Change to Online Data Collection Methodology for Retail Sector
                 (For Info-communication Sector Local Respondents)
                 Singapore citizens and PRs were interviewed at their homes.
                 Homes are selected from a random address listing that matches the housing
                 profile of Singapore resident population.

                 (For Wireless@SG Sub-sector Tourist Respondents only)
                 Departing tourists were interviewed at Changi Airport.

                 (For Retail Sector Local Respondents)
                 Singapore citizens and PRs were asked to complete an online survey.
                 Respondents were randomly selected from a nationally representative online
                 panel.
                 Each respondent answers up to 21 CSISG questions and about 25 industry-
                 specific attribute/touchpoint questions about the company/brand they had
                 recent experiences with. Each respondent evaluates only 1 company/brand.

                 Typically 50-200 respondents per company would have answered the CSISG
                 questionnaire.
                                                                                              !52
Impact of Change In Survey Methodology (ISE Whitepaper)
ISE conducted two pilot studies to understand how a change in survey mode, from an interviewer administered face-to-face
survey, to an online data collection methodology, might impact CSISG dimensions scores, and the demographic
representativeness of respondents.
SUMMARY OF DIFFERENCES
Study Focus Sub-sector (Online Self Administered Surveys vs Interviewer Administered Face-to-Face Surveys)
CSISG Dimensions Demographic Profiles
• Differences in all scores
Banks • Lower scores in most areas • Differences in 13 out of 15 sub-profiles observed
• Higher complaint rates observed
Low Incidence Credit Card • Differences in 14 out of 15 sub-profiles observed
Sub-Sectors
(Pilot 1) • Differences in all scores
Life Insurance • Lower scores in all areas • Differences in 8 out of 15 sub-profiles observed
• Higher complaint rates observed
Health & Medical
• Differences in 11 out of 15 sub-profiles observed
Insurance
• Differences in 3 out of 6 scores
MRT • Higher scores in two areas • Differences in 8 out of 15 sub-profiles observed
High Incidence
• Higher complaint rates observed
Sub-Sectors
• Differences in 2 out of 6 scores
(Pilot 2)
Public Buses • Higher score in one area • Differences in 10 out of 15 sub-profiles observed
• Lower score in one area
For more details download the white paper at https://ise.smu.edu.sg/sites/ise.smu.edu.sg/files/uploads/CSISG%20Fieldwork%20Methodology%20Whitepaper%2015Jun20.pdf
!53Retail Sector Scores
Product
Quality
Perceived
Complaints
Customer
Quality
Perceived
Service
Quality
Perceived
CSISG Expectations Quality Perceived Value CSISG
Value
(Predicted Quality
(After Recent
Before Recent
Customer Customer
Expectations
Experience)
Loyalty
Experience)
e-Commerce 70.8 72.3 71.0 72.9
Fashion Apparels 72.8 73.2 70.7 72.1
Department Stores 71.8 72.6 69.0 71.2
Supermarket 69.3 70.2 68.3 69.9
* Note: No year-on-year change shown due to change in data collection methodology for Retail sector done online with locals only, as opposed to face-to-face
interviews with both locals and tourists in 2019.
!54Retail Sub-Sectors Quality Scores
Product
Quality
Perceived
Quality
Perceived Perceived Perceived
Service
Quality
Product Quality Service Quality Quality
e-Commerce 72.2 72.3 72.3
Fashion Apparels 73.3 73.2 73.2
Department Stores 72.6 72.6 72.6
Supermarket 70.6 69.8 70.2
!55Retail Company Scores
e-Commerce Sub-Sector Fashion Apparels Sub-Sector Department Stores Sub-Sector Supermarket Sub-Sector
CSISG: 72.9 CSISG: 72.1 CSISG: 71.2 CSISG: 69.9
Ebay 77.5 Market Place/
Adidas 75.6 Robinsons 77.0 76.5
Jasons
Amazon 75.7
Zalora 75.7 Uniqlo 74.6
Tangs 73.2 Cold Storage 73.0
Shopee 75.5
G2000 74.3
Fave 72.7 Marks & Spencer 72.3 Sheng Siong 70.7
Aliexpress 72.6 Giordano 72.1
Qoo10 70.6 OG 70.1 NTUC FairPrice 70.3
H&M 70.3
Taobao/Tmall 70.3
BHG 70.0 Prime 67.9
Lazada 70.0 Cotton On 66.3
Carousell 69.5
Other Other
72.4 Department Stores
70.4 Giant 65.6
Other e-Commerce 80.7 Fashion Apparels
50 60 70 80 90 50 60 70 80 90 50 60 70 80 90 50 60 70 80
Notes: (1) No year-on-year change shown due to change in data collection methodology for Retail sector done online with locals only, as opposed to face-to-face
interviews with both locals and tourists in 2019.
(2) Entities shown above have samples of N≥50. For Fashion Apparels, due to the fragmented nature of the sub-sector, entities shown have N≥30. !56IMPACT OF COVID-19
e-Commerce & Fashion Apparel Scores Appear to Be Indicatively Higher
During Circuit Breaker
e-Commerce Fashion Apparels
Start of Start of
80
CSISG Circuit Circuit
Breaker Breaker
Customer Loyalty
76
73
Respondents
mostly omni-
69 channel
customers
66
62
ay
ay
M
M
22 8
22 8
11 2
11 2
25 4
25 4
b
b
ar
ar
b
b
ar
ar
10 6
10 6
Fe
Fe
Fe
Fe
to 7 to
to 7 to
18
18
M
M
M
M
to to
to to
to to
to to
to to
to to
n 1
n 1
b 3
b 3
b 5
b 5
to
to
M eek
M eek
Ja ek
Ja ek
Fe ek
Fe ek
Fe ek
Fe ek
ay
ay
e
e
e
e
e
e
11 *W
11 *W
28 W
28 W
12 W
12 W
26 W
26 W
M
M
ar
ar
4
4
*1
*1
*Note: Sample sizes for Week 7 to 8, and the Week of 14 May to 18 May, are smaller
as compared to the previous weeks. Hence score movements are only indicative. !58CUSTOMER JOURNEY
Retail Sector: Customer Journey

                                                          Payment Process/
        Pre-Experience   In-store Experience   Products    Post-Experience
Start                                                                        Finish

                                                                                      !60
Payment Process/
Pre-Experience In-store Experience Products Post-Experience
Start Finish
• Social distancing • Social distancing within • No samples that require • Contactless payments
for entry to stores stores physical contact
• Contactless pickup of
• No mall events • Fitting rooms to be • Individually packed items at store
disinfected after each use samples upon request or
• Flexible exchange
purchase are permitted
• Products tried on by policies encouraged
customers should be
sanitised where possible
Sources: (1) https://www.channelnewsasia.com/news/singapore/covid-19-phase-2-dining-retail-shopping-safety-guidelines-12841096
(2) https://www.channelnewsasia.com/news/singapore/covid-19-singapore-retail-shops-gear-up-to-reopen-once-they-get-12780584 (3) ISE Photos !61Retail Sub-sectors Attribute Ratings: Pre-Experience
Payment Process/
Pre-Experience In-store Experience Products Post-Experience
Start Finish
Department Stores Fashion Apparels Supermarkets
2020 Avg Rating 2020 Avg Rating 2020 Avg Rating
Information
Information on productsand
on products and Information on promotions
Information on Ease
Easeofofgetting
getting to the
thestores
stores
promotions
promotions in adverts
in adverts promotions are
areclear
clear
Attractiveness
Attractiveness of promotions
promotions Brand image
Brandcomplements
image
Offersattractive
Offers attractive promotions
promotions complements your lifestyle
your lifestyle
and discounts
and discounts
Brand image
Brandcomplements
image Attractiveness of promotions
Attractiveness of promotions
complements your lifestyle
your lifestyle and discounts
and discounts
Competitiveness of the Competitiveness of the
Competitiveness of the prices Competitiveness of the prices
prices prices
6.0 7.0 8.0 6.0 7.0 8.0 6.0 7.0 8.0
Attribute Rating
denotes attributes with significant positive impact to loyalty score (Scale of 1 to 10) !62Retail Sub-sectors Attribute Ratings: In-store Experience
Payment Process/
Pre-Experience In-store Experience Products Post-Experience
Start Finish
Department Stores Fashion Apparels Supermarkets
2020 Avg Rating
2020 Avg Rating I can try on the 2020 Avg Rating
I can try on the products comfortably
products comfortably Cleanliness ofof
Cleanliness store
store
Product display
Product at department
display store
at department store
Lighting
Lighting is appropriate
is appropriate
Organisation
Organisation and
and orderliness
orderliness of Organisation
Organisation and
and orderliness
orderliness of
Staff gives me comfortable
Staff gives me comfortable space to shop around of products in storein store
of productsproducts
in storein store products
space to shop around
Products are Products
displayedarein adisplayed in a
visually appealing EaseEase of getting
of getting to whatto you
whatneed
you in
Ease oftogetting
Ease of getting to need
what you what in need in store
visually appealing manner manner store
you need in the the store
store Instore information onand
Instore information on products
DesignDesign
of theofstore is attractive
the store is attractive
Ambience at department
Ambience store
at department store products and promotions
promotions
It is easy to find what
It is easy to find what you are looking for in the Ambience at at
Ambience thethe
supermarket
supermarket
you are looking for in the store store
Helpfulness
Helpfulness of of staff
staff Staff provides prompt
Staff provides and
prompt and quick
quick service service Helpfulness ofofstaff
Helpfulness staff
Product
Product knowledge
knowledge of of staff
staff Staff knows the products
Staff knows the products well
well
Product knowledge
Product of of
knowledge staff
staff
Staff is approachable
Instore information
Instore information onand
on products Staff is approachable and personable
and personable
promotions
products and promotions Availability of staff
Availability when
of staff needed
when needed
The store Thehas
storea has
pleasant ambience
a pleasant ambience
Availability
Availability of staff
of staff when
when needed
needed Ability to accommodate
Ability to accommodate to to
your
your
Staff isStaff
proactive in offering
is proactive help
in offering help special requests
special requests
6.0 7.0 8.0 6.0 7.0 8.0 6.0 7.0 8.0
denotes attributes with significant positive impact to loyalty score Attribute Rating !63
(Scale of 1 to 10)Retail Sub-sectors Attribute Ratings: Products
Payment Process/
Pre-Experience In-store Experience Products Post-Experience
Start Finish
Department Stores Fashion Apparels Supermarkets
2020 Avg Rating 2020 Avg Rating 2020 Avg Rating
Availability ofproducts
Availability of products
Availability ofproducts
Availability of products Has
Has high qualityproducts
high quality products
Variety of products
Variety of productsthat
that
meet your your
meet needsneeds
Variety ofproducts
Variety of productsthat
that The varietyofofproducts
The variety products
meetmeet
your your
needsneeds interestinterest
me me
Freshness ofproduce
Freshness of produce
Varietyofofbrands
Variety brandsthat
that Variety ofbrands
Variety of brandsthat
that
Has uniqueproducts
Has unique products
interest
interest you you interest you you
interest
6.0 7.0 8.0 6.0 7.0 8.0 6.0 7.0 8.0
Attribute Rating
(Scale of 1 to 10)
denotes attributes with significant positive impact to loyalty score !64Retail Sub-sectors Attribute Ratings: Payment Process / Post-Experience
Payment Process/
Pre-Experience In-store Experience Products Post-Experience
Start Finish
Department Stores Fashion Apparels Supermarkets
2020 Avg Rating 2020 Avg Rating 2020 Avg Rating
PaymentProcess
Payment Process Payment
Paymentprocess
process Payment
Paymentprocess
process
ReturnReturn
and exchange
and ReturnReturn
and exchange
and ReturnReturn and
and exchange
exchange policies
policies exchange policies
policies exchange policies
policies
6.0 7.0 8.0 6.0 7.0 8.0 6.0 7.0 8.0
Attribute Rating
(Scale of 1 to 10)
denotes attributes with significant positive impact to loyalty score !65Retail: Top 3 And Bottom 3 Rated Attributes
Department Stores Fashion Apparels Supermarket
How will
** Payment Process ** Ease of getting
Payment process
to the stores COVID-19
Product display I can try on the
Payment process
Impact these
at department store
Organisation and
products comfortably
attributes?
orderliness of Lighting is
Cleanliness of store
products in store appropriate
↑ Top 3 Attributes ↑
↓ Bottom 3 Attributes ↓
** Attractiveness of
promotions ** Has unique Product knowledge
and discounts products of staff
** Brand image
complements Staff is proactive Availability of
** denotes
your lifestyle in offering help staff when needed
attributes with
significant positive ** Competitiveness Ability to
** Offers attractive Source: https://www.channelnewsasia.com/news/
impact to loyalty of the prices accommodate to singapore/covid-19-phase-2-dining-retail-shopping-
promotions
score your special requests safety-guidelines-12841096
!66LEVERAGING ON TECHNOLOGY
Supermarket: Most Frequent Method of Checkout
                                             100%

                 % Supermarket Respondents
                                                           65.6%

                                             50%
                                                                                34.4%

                                              0%
                                                    Counter Staff/ Cashier   Self-checkout

                                                                                             !68
Supermarket: Most Frequent Method of Checkout
100%
% Supermarket Respondents
65.6%
50%
34.4%
0%
Counter Staff/ Cashier Self-checkout
CSISG Score 69.0 71.4 Respondents who
frequently use self-
Score checkout have higher
(0 to 100) loyalty scores and
Loyalty Score 67.8 73.4 satisfaction rating for
payment process.
Rating GREEN/RED score indicates one segment
(1 to 10)
Payment Process 7.11 7.49 performed BETTER/WORSE than the other
segment with statistical significance
!69Supermarket: Checkout Method Preference & Usage
100%
% Supermarket Respondents
54.1%
50%
30.4%
15.5%
0%
Preferred & Frequently Used Preferred & Frequently Used Preferred A Different
Counter Staff/ Cashier Self-Checkout Checkout Method
Than What They
Frequently Used
CSISG Score 69.2 71.9 67.8
Score
(0 to 100)
Loyalty Score 68.1 74.0 66.7
Rating
(1 to 10)
Payment Process 7.18 7.60 6.76
GREEN/RED score indicates one segment performed BETTER/WORSE than those who preferred & frequently used self-checkout with statistical significance !70Supermarkets: Users of Preferred Checkout Method Score Better
100%
% Supermarket Respondents
54.1%
50%
30.4%
15.5%
0%
Preferred & Frequently Used Preferred & Frequently Used Preferred A Different
Counter Staff/ Cashier Self-Checkout Checkout Method
Than What They
Frequently Used
CSISG Score 69.2 71.9 67.8
Score
(0 to 100)
Loyalty Score 68.1 74.0 66.7
Rating
(1 to 10)
Payment Process 7.18 7.60 6.76
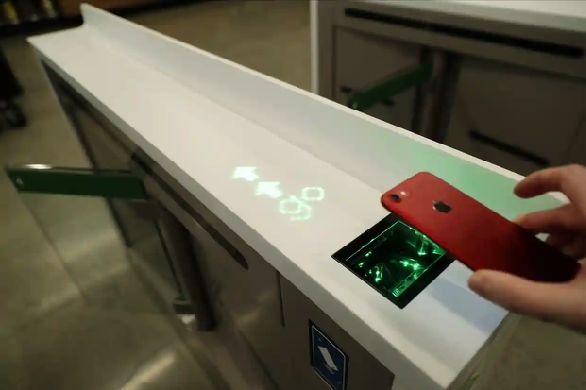
GREEN/RED score indicates one segment performed BETTER/WORSE than those who preferred & frequently used self-checkout with statistical significance !71Checkout-free Retail by Amazon (US)
WEBROOMING
Department Stores / Supermarkets / Fashion Apparels:
For your recent purchase at Brand X, did you search online for product
information BEFORE making the purchase?

SHOWROOMING
e-Commerce:
For your recent purchase at Brand Y, did you find out more about the
product(s) at a physical store BEFORE making the purchase?

                                                                         !73
Brick & Mortar Webrooming
100%
Brick & Mortar Retailers
(Department Stores, Fashion Apparel, Supermarkets)
Searched product information
% Respondents
online before recent purchase 57.3%
50%
25.9%
16.8%
0%
Yes, for all Yes, for No, I did not
the items selected items
!74
Note: Brick & Mortar data is unweightedWebrooming Customers More Satisfied & Loyal to Brick & Mortar Retailer
(Webrooming Behavior for Brick & Mortar Sub-Sectors)
100%
Brick & Mortar Retailers e-Commerce
(Department Stores, Fashion Apparel, Supermarkets)
Searched product information physical
Searched product information
% Respondents
store before recent purchase
online before recent purchase 57.3%
50% 41.7%
35.5%
25.9% 22.8%
16.8%
0%
Yes, for all Yes, for No, I did not Yes, for all Yes, for No, I did not
the items selected items the items selected items
CSISG Score 78.7 73.5 68.3 76.1 73.2 71.4
Score
(0 to 100)
Loyalty Score 77.5 72.7 65.7 75.5 72.3 69.2
GREEN/RED score or rating indicates segment performed BETTER/WORSE than those who did not search for information with statistical significance.
!75
Note: Brick & Mortar data is unweightedWebrooming Customers Spend More & More Likely to Return
(Webrooming Behaviour for Brick & Mortar Sub-Sectors)
100%
Department Store Fashion Apparels Supermarkets
Searched product 70.0%
% Respondents
information online 58.0%
before recent 51.1%
50%
purchase
25.0% 28.5%
20.4% 22.1%
16.9%
7.9%
0%
Yes, for all Yes, for No, I did not Yes, for all Yes, for No, I did not Yes, for all Yes, for No, I did not
the items selected items the items selected items the items selected items
Repurchase
Intention 8.24 7.52 7.20 8.35 7.83 7.14 8.31 7.83 7.58
(Rating 1 to 10)
Average Spend $300 $181 $81 $302 $177 $69 $158 $68 $37
GREEN/RED score or rating indicates segment performed BETTER/WORSE than those who did not search for information with statistical significance. !76Webrooming Customers Tend to Be Younger & Male
(Profile of Webrooming Behaviour By Retail Sub-Sectors)
100% Department Store Fashion Apparels Supermarkets
Searched product
% Respondents
70.0%
information online 58.0%
before recent 51.1%
50%
purchase 25.0% 28.5%
16.9% 20.4% 22.1%
7.9%
0%
Yes, for all Yes, for No, I did not Yes, for all Yes, for No, I did not Yes, for all Yes, for No, I did not
the items selected items the items selected items the items selected items
18 to 29 Years 25.6% 25.9% 16.9% 29.4% 24.2% 28.5% 19.6% 20.5% 22.8%
Age
30 to 49 Years 65.7% 58.7% 47.6% 66.5% 67.0% 44.9% 59.4% 51.8% 37.1%
Group
50 Years & Above 8.7% 15.4% 35.5% 4.1% 8.8% 26.7% 21.0% 27.6% 40.1%
Male 57.6% 54.7% 38.3% 65.8% 52.3% 35.9% 41.2% 55.3% 45.2%
Gender
Female 42.4% 45.3% 61.7% 34.2% 47.7% 64.1% 58.8% 44.7% 54.8%
!77Webrooming vs Showrooming
100%
Brick & Mortar Retailers e-Commerce
(Department Stores, Fashion Apparel, Supermarkets)
Searched product information at physical
Searched product information
% Respondents
store before recent purchase
online before recent purchase 57.3%
50% 42.2%
35.8%
25.9% 22.0%
16.8%
0%
Yes, for all Yes, for No, I did not Yes, for all Yes, for No, I did not
the items selected items the items selected items
CSISG Score 78.7 73.5 68.3 76.1 73.2 71.4
Score
(0 to 100)
Loyalty Score 77.5 72.7 65.7 75.5 72.3 69.2
GREEN/RED score or rating indicates segment performed BETTER/WORSE than those who did not search for information with statistical significance.
!78
Note: Brick & Mortar data is unweightedShowrooming Customer Also Tend to Score Better
(Webrooming vs Showrooming)
100%
Brick & Mortar Retailers e-Commerce
(Department Stores, Fashion Apparel, Supermarkets)
Searched product information physical
Searched product information
% Respondents
store before recent purchase
online before recent purchase 57.3%
50% 42.2%
35.8%
25.9% 22.0%
16.8%
0%
Yes, for all Yes, for No, I did not Yes, for all Yes, for No, I did not
the items selected items the items selected items
CSISG Score 78.7 73.5 68.3 76.1 73.2 71.4
Score
(0 to 100)
Loyalty Score 77.5 72.7 65.7 75.5 72.3 69.2
GREEN/RED score or rating indicates segment performed BETTER/WORSE than those who did not search for information with statistical significance.
!79
Note: Brick & Mortar data is unweightedRetail Transformation: Moving Further Into Digital
Sephora
Virtual Consultation
CapitaLand Malls
Online Platform
for Tenants
iShopChangi Sources:
Online Platform (1) https://ishopchangi.com/en/home
(2) https://www.straitstimes.com/business/companies-markets/capitaland-to-
for Tenants launch-online-shopping-and-food-ordering-platforms-on-june
(3) https://www.sephora.sg/beauty-services/virtual-beauty-consultation
(4) https://www.scmp.com/business/article/3081454/live-streaming-sales-
prove-lifeline-chinas-small-retailers-coronavirus
(5) https://www.capgemini.com/2020/04/preparing-for-tomorrow-touchless-
Live-Streaming retail-chinas-new-way-to-shop/#
Virtual Sales
!80Retail Sector: Top 5 Drivers of Loyalty
Department Stores Fashion Apparels Supermarkets e-Commerce
Information about the
Products are displayed in a Variety of products that meet
products and promotions in Return and exchange policies
visually appealing manner your needs
advertisements
Brand image complements
Has high quality products Ease of getting to the stores Return and exchange policies
your lifestyle
Increasing
Positive Ease of getting to what you Variety of products that Brand image complements Attractiveness of promotions
Impact need in the store interest you your lifestyle and discounts offered
Organisation and orderliness
Competitiveness of the prices Has unique products Security of website
of products in store
Ease of finding the products
Ambience at department store Offers attractive promotions Helpfulness of staff
you need
Legend: Pre-Experience In-Store Product Post-Experience !81Take Note of e-Commerce Key Drivers of Loyalty When Going Online
(Retail Sector: Top 5 Drivers of Loyalty)
Department Stores Fashion Apparels Supermarkets e-Commerce
Information about the
Products are displayed in a Variety of products that meet
products and promotions in Return and exchange policies
visually appealing manner your needs
advertisements
Brand image complements
Has high quality products Ease of getting to the stores Return and exchange policies
your lifestyle
Increasing
Positive Ease of getting to what you Variety of products that Brand image complements Attractiveness of promotions
Impact need in the store interest you your lifestyle and discounts offered
Organisation and orderliness
Competitiveness of the prices Has unique products Security of website
of products in store
Ease of finding the products
Ambience at department store Offers attractive promotions Helpfulness of staff you need
Legend: Pre-Experience In-Store Product Post-Experience !82Key Takeaways
Infocomm Sector
• Marginal decline in satisfaction and decline in service-related metrics.
• Challenges: Customers appear more price sensitive, Broadband and PayTV customers
unbundling their services. OTT subscribers rate their PayTV providers poorer.
• Moving forward: Apart from improving product offerings, focus on service quality.
Retail Sector
• Insights: Webrooming and Showrooming customers are more satisfied, loyal and spend
more. Self-checkout customers also more satisfied and loyal.
• Moving forward: Leverage on technologies such as self-checkout and omni-channel
platforms to redesign customer experience in a post-COVID world.
!83ISE Industry Forum CSISG 2020 Q1 Results Announcement RETAIL AND INFO-COMMUNICATIONS RESULTS
You can also read