ANNUAL COMMUNITY SERVICE OFFICER ALLOCATION UPDATE 'ACUTE' 2018
←
→
Page content transcription
If your browser does not render page correctly, please read the page content below
ANNUAL COMMUNITY SERVICE OFFICER
    ALLOCATION UPDATE ‘ACUTE’
              2018
Table of Contents

1.       Introduction .......................................................................................... 3
2.       Methodology and Definitions ....................................................................... 3
3.       Definition of terms ................................................................................... 4

4.       Background ........................................................................................... 4
5.       Policy and Legislation in favour of rural and underserved areas ............................... 5
6.1. Summary of Key findings ................................................................................ 6
6.2. An overview of the Eastern Cape community service allocation ................................... 8
6.3. Medical officers........................................................................................... 9

6.4. Professional Nurses .................................................................................... 10
6.5. Pharmacists ............................................................................................. 11
6.6. Rehabilitation........................................................................................... 11
6.6.1 Occupational therapists ............................................................................. 12
6.6.2. Physiotherapists ...................................................................................... 13
6.6.3. Speech therapy ....................................................................................... 14

6.6.4. Audiology .............................................................................................. 15
6.6.5. Dual qualified speech therapy and audiology .................................................... 16
7.1. An overview of the North West Province community service allocations ....................... 16
7.2. Medical Officers ........................................................................................ 17
7.3. Professional nurses ..................................................................................... 18
7.4. Pharmacists ............................................................................................. 18

7.5. Occupational therapists ............................................................................... 19
7.6. Physiotherapists ........................................................................................ 20
7.7. Speech therapists ...................................................................................... 21
7.8. Audiologists ............................................................................................. 21
8. Conclusion ................................................................................................. 22
9. Recommendations ........................................................................................ 23

                                         ACKNOWLEDGEMENTS

This report was written by Karessa Govender with contributions by Russell Rensburg, Marije
Versteeg-Mojanaga and Samantha Khan-Gillmore.

                                                                                                               2
The Annual CSO Allocation Update ‘ACUTE’
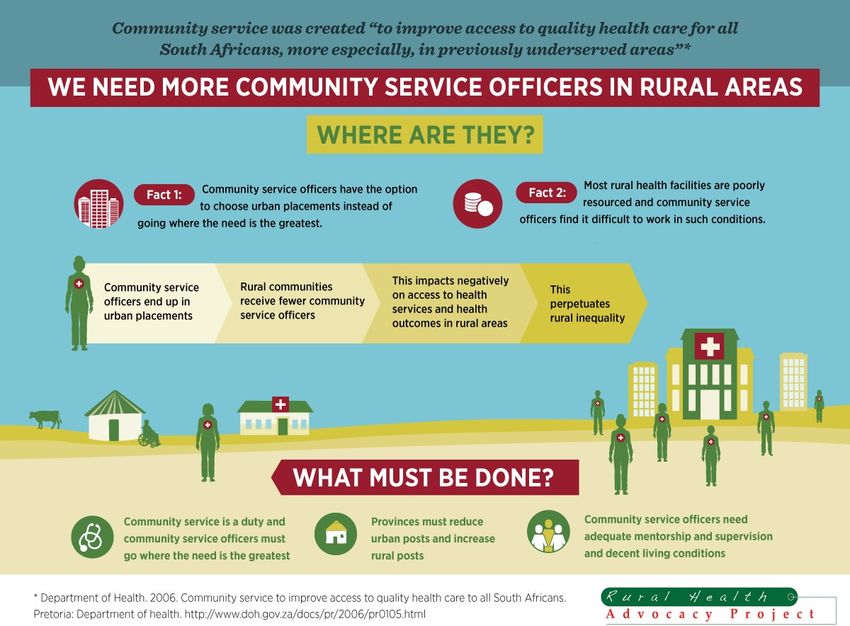
1. Introduction
With this publication the RHAP launches an Annual Community Service Officer Update
‘ACUTE’ on the allocation of community service officers in South Africa. The purpose is to
monitor whether the country is making progress with regards to meeting the intended
purpose of community service which is to address the maldistribution of human resources for
health, in particular in rural areas. It follows RHAP’s rural health update “Community Service
Medical Officer Allocations 2017: Salt in an open wound” which was released in December
2016. This first issue of the Annual Community Service Barometer covers the data that we
could access for the North West Province, as of 9 January 2018 and the placements
provided to us for the Eastern Cape (unknown round). While the final numbers for the
Eastern Cape may have changed after multiple rounds, the distribution data in this update
provides an indication of the placement trends.
In future, data for all provinces after each round should be made publicly available for
transparency and accountability.
2. Methodology and Definitions
An Excel spreadsheet with the 2017 Eastern Cape and North West placements was made
available to RHAP via Health Information Systems Programme. This spreadsheet reported
on the final placements in these provinces. The ‘applicant allocated’ filter was selected as
this was interpreted as the facility that the community service officer was allocated to. An
Excel spreadsheet with the 2018 North West placements was made available to RHAP via
the Human Resources Services Directorate of the North West Department of Health. We
were informed that this was the latest round of placements. An Excel spreadsheet with the
2018 Eastern Cape placements was made available to us via the National Department of
Health. This provided information on the facilities that had community service posts and the
number of posts allocated to each facility.
The community service posts were analysed using two variables. The first was the South
African Index of Multiple Deprivation. This index considers income and material deprivation,
3employment deprivation, education deprivation and living environment deprivation.1 The
scale was then used to rank districts based on their level of deprivation. The second variable
used to analyse the data was rural/urban. No single definition of rurality exists. The most
deprived districts are rural but some pockets of deprivation also exist in less deprived urban
areas. RHAP classified facilities rural/urban according to our knowledge of the rural/urban
geography of provinces and population size. A list of the classification can be accessed via
the RHAP website: www.rhap.org.za
3. Definition of terms
The spreadsheets that were made available for analysis used the following terms: posts,
allocations, placements. RHAP consulted with senior officials from North West HR and it was
found that all three terms referred to any posts that were available for community service
officers to apply.
HRH: Human resources for health
Allied health professionals: These refer to disciplines distinct from medicine, nursing and
pharmacy.2 They include occupational therapy, speech therapy, physiotherapy, audiology,
radiography, amongst other disciplines.
4. Background
In the aftermath of the 2017 community service allocations, the Minister of Health, Dr. Aaron
Motsoaledi explicitly stated that rural communities would be prioritised in the placement of
health professionals from 2018 and beyond. This was in response to another year of
community service allocations where metropolitan areas received the lion’s share whilst rural
and underserved areas received the leftovers. Health facilities across the nation are in dire
need of health care workers – however rural and underserved areas suffer from a more
desperate plight – despite rural regions constituting almost half of the country’s population,
they experience the highest HR shortages. Mpumalanga, Limpopo and Eastern Cape which
1
Noble M, Zembe W, Wright G, Avenell D. Multiple Deprivation and Income Poverty at Small Area Level in South
Africa in 2011. Southern African Social Policy Research Institute and Southern African Social Policy Research
Insights. 2013.
2
2
Association of Schools of Allied Health Professionals. [Online]. [cited 2018 February 13. Available from:
http://www.asahp.org/what-is/.
4comprise more than 50% rural people have per capita expenditure which falls below the
national average.3
Community service health professionals are seen as a much needed asset in rural and
underserved areas. In these communities, the addition of a single healthcare worker to an
already resource constrained facility makes a significant difference to service delivery. Very
often it may be the difference between a service being provided and none at all. Healthcare
workers are sparsely distributed in rural areas and the few that exist are required to cover
large catchment areas. Health users in rural areas are challenged with few health facilities
and healthcare workers. This together with extremely challenging terrain makes it
exceptionally difficult for patients to access the limited services that are available. However
the presence of health workers in rural areas allows for outreach services into the
community. Without this very necessary service, many rural health users may never realise
the right to access health.
5. Policy and Legislation in favour of rural and underserved areas
The national department of health is aware of the impact of community service health
workers in rural areas and thus both the Community Service and Internship Placement
Guideline 2017-2018 and the National Department of Health Strategy for Human Resources
for Health South Africa, Strategic Priority 8 speak to the prioritization of rural and
underserved areas for community service placement. The former document impresses on
provincial departments of health to improve funding to district hospitals and primary health
care facilities to take on community service officers. The latter document delineates authority
to the provincial departments to ensure health facilities in rural and underserved
communities are given preference over facilities located in urban areas. It takes it one step
further by stating that by 2018/2019 all community service placements will be phased out of
central hospitals in metropolitan areas. It must be strongly reinforced that the original
intention of the community service programme was to address the inequitable distribution of
healthcare workers. The compulsory one year of community service was envisioned to
provide health services to priority areas which were historically disadvantaged and present
with the greatest need.
3
Stats SA Census 2011.
56.1. Summary of Key findings
a. Eastern Cape Province
· For the 2017 placement year, over 50% of rural posts for community service medical
officers were not filled.
· The Eastern Cape Province has seen an overall increase in terms of the number of
community service posts for 2018 in the majority of cadres reviewed (medical officers,
professional nurses, pharmacists, occupational therapists, speech therapists and
audiologists). This needs to be applauded. However physiotherapy experienced a
decline by 6 community service officers.
· A significant increase was noted with the number of professional nurses increasing from
377 to 507. There has also been an attempt to redirect posts from less deprived districts
to more deprived ones. In addition, the number of professional nurses allocated to rural
areas outweigh urban.
· Despite these areas of progress, we however continue to see a maldistribution in favour
of urban health facilities for medical officers. (Urban: rural = 49: 35).
· In some instances, more deprived districts will be receiving fewer community service
officers than in 2017 whilst less deprived districts benefit from an increase. The OR
Tambo district which is very deprived district will experience a drop in professional
nurses and pharmacist officers whilst the Nelson Mandela Bay Metro, which experiences
less deprivation, will benefit from an increase in professional nurses. The Alfred Nzo
district will also experience a drop in pharmacist community service officers. Alfred Nzo
and Joe Gqabi Districts, which are the most deprived districts in EC, will not be receiving
any community speech therapists or audiologist allocations in 2018.
· There is a lack of continuity of care for marginalised rural communities:
o Isilimela Hospital in OR Tambo District which was allocated a community service
occupational therapist (OT) and physiotherapist (PT) last year will not be
receiving any in 2018. As it does not have permanent OT and PT posts this
means an actual regression in access to healthcare.
o The same hospital which is currently serviced by two medical officers will not be
receiving any community service medical officers for 2018. This, despite Mthatha
General Hospital, which is located in an urban area in the same district, receiving
5 community service officers.
6Maldistribution between provinces persists. Despite KZN and EC both being rural provinces
– the inter-provincial distribution of community service posts strongly favours KZN. KZN was
allocated more than double the number of many medical officers than EC and almost twice
as many pharmacists as EC. Kwa-Zulu Natal was also allocated 11 more occupational
therapists than the Eastern Cape.
b. North West
• Progress in community service allocation in North West Province must be
acknowledged. There has been an overall increase in the number of medical officers,
professional nurses, pharmacists and physiotherapists. In the case of professional
nurses and pharmacists, the number allocated has more than doubled from 2017 to
2018.
• It has been brought to our attention that the North West Province may have created
more community service posts than other provinces and have created posts for both
bursary holders and non bursary holders. This information however could not be
confirmed.
• There has also been a concerted effort to direct posts to more deprived districts and
to favour rural areas. This is evidenced in the allocation of professional nurses and
pharmacists where the distribution strongly favours rural areas.
• The North West province has ring fenced funding for community service officers. This
ensures that funds are available annually for these cadres.
• Despite the progress, there are still areas of concern:
o Of the 824 posts, 805 have been filled. The unfilled posts in rural areas
outweigh those of urban areas. We have been informed that these posts may
be filled through the placement of foreign workers. However this has not been
finalised yet.
o The allocation of medical officers strongly favours urban hospitals; urban
areas will benefit from almost twice the number of medical officers than rural
areas.
o The least deprived districts (Bojanala and KK) in the North West province
have received far more medical officers than the most deprived districts
(NMM and Dr. RSM).
o The overall number of occupational therapists has declined from 2017. The
number of occupational therapists allocated to urban areas outweighs that of
rural areas.
7o The number of speech therapists and audiologists are extremely low when
taking into account the level of deprivation and need in the province.
o As stated earlier, NW province has one of the highest prevalence of disability
in the country. Adequate staffing for allied health professionals is therefore
paramount in addressing the unique needs of this population.
6.2. An overview of the Eastern Cape community service allocation
The Eastern Cape is one of 5 provinces where over half of the population reside in rural
areas.4 This province experiences one of the highest maternal mortality in facility ratio 5 in the
country. It is known that overall, rural areas face worse health outcomes compared to urban
areas. These outcomes would necessitate more comprehensive health programmes which
require adequate staffing with competent health care workers. Historically, this province has
been marred with HRH shortages with large inequities between urban and rural districts. An
index investigation by the Rural Health Advocacy Project into the 2017 allocation of
community service officers revealed that after the first round, more than 50% of medical
officer placements were in urban districts such as Nelson Mandela Bay Metro and Buffalo
City.6 Of the 153 medical officer posts available, only 56 were filled. It must be noted that
analysis was based on information available at the time. This data was the first round
placement of medical officers. New data became available later and this information was
used to compare 2017 and 2018 placements.
4
Stats SA Census 2011.
5
Massyn N, Padarath A, Peer N, Day C. District Health Barometer 2016/17. Durban: Health Systems Trust.
6
RHAP. Rural Health Update: Community Service Medical Officer Allocations: Salt in an open wound. Rural
Health Advocacy Project: 2016.
86.3. Medical officers
MO CS MO CS Deprivation
DISTRICT Allocation Allocation 1 = Most Deprived
5 = Least deprived
2017 2018
Nelson 12 14 5
Mandela Bay
Metro
Buffalo City 6 7 4
OR Tambo 19 23 1
Alfred Nzo 5 9 1
Chris Hani 7 14 1
Joe Gqabi 3 6 1
Sarah 13 8 3
Baartman
Amatole 10 12 1
75 93
Table 1: Comparison of 2017 and 2018 medical officer community service allocation
A positive for the province, there has been an overall increase in the number of medical
officers allocated to the Eastern Cape. The increase is significant; 75 in 2017 to 93 in 2018.
The most deprived districts (OR Tambo, Alfred Nzo, Chris Hani and Amatole) have all been
allocated more medical officers than last year.
Issues with distribution of posts however still persist; despite the gross increase, placements
are still favoured towards health facilities in urban areas. Joe Gqabi district which
experiences high levels of deprivation has only received 3 more posts than last year.
A closer look at the OR Tambo district reveals further evidence of inequitable distribution.
Allocation has been skewed in favour of urban hospitals. Mthatha General Hospital which is
located in an urban area has been allocated 5 community service officers whilst a deeply
9rural hospital in the same district (Isilimela Hospital) which currently is serviced by two
medical officers will not be receiving any community service medical officers for 2018.
6.4. Professional Nurses
PNs CS PNs CS Deprivation
DISTRICT Allocation Allocation 1 = Most Deprived
5 = Least deprived
2017 2018
Nelson Mandela 66 78
Bay Metro 5
Buffalo City 17 27 4
OR Tambo 97 72 1
Alfred Nzo 50 62 1
Chris Hani 35 84 1
Joe Gqabi 30 60 1
Sarah Baartman 41 48 3
Amatole 41 82 1
377 507
Table 2: Comparison of 2017 and 2018 professional nurses’ community service allocation
There has been a significant increase in professional nursing posts in the EC. Alfred Nzo,
Chris Hani and Amatole districts which all experience high levels of deprivation have gained
in the number of posts they will be receiving in 2018. There has also been a strong attempt
to direct placements to rural facilities in the province. However some maldistribution still
exists. Buffalo City which is one of the least deprived districts will be benefitting from an
increase; from 17 to 27 posts whilst OR Tambo district which has a high level of deprivation,
has lost 25 posts from last year.
106.5. Pharmacists
PHARM CS PHARM CS Deprivation
DISTRICT Allocation Allocation 1 = Most Deprived
5 = Least deprived
2017 2018
Nelson Mandela 8 3 5
Bay Metro
Buffalo City 2 1 4
OR Tambo 19 10 1
Alfred Nzo 9 8 1
Chris Hani 3 13 1
Joe Gqabi 3 7 1
Sarah Baartman 7 8 3
Amatole 8 13 1
59 63
Table 3: Comparison of 2017 and 2018 pharmacist community service allocation
Similarly to the medical officer allocation, the overall number of pharmacists allocated to the
Eastern Cape has increased, albeit minimally from 59 to 63. Despite the increase, the OR
Tambo district will be receiving 9 less pharmacists than 2017. The allocation to Alfred Nzo
has also dropped. Despite the Joe Gqabi district having the same level of deprivation as
Amatole district; it will be receiving approximately half the number of community service
pharmacists.
6.6. Rehabilitation
It must be noted that rehabilitation workers often comprise smaller graduating numbers than
medicine and nursing. This impacts service delivery as many facilities, especially in rural
areas are often completely reliant on community service therapists in the absence of any
permanent therapists. Disability is more prevalent in rural and poor areas 7 and therefore
rehabilitation services cannot be confined to metropolitan areas at the expense of unmet
need in other areas. A comparison of 2017 and 2018 community service allocation for the
7
RHAP. Rural Health Fact Sheet 2015. Johannesburg : 2015.
11following disciplines follows: occupational therapy, physiotherapy, speech therapy and
audiology.
6.6.1 Occupational therapists
OT CS OT CS Deprivation
DISTRICT Allocation Allocation 1 = Most Deprived
2017 2018 5 = Least deprived
Nelson 10 5 5
Mandela
Bay Metro
Buffalo City 3 4 4
OR Tambo 9 9 1
Alfred Nzo 0 4 1
Chris Hani 2 6 1
Joe Gqabi 1 3 1
Sarah 7 3 3
Baartman
Amatole 3 4 1
35 38
Table 4: Comparison of 2017 and 2018 occupational therapy community service allocation
The overall number of occupational therapists allocated to the Eastern Cape has only
increased by 3 posts, 35 to 38. Alfred Nzo district benefitted from an increase from 0 OTs in
2017 to 4 in 2018. The Chris Hani district also benefitted, relative to the overall provincial
allocation from 2 to 6. Buffalo City, Joe Gqabi and Amatole experiences minimal increases. It
must be noted that despite the overall increase for 2018, 38 OTs is far too small a number.
Bearing in mind, the large distances therapists would have to traverse to perform outreach in
clinics and households. Further, despite the increase, Isilimela Hospital which was allocated
a community service OT last year will not be receiving one in 2018. Taking into account that
Isilimela also has no permanent posts, this shows a complete disregard for the continuity of
care, as patients will not be able to travel out of catchment to the next closest hospital for
rehabilitation.
126.6.2. Physiotherapists
PT CS PT CS Deprivation
Allocation Allocation 1 = Most Deprived
DISTRICT
2017 2018 5 = Least deprived
Nelson 10 9 5
Mandela
Bay Metro
Buffalo City 5 4 4
OR Tambo 11 11 1
Alfred Nzo 3 3 1
Chris Hani 2 3 1
Joe Gqabi 1 2 1
Sarah 6 1 3
Baartman
Amatole 4 3 1
42 36
Table 5: Comparison of 2017 and 2018 physiotherapist community service allocation
The overall number of physiotherapists has decreased from 42 to 36. Apart from the OR
Tambo district, the other districts have either benefitted minimally or not at all. Similar to the
OT allocation; certain facilities will have to forego services that were previously implemented.
Case in point, Isilimela Hospital has not been allocated a physiotherapist for this year.
Because the service was provided solely by a community service physiotherapist last year
and no permanent therapist has been allocated, there will be no physiotherapy services for
the hospital and the catchment of approximately 100 000 will not have access to this service.
Every attempt should be made to ensure that services are not discontinued once a need for
the service has been established in an area.
136.6.3. Speech therapy
ST CS ST CS Deprivation
DISTRICT Allocation Allocation 1 = Most Deprived
2017 2018 5 = Least deprived
Nelson
0 1 5
Mandela
Bay Metro
Buffalo City 0 2 4
OR Tambo 1 2 1
Alfred Nzo 0 0 1
Chris Hani 0 1 1
Joe Gqabi 0 0 1
Sarah 0 0 3
Baartman
Amatole 0 1 1
1 7
Table 6: Comparison of 2017 and 2018 speech therapy community service allocation
Speech therapy allocation has increased from 1 to 7. Despite the increase, the overall
number is still grossly insufficient and districts with high levels of deprivation such as Alfred
Nzo and Joe Gqabi have not been allocated any speech therapists at all.
It must be clarified and strongly reinforced that for a proper rehabilitation service to exist in a
facility, all rehabilitation disciplines are required, not just the presence of physiotherapy or
occupational therapy. Many patients that require rehabilitation will often need the combined
services of occupational therapy, physiotherapy and speech therapy. If only one of these
disciplines exists at the hospital, the patient will still have to travel to another facility to
access the other services. This is not logical nor does it benefit the patient. Therefore the
extremely small number of speech therapists allocated to the province is deeply worrying.
Speech therapists play a pivotal role in the management of patients with feeding and
swallowing difficulties, often found in individuals with neurological deficits such as cerebral
palsy. They are able to offer lifesaving interventions which no other discipline is trained to
perform and therefore the dismal figures representing their profession in EC must not be
taken lightly.
146.6.4. Audiology
AUDIO CS AUDIO CS Deprivation
DISTRICT Allocation Allocation 1 = Most Deprived
2017 2018 5 =Least deprived
Nelson 1 1 5
Mandela
Bay Metro
Buffalo 0 0 4
City
OR Tambo 1 3 1
Alfred Nzo 0 0 1
Chris Hani 0 2 1
Joe Gqabi 0 0 1
Sarah 0 1 3
Baartman
Amatole 1 1 1
3 8
Table 7: Comparison of 2017 and 2018 audiology community service allocation
The number of audiologist placements increased from 3 in 2017 to 8 in 2017. Some attempts
to direct posts to deprived districts are seen in OR Tambo, Chris Hani and Amatole. There
has however been a strong preference towards urban facilities with five of the eight posts
being in urban. The gross number is insufficient when we consider the burden of TB in the
province and the associated risk of hearing impairment stemming from ototoxicity. This
would necessitate a far larger number of audiologists than the present.
156.6.5. Dual qualified speech therapy and audiology
DISTRICT S/AUDIO CS S/AUDIO CS Deprivation
Allocation Allocation 1 = Most Deprived
2017 2018 5 = Least deprived
Nelson Mandela 5 0 5
Bay Metro
Buffalo City 2 0 4
OR Tambo 3 0 1
Alfred Nzo 0 0 1
Chris Hani 1 0 1
Joe Gqabi 0 0 1
Sarah Baartman 1 0 3
Amatole 2 0 1
14 0
Table 8: Comparison of 2017 and 2018 speech therapy and audiology (dual qualified) community service
allocation
The data available for the 2018 allocation of community service officers in the Eastern Cape
did not have any data on dual qualified speech therapists and audiologists. It is uncertain
whether this group of cadres were classified incorrectly or no dual qualified speech
therapists and audiologists were actually allocated to the Eastern Cape.
7.1. An overview of the North West Province community service allocations
The North West province comprises 4 health districts. Dr Ruth Segomotsi Mompati is the
most deprived, followed by Ngaka Modiri Molema, Bojanala and lastly Kenneth Kaunda,
which is the least deprived but has pockets of high levels of deprivation. The NW province
has the second highest maternal mortality in facility ratio in the country with KK and Dr. RSM
districts well above the national average.8The HIV testing coverage for NW is below the
national average (35.9).9 It also has among the highest disability prevalence nationally.10
8
Massyn N, Padarath A, Peer N, Day C. District Health Barometer 2016/17, PG 56. Durban: Health Systems
Trust.
9
Massyn N, Padarath A, Peer N, Day C. District Health Barometer 2016/17, PG 176. Durban: Health Systems
Trust.
10
Stats SA Census 2011.
16Two out of the four NW districts viz. NMM and Bojanala scored below the national average
for percentage of ideal clinics.11
7.2. Medical Officers
MO CS MO CS DEPRIVATION
DISTRICT Allocation Allocation Rural Urban 1 = Most
2017 2018 deprivation
5 = Least
deprivation
Bojanala 37 46 3
NMM 3 28 2
KK 68 69 59 104 4
Dr. RSM 0 16 1
108 159
Table 9: Comparison of 2017 and 2018 medical officer community service allocation
The North West province has benefitted from a significant increase in medical officer
community service officer (CSO) allocations. However despite this increase, the least
deprived districts (Bojanala and KK) have been allocated the bulk of the CSOs whilst the
districts with the highest levels of deprivation have received small figures. The allocation has
also strongly favoured urban health facilities; urban areas have received almost twice as
many medical officers as rural areas. According to the 2015/16 edition of the DHB, only 50%
of residents in Dr. RSM district have access to a medical officer at PHC level. The NMM
district fares slightly better at 69.2%. However both districts are below the national average
(74.2%).12 This is concerning. Community service officers placed at district hospitals must
have organised outreach programmes to primary health clinics to manage complicated
cases.
11
Massyn N, Padarath A, Peer N, Day C. District Health Barometer 2016/17. PG 28. Durban: Health Systems
Trust.
12
Massyn N, Peer N, English R, Padarath A, Barron P, Day C. District Health Barometer 2015/16. Durban: Health
Systems Trust. The most recent version of the District Health Barometer did not report on this outcome and
therefore data from the 2015/16 edition was used.
177.3. Professional nurses
PN CS PN CS DEPRIVATION
DISTRICT Allocation Allocation Rural Urban 1 = Most
2017 2018 deprivation
5 = Least
deprivation
Bojanala 39 106 3
NMM 6 100 2
KK 53 85 267 123 4
Dr. RSM 0 99 1
98 390
Table 10: Comparison of 2017 and 2018 professional nurses community service allocation
The North West province has received a significant increase in professional nurses across
all districts; almost 4 times greater than 2017. There has been a strong attempt to direct
posts to the most deprived districts (NMM and Dr. RSM). Bojanala district, however, has the
highest allocation, despite being one of the least deprived districts in NW. Rural areas will be
receiving more than twice the number of professional nurses compared to urban areas. The
large number of professional nurses allocated to NW also brings into question whether
distribution of PNs to other provinces has been compromised.
7.4. Pharmacists
PHARM PHARM Deprivation
DISTRICT CS CS Rural Urban 1 = Most
Allocation Allocation Deprived
2017 2018 5 = Least
deprived
Bojanala 8 27 3
NMM 10 23 2
KK 14 19 52 28 4
Dr. RSM 0 11 1
32 80
Table 11: Comparison of 2017 and 2018 pharmacists community service allocation
18The pharmacist allocation has more than doubled from 2017 to 2018. There has been an
attempt to direct posts to the most deprived districts (NMM and Dr. RSM). Bojanala district
however has the highest allocation, despite being one of the two least deprived districts in
the province. The two less deprived districts (Bojanala and KK) were allocated 12 more
pharmacists than the two most deprived districts (NMM and Dr. KK). This still shows a
preference for the less deprived districts in the province. However from the rural/urban
allocation, there has been a strong attempt to place community service pharmacists in rural
areas; rural areas will be receiving double the number of pharmacists than urban areas.
7.5. Occupational therapists
OT CS OT CS Deprivation
DISTRICT Allocation Allocation Rural Urban (1 = Most
2017 2018 Deprived;
5 = Least
deprived)
Bojanala 10 7 3
NMM 0 6 2
KK 17 9 12 14 4
Dr. RSM 0 4 1
27 26
Table 12: Comparison of 2017 and 2018 occupational therapists community service allocation
The overall allocation for occupational therapy in the province this year is poor. Not only has
North West province received fewer therapists than last year but the least deprived districts
will be receiving the highest allocation (Bojanala and KK). Allocation to urban has also been
favoured over rural. It must be acknowledged that NMM and Dr. RSM were not allocated any
occupational therapists in 2017 and thus the current allocation of 6 and 4 respectively will be
a great benefit to these districts. However these numbers are nowhere close to being able to
address the need in these districts, taking into account the high disability prevalence in the
province.
197.6. Physiotherapists
PT CS PT CS Deprivation
DISTRICT Allocation Allocation Rural Urban (1 = Most
2017 2018 Deprived;
5 = Least
deprived)
Bojanala 12 10 3
NMM 2 8 2
KK 14 10 19 15 4
Dr. RSM 0 6 1
28 34
Table 13: Comparison of 2017 and 2018 physiotherapists’ community service allocation
Physiotherapy has benefitted from a minimal increase of 4 physiotherapy community service
placements. The least deprived districts have received the highest number of
physiotherapists (Bojanala and KK). There has been an attempt to direct posts to rural
areas; rural outnumbers urban by 4 community service officers. It has been noted that a
large number of physiotherapists have been allocated to district hospitals rather than clinics.
Community service therapists are often placed at district level hospitals because of the direct
supervision they will receive. However it is still strongly recommended that these therapists
conduct outreach services in the community. Roving teams of therapists overseen by an
experienced therapist is one such strategy of providing rehabilitation services to rural and
underserved communities.
207.7. Speech therapists
ST CS ST CS Deprivation
DISTRICT Allocation Allocation Rural Urban (1 = Least
2017 2018 Deprived;
5 = Most deprived)
Bojanala 4 4 3
NMM 1 4 2
KK 8 2 6 5 4
Dr. RSM 0 1 1
13 11
Table 14: Comparison of 2017 and 2018 speech therapists community service allocation
The province has experienced a decline in speech therapy posts from 2017. The overall
number is extremely poor and insufficient in addressing the needs of the province. The most
deprived district (Dr. RSM) has received the smallest allocation of only a single speech
therapist. It must also be noted that rural health facilities typically have fewer permanent
therapists and it could very well be that the single speech therapist in Dr. RSM may be
responsible for servicing a very large catchment. Healthcare workers rely heavily on peer
support in the early stages of their career and therefore it is counterproductive to place a
single community service speech therapist in a district. Similar to the physiotherapy
allocation, we find the majority of speech therapy allocations have been to hospitals.
7.8. Audiologists
Audio CS Audio CS Deprivation
Allocation Allocation Rural Urban 1 = Most
DISTRICT
2017 2018 Deprived
5 = Least
deprived
Bojanala 6 1 3
NMM 0 3 2
KK 4 4 5 5 4
Dr. RSM 0 2 1
10 10
Table 14: Comparison of 2017 and 2018 audiologists community service allocation
21The 2018 audiologist figures are not a true reflection of the actual number placed. According
to a reliable source from the NW Human Resources, 7 audiologists were placed. This shows
a decline in placements from 2017. Similar to the speech therapy allocations, the overall
number of audiologists is insufficient in addressing the need within the province. It was also
found that audiologists were also predominantly placed in hospital facilities and not clinics.
It was found that multiple community service officers were placed in the same urban health
facility in the least deprived districts in the province; in the case of Job Shimankana Tabane
Hospital in Rustenburg in Bojanala district and Klerksdorp Provincial Hospital in Kenneth
Kaunda district. This reflects maldistribution as it is very likely that these larger hospitals in
urban areas would already have permanent therapists.
8. Conclusion
Community service posts are not a long term solution to the ongoing and persistent HRH
shortages. Community service officers only fulfil a one year contract and therefore the
creation and filling of permanent posts for healthcare workers must be done.
There is a strong preference for health science students to apply to urban facilities. After
round 1, it was found that most of the facilities in urban areas had been filled. This is
contradictory to the ethos of community service, which was envisioned to supplement staff
shortages in rural and underserved areas.
There is a low baseline of healthcare workers produced every year. This small figure is then
rationed across 9 provinces. This is particularly evident in the allied health professions
(occupational therapy, physiotherapy, speech therapy and audiology).
It has come to our attention that community service officers are declining placements
because of inadequate/absent accommodation. Ganyesa Hospital in the North West has lost
two community service pharmacists because of a lack of suitable accommodation.
The imminent return of Cuban trained South African doctors into the SA public health system
has triggered speculation that funding allocated for allied health workers will be used to pay
the doctors’ salaries. Rehabilitation workers are already a scarce skill in South Africa and
this move will only lead to the further decline of health in the country.
229. Recommendations
THE CURRENT SITUATION
Gross maldistribution of community
It must be reiterated that the goal of community service is to supplement HRH in rural and
service officers in favour of urban and
underserved areas. There has been an attempt to allocate lesscommunity
deprivedservice officers to
districts
these areas. However this is not done consistently across all cadres.
Evidence of regression of health
servicesfrom
Despite clear policy on community service allocations and support in rural
the health
ministerfacilities
of
health, Dr. Aaron Motsoaledi, on the urgent need to prioritise rural THE
and underserved
WAY FORWARD areas,
there has been a lack of enforcement, where allocation is in favour of urban and less
Strict and urgent compliance to
deprived districts. In addition, many urban hospitals are NDoH to allocate CSOs in rural areas
benefitting from numerous community service officers.
Provincial departments must reduce
community service posts in urban
There has been a trend for applicants to choose
areas and increase posts in rural
employment in urban areas and their decision cannot areas. Provincial departments must
be faulted if these placements have available posts. provide funding for these posts
However this outcome is contrary to the community Resource prioritization must occur in
service allocation policies and the directive from a manner that favours rural and
national department of health to prioritise rural facilities. underserved areas
To ensure that applicants are not choosing urban Mindshift change: Community service
facilities at the expense of service delivery in rural officers must realise community
service is a duty and should not be
areas, urban placements must not be listed on the
granted the privilege to decide where
ICSP system unless a need has been identified in they would like to be placed
these areas. In essence, the provision of equitable
access to health services must not be dependent on
the preference of an individual to decide whether they
would like to serve in a certain community. A realistic
goal to work towards would be a 90/10 split in favour of
rural communities. The 10% can be allocated to
underserved communities within urban areas.
It must be reinforced that a well functioning health
system is dependent on all levels of care being
appropriately resourced. Higher levels of care depend on lower levels for up-referrals.
Ensuring strong capacity at PHC level prevents district hospitals from being overwhelmed
with patients and more importantly, ensures patients can access health services
conveniently.
23As is the case with NW, ringfencing of funds for community service officers is strongly
encouraged to ensure sufficient funding for the placement of community service officers.
Supportive environments are necessary to attract healthcare workers. Healthcare workers
need suitable accommodation as well as mentorship to guide them in the early years of their
career. In our work in rural health, we have found those health facilities which offer good
mentorship, opportunities for career progression and specialisation, suitable accommodation
and a social environment that is appealing to healthcare workers fare much better in
recruiting healthcare workers. These factors must be strongly considered because failure to
do so will only further enlarge the gap in HRH inequities across rural and urban areas. This
is especially relevant to healthcare workers who have completed their community service
and who are not obligated to return to the public sector.
The allocation of community service officers must be done based on need. Resource
prioritization must be done in a manner that favours rural and underserved areas.
A clear strategy for HRH acquisition and retention must be defined. This strategy must not
rely solely on community service officers for a quality service to exist. The allocation of allied
health professionals requires serious and urgent attention.
Kindly contact Karessa Govender from RHAP for any queries regarding the findings from
this report:
Landline: 010 601 7427 Ext 103
Fax number: 010 591 0499
Cell: 084 524 8450
Email: karessa@rhap.org.za
Web: www.rhap.org.za
Twitter: RHAPNews
Facebook: Rural Health Advocacy Project
24You can also read