Challenges Faced by India in Containing COVID-19 - sersc
←
→
Page content transcription
If your browser does not render page correctly, please read the page content below
International Journal of Advanced Science and Technology
                                                                                 Vol. 29, No. 9s, (2020), pp. 4513-4522

                    Challenges Faced by India in Containing COVID-19
                                              Neha Goel
                 Research Scholar, Faculty of Management Studies, University of Delhi

                                                      Abstract
In this paper we will discuss the challenges faced by India to fight against novel coronavirus. We shall also
discuss the impact of COVID-19 on Indian economy and its poor people and migrant workers. We will see
that the impact is significant if the virus is not contained soon. COVID-19 has affected countries globally due
to lockdown measures and it is bound to create a ripple effect worldwide. World Health Organization
(WHO), on 11th March, 2020, declared COVID-19 as a global pandemic when more and more countries
experienced community transmission and clusters of cases and affected around 110 countries with 1,18,000
cases worldwide. The Prime Minister of India, Shri Narendra Modi, announced a nation-wide lockdown on
24th march 2020 which is taking a toll on the lives of poor and daily wage earners. India’s health spending
as a share of GDP is very less as compared to other countries. Short supply of personal protective equipment
(PPE) for the frontline medical staff like masks, goggles, face shields, copper equipment, gloves and
disinfectant wipes is a big concern amid this pandemic outbreak making the health care workers vulnerable.
Short supply of such equipment has led to black-marketing of such products and even inflated prices of
products like hand sanitizer and face masks. Some manufacturers are also coming up with fake products.
There are many migrant workers stuck in metro cities without any shelter, job or income. In this paper, we
will discuss the measures taken by different states in India to tackle such problems and how India can
prepare itself for future health calamities and pandemics.
Keywords: COVID-19, Coronavirus, India, health, migrant workers

ABBREVIATIONS
WHO: World Health Organization
GDP: Gross Domestic Product
OOPE: Out-Of-Pocket Expenditure
CHE: Current Health Expenditure
PPP:    Purchasing Power Parity
EAG: Empowered Action Group
GSDP: Gross State Domestic Product
UHC: Universal Health Coverage
INTRODUCTION
Health care sector has made huge progress over the last centuries, but infectious diseases like malaria and
influenza still possess great threat to modern societies. COVID-19 is a newly discovered infectious disease
caused by the novel coronavirus. On 14th May, 2020, it has reportedly infected 4,248,389 people over 213
countries with death toll reaching 294,046. As per situation report-114 published by the WHO, USA is on the
top list with 1,322,098 confirmed cases and 80,695 deaths while India reported 81,997 confirmed cases with
2,649 deaths as of 14thMay, 2020 [1]. The WHO director-general, Dr. TedrosAdhanom Ghebreyesus, stated
that COVID-19 was not just a health crisis, but a crisis that will hurt every sector. World Health Organization
(WHO), on 11th March, 2020, declared COVID-19 as a pandemic when more and more countries
experienced community transmission and clusters of cases [2] and affected around 110 countries with
1,18,000 cases worldwide [3]. As per WHO, a pandemic is a global spread of new disease.
To prevent the spread of the contagion India’s prime minister, Shri Narendra Modi, announced a nation-wide
lockdown on 24th march 2020 invoking the examples of other coronavirus hit countries. A lockdown may
minimize transmission of coronavirus, leading to severe acute respiratory syndrome. These social distancing
measures will help in flattening the curve (slow down the rate of infection). However, without a supporting
health infrastructure, the casualty rate is likely to rise. Short supply of personal protective equipment (PPE)

                                                                                                              4513
ISSN: 2005-4238 IJAST
Copyright ⓒ 2020 SERSC
International Journal of Advanced Science and Technology
                                                                                Vol. 29, No. 9s, (2020), pp. 4513-4522

for the frontline medical staff like masks, goggles, face shields, copper equipment, gloves and disinfectant
wipes is making the health care workers vulnerable. Indian doctors are not even getting most basic protection
gears to protect themselves from being infected. They are wearing helmets and raincoats to treat COVID-19
patients [4]. Safety of the health care workers is a must as they can’t be manufactured urgently and neither
can they put their 100% for long. In the pandemic condition, the healthcare workforce is the most valuable
resource for any country.
The lockdown situation is also taking a toll on the lives of poor and daily wage earners. Although, the
government is ensuring that they will be taken care of through their various relief packages. However, it
won't reach each and every individual and even the government is facing problems with funds. Many migrant
workers in India are stuck in the metro cities homeless and without any job or savings. We have seen them
coming out in the streets of Delhi and Mumbai to appeal the government to send them back to their
hometown. This is making it difficult for the government to follow social distancing measures to contain the
spread of the disease.
DEMOGRAPHIC IMPACT OF COVID-19 IN INDIA
As we can see from figure 1 below, COVID-19 has hit the people aged between 31-40 more as compared to
other age groups. This may be because they have more travel history. From, figure 2, we can see that males
are more infected by COVID-19 as compared to females.
                  Fig.1: Total no. of people infected as per different age groups in India

                            Source: https://www.covid19india.org/demographics
                    Fig. 2: No. of male and female infected as per different age groups

                            Source: https://www.covid19india.org/demographics

                                                                                                             4514
ISSN: 2005-4238 IJAST
Copyright ⓒ 2020 SERSC
International Journal of Advanced Science and Technology
Vol. 29, No. 9s, (2020), pp. 4513-4522
Fig. 3: No. of people deceased/recovered due to COVID-19 as per different age groups in India
Source: https://www.covid19india.org/demographics
Table1: No. of people deceased/recovered as per gender
Gender Deceased Recovered Grand Total
F 110 42 152
M 206 66 272
Grand Total 316 108 424
Source: https://www.covid19india.org/demographics
HEALTH CARE INDICATORS IN INDIA COMPARED TO OTHER NATIONS
Health sector have always been neglected in India. India shows low numbers in terms of health indicators. As
of 14th May April, 2020, number of confirmed coronavirus cases in India is 78,003with 2,549 deaths due to it
[5]. India is the second most populous country in the world and thus inequality is bound to exist within
income groups. India ranks 115 among 157 countries in terms of Human Capital Index (HCI), much below
other lower income countries like Vietnam, Sri Lanka, Philippines, Indonesia, Kenya, Bangladesh and
Myanmar [6]. In the next section we will compare various health indicators of India with developed countries
like UK, Canada, USA, Singapore etc. and neighboring countries like Pakistan, Nepal, China, Bangladesh,
Myanmar and Bhutan. We will see that India’s numbers lag behind the world average. From Table 1 in the
appendix, we see that Current Health spending Per Capita, PPP (in $) was just $233 in India whereas, world
average was $1355, while United States spent the highest amount per capita, PPP i.e. $9941 on health care in
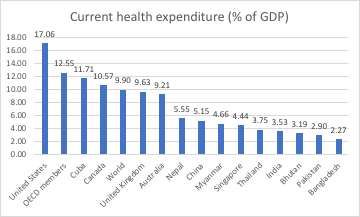
2016. Out-of-pocket (OOP) expenditure as a percentage of current health expenditure was 62.40 in India,
much higher than the developed nations like USA, UK, Canada and neighboring countries like China, Sri
Lanka, Nepal and Pakistan, while world average was 18.6 in 2017. Hospital beds (per 1000 population) was
just 0.7 per 1000 population in India, much lower than the developed nations like USA, UK, Canada and
neighboring countries like China, Sri Lanka, Bhutan and Myanmar, while world average was 2.7 per 1000
population in 2011. Current Health Expenditure as a percentage of Gross Domestic Product was 3.53% in
India, much lower than the developed nations like USA, UK, Canada and neighboring countries like China,
Myanmar, Nepal and Thailand, while world average was 9.9% in 2017 [7].
Fig.4: Life expectancy (at birth)
4515
ISSN: 2005-4238 IJAST
Copyright ⓒ 2020 SERSCInternational Journal of Advanced Science and Technology
Vol. 29, No. 9s, (2020), pp. 4513-4522
Fig.5: OOPE (as % of CHE)
Fig.6: Hospital beds (per 1000 population)
Fig.7: Current health expenditure (% of GDP)
4516
ISSN: 2005-4238 IJAST
Copyright ⓒ 2020 SERSCInternational Journal of Advanced Science and Technology
Vol. 29, No. 9s, (2020), pp. 4513-4522
When health systems of developed countries like US and UK with great health care indicators have failed
during COVID-19 outbreak, India’s low numbers may just be because of low tests. Where total COVID-19
tests per 1000 people is 28.81 in Italy and 28.24 in USA, India lags far behind with just 1.27 tests per 1000
people as on May 12, 2020 [8]. Some countries which have successfully managed COVID-19 are Germany,
Japan, Singapore and South Korea. They first performed large number of COVID-19 tests on its population,
followed by contact tracing and finally isolated and quarantined people with positive results and people who
came in close contact with the infected individuals. US had just tested 5 people per million population when
South Korea had tested around 4000 people per million of its population, although both the countries
reported their first case around January 20) [9]. Lockdown might be the last option but India has limited
resources and spends meagerly on health care. Thus, being the cheaper option, India might have chosen to
lockdown the economy first.
HEALTH SPENDING WITHIN INDIA
In 2015-16, government spending on health care was 1.02% as a share of GDP which is more or less the
same since 2009-10 (Fig. 8). The centre-state ratio in total public expenditure on health was 31:69 in 2015-
16. In the year 2016-17, only 34% of Indians had health insurance coverage out of which 80% of persons
were covered under Government sponsored health schemes. Among the states, public health expenditure as a
percentage of GSDP was highest for North Eastern States at 2.76% whereas, 1.36% and 0.76% for EAG
(including Assam) and non-EAG states [10]1.If we look at the coronavirus cases across country, we see that
Maharashtra is the worst hit with 25922 confirmed cases and 975 deaths as on 14th May, 2020. Second on the
list is Gujarat with 9267 confirmed cases and 566 deaths as on 14th May April, 2020 [5](appendix Table
2).COVID-19 average fatality rate in India is 3.3 percent, Fatality Rate due to coronavirus in Maharashtra
was 3.8% and Gujarat was6.1%, Madhya Pradesh was 5.5% and as high as 9% in West Bengalas on 14th
May, 2020 (as per the number of confirmed cases and deaths in Table 2 in appendix).
Fig.8: Public Health Expenditure in India as Percentage of GDP
Coronavirus numbers in Maharashtra is worrisome. However, if we look at state health expenditure data
among the largest states in India (from Table 3 in the appendix), Maharashtra spends the least (barely 0.6%)
of its gross state domestic product, however, North-eastern states spends 2.6%, way ahead than their bigger
counterparts. Among the big ones, health spending as a percentage of GSDP in Rajasthan and Uttar Pradesh
was double than that of Maharashtra. Maharashtra also has big population density with largest clusters due to
large number of slum-dwellers (second largest i.e. 11.94 crores population after Uttar Pradesh). Thus,
Maharashtra is badly hit because of more people, slums, less money and rampaging virus.
1
EAG states: as per census 2001, there were 8 Empowered Action Group States namely, Bihar, Jharkhand,
Uttar Pradesh, Uttarakhand, Madhya Pradesh, Chattisgarh, Odisha and Rajasthan).
4517
ISSN: 2005-4238 IJAST
Copyright ⓒ 2020 SERSCInternational Journal of Advanced Science and Technology
Vol. 29, No. 9s, (2020), pp. 4513-4522
CONDITION OF MIGRANT WORKERS IN INDIA DURING LOCKDOWN
The announcement of lockdown created havoc among the migrant workers in the metro cities. They were
misinformed and created panic in the lockdown situation. It is no surprise that over half of India’s daily wage
and migrant workers earns as low as Rs. 200-400 per day which is much lower than the prescribed minimum
wage of Rs. 692 for skilled, Rs. 629 for semi-skilled and finally Rs. 571 for the unskilled ones (in Delhi)
[11]. With almost 400 million informal workers, comprising daily wage laborers like construction workers,
waiters, cooks etc., the lockdown has severely hit the poor population in India. Around 100 million workers
had no shelter or food and there were no transportation facilities for the migrant workers to return back to
their villages [12].
Due to lockdown they are completely unemployed and are eager to move to their villages as they see their
survival in metro cities to be difficult. They have little savings with them which they wish to spend on their
journey to home. Apparently, this is making it difficult for the government to follow social distancing
measures to contain the spread of deadly virus.
Government has announced a Rs. 1.7 lakh crores package (around 1% of GDP) [13] under Prime Minister
Garib Kalyan Yojana, for the poor hit by the lockdown to alleviate their pain during this pandemic but half of
them are not aware of the government schemes or how to access them, many of them don't possess BOCW
cards which is necessary to access the relief packages of the government. This way a large population of
these workers would be excluded from the relief and they continue to face the misery that lockdown has
brought them.
RIGHT STEPS TAKEN
Talking about some positive side, India scored a perfect 100 on the “Oxford COVID-19 Government
Response Tracker (OxCGRT)” along with other countries like South Africa, Israel, New Zealand and
Mauritius. India followed the strategy of “prevention is better than cure”. India was quick to activate its
health management system and follow steps like issuing travel advisories, initiated screening of the people
coming from affected countries in January, government tracked the travel history of foreign travelers through
home visits and phone calls, announcement of proper hygiene measures through phone calls and
advertisements to stay safe from this pandemic, quarantine orders for people returning from foreign countries
etc. Government also announced Rs. 50 lakh of health insurance per person for the health professionals at the
frontlines of fighting COVID-19 outbreak [13]. India has emerged as the largest supplier of generic
medicines worldwide over the last few decades. During this COVID-19 outbreak also, India is exporting
hydroxychloroquine to countries all over the world. In this pandemic situation, various non-medical
equipment companies have come together to manufacture ventilators and other equipment. Indian railways
have produced lakhs of masks and thousands of litres of sanitizers in March [14]. Car manufacturers like
Hyundai India, Maruti and Mahindra have joined hands with other global automobile manufacturers to
increase the production of ventilators [15].
CONCLUSION
Thus, health infrastructure in India is in a really bad state. With changing climate and increasing
globalization, new epidemics are likely to happen. So, the government and policymakers should focus on
investing on education and health infrastructure and take it as a matter of priority. Government health
spending as a percentage of GDP should increase. Government should encourage people to follow
cleanliness and hygiene routine by implementing some awareness programs along with
ongoingSwachhBharat Abhiyan which may positively impact the health of the society. Policy makers should
also focus on public private partnerships and investment in government infrastructure. One of the major
measures that can be taken by the government is to focus on internalizing pharma supply chain and focus on
make-in-India for medical equipment. India has emerged as the largest supplier of generic medicines
worldwide over the last few decades. However, India still has to depend on Chinese medical equipment and
products (for example, Penicillin-G) and finding an alternative turns out to be expensive but still progress can
be made towards it.Eventually, the pandemic will go but the equipment will stay which will help in
betterment of healthcare delivery in India. There are lot of jobless migrant workers due to this COVID-19
outbreak. Government can take measures to hire these workers with proper training and material to make
such equipment, thus protecting the health care providers, controlling the prices and reducing dependency on
imports of these equipment, thus boosting the economy. This will make the economy self-reliant and
prepared for any future outbreak of pandemics.
4518
ISSN: 2005-4238 IJAST
Copyright ⓒ 2020 SERSCInternational Journal of Advanced Science and Technology
Vol. 29, No. 9s, (2020), pp. 4513-4522
REFERENCES
[1] Cited from https://covid19.who.int. (accessed on 14th May, 2020)
[2] Cited from http://www.euro.who.int/en/health-topics/health-emergencies/coronavirus-covid-
19/news/news/2020/3/who-announces-covid-19-outbreak-a-pandemic. (accessed on 14th May, 2020)
[3] Cited from https://time.com/5791661/who-coronavirus-pandemic-declaration/. (accessed on 14th May,
2020)
[4] Cited from https://curlytales.com/indian-doctors-nurses-wear-raincoats-helmets-to-treat-covid-19-
patients-due-to-lack-of-protective-gear/. (accessed on 14th May, 2020)
[5] Cited from https://www.mohfw.gov.in. (accessed on 14th May, 2020)
[6] Cited from https://www.worldbank.org/en/publication/human-capital#Viz. (accessed on 14th May,
2020)
[7] Cited from http://datatopics.worldbank.org/universal-health-coverage/coronavirus/. (accessed on 14th
May, 2020)
[8] Cited from https://ourworldindata.org/grapher/full-list-cumulative-total-tests-per-thousand. (accessed
on 14th May, 2020)
[9] Cited from https://hbr.org/2020/03/why-is-the-u-s-behind-on-coronavirus-testing. (accessed on 14th
May, 2020)
[10] Cited from https://censusindia.gov.in/vital_statistics/AHSBulletins/files/AHSpr.pdf.(accessed on 14th
May, 2020)
[11] Cited from https://qz.com/india/1833814/coronavirus-lockdown-hits-india-migrant-workers-pay-food-
supply/. (accessed on 14th May, 2020)
[12] Cited from https://www.csmonitor.com/World/Asia-South-Central/2020/0413/What-a-lockdown-
means-when-home-is. (accessed on 14th May, 2020)
[13] Cited from https://www.livemint.com/news/india/covid-19-centre-announces-rs-1-7-trillion-package-
for-migrant-workers-poor-11585207289279.html. (accessed on 14th May, 2020)
[14] Cited from https://www.thehindubusinessline.com/economy/logistics/indian-railways-produced-over-
28-lakh-masks-and-25000-litres-of-sanitizers-in-march/article31254823.ece. (accessed on 14th May,
2020)
[15] Cited from https://asiatimes.com/2020/04/indias-carmakers-enter-global-ventilator-race/. (accessed on
14th May, 2020)
[16] Cucinotta, D., &Vanelli, M. (2020). WHO declares COVID-19 a pandemic. Acta bio-medica:
AteneiParmensis, 91(1), 157-160.
[17] World Health Organization. (2020). Coronavirus disease 2019 (COVID-19): situation report, 114.
[18] Lancet, T. (2020). COVID-19: protecting health-care workers. Lancet (London, England), 395(10228),
922.
[19] Economic impact of epidemics and pandemics. Available from
https://www.europarl.europa.eu/RegData/etudes/BRIE/2020/646195/EPRS_BRI(2020)646195_EN.pdf
(accessed on 14th May, 2020)
[20] Understanding the coronavirus pandemic through data. Available from
http://datatopics.worldbank.org/universal-health-coverage/coronavirus/. (accessed on 14th May, 2020)
[21] Data on COVID-19 tests. Availablefrom https://ourworldindata.org/grapher/full-list-cumulative-total-
tests-per-thousand. (accessed on 14th May, 2020)
[22] Why is the US behind on coronavirus testing? Availablefrom https://hbr.org/2020/03/why-is-the-u-s-
behind-on-coronavirus-testing. (accessed on 14th May, 2020)
[23] Coronavirus pandemic: India’s poor healthcare spending is hurting the fight. Availablefrom
https://www.moneycontrol.com/news/economy/policy/coronavirus-pandemic-indias-poor-healthcare-
spending-is-hurting-the-fight-5123081.html. (accessed on 14th May, 2020)
[24] Coronavirus pandemic: India’s measly investment in healthcare may come back to haunt it.
Availablefrom https://www.moneycontrol.com/news/trends/health-trends/coronavirus-pandemic-
indias-measly-investment-in-healthcare-may-come-back-to-haunt-it-5066611.html. (accessed on 14th
May, 2020)
[25] Long-term impact of COVID-19 pandemic on healthcare scenario in India. Availablefrom
https://www.expresspharma.in/guest-blogs/long-term-impact-of-covid-19-pandemic-on-healthcare-
scenario-in-india/. (accessed on 14th May, 2020)
4519
ISSN: 2005-4238 IJAST
Copyright ⓒ 2020 SERSCInternational Journal of Advanced Science and Technology
Vol. 29, No. 9s, (2020), pp. 4513-4522
[26] Smith, K. M., Machalaba, C. C., Seifman, R., Feferholtz, Y., &Karesh, W. B. (2019). Infectious
disease and economics: The case for considering multi-sectoral impacts. One Health, 7, 100080.
[27] Gourinchas, P. O. (2020). Flattening the pandemic and recession curves. Mitigating the COVID
Economic Crisis: Act Fast and Do Whatever, 31.
APPENDIX
Table 1: Health indicators across countries
Out-of- Current Hospital
pocket health Current beds
Population Life expenditure expenditure Current health (per
UHC ages 65 and expectancy (% of per capita, health expenditure Physicians 1,000
Country Service above (% at birth, current PPP (current expenditure per capita (per 1,000 people)
Name (in Coverage of total total health international (% of (current people) (in (in
2017) Index population) (years) expenditure) $) GDP) US$) 2014) 2014)
Afghanistan 37.00 2.55 64.13 75.48 174.73 11.78 67.12 0.30 0.50
Australia 87.00 15.40 82.50 18.15 4816.15 9.21 5331.82 3.46 3.80
Bangladesh 48.00 5.15 72.05 73.88 94.30 2.27 36.28 0.47 0.60
Bhutan 62.00 5.92 71.13 13.31 290.42 3.19 96.80 0.31
Canada 89.00 16.84 81.95 14.22 4928.63 10.57 4754.95 2.50
Switzerland 83.00 18.43 83.55 28.95 8216.96 12.35 9956.26 4.11
China 79.00 10.35 76.47 36.05 841.11 5.15 440.83 1.70
Colombia 76.00 8.20 76.93 16.31 1039.16 7.23 459.20 1.82 1.50
Cuba 83.00 14.78 78.66 10.48 2485.81 11.71 987.63 7.48 5.20
Germany 83.00 21.37 80.99 12.67 5922.64 11.25 5033.45 4.08
Spain 83.00 19.15 83.28 23.57 3468.69 8.87 2506.46 3.80
France 78.00 19.67 82.53 9.38 5011.20 11.31 4379.73 3.21
United
Kingdom 87.00 18.29 81.26 15.96 4338.37 9.63 3858.67 2.78
High income 82.30 17.61 80.69 12.53
Indonesia 57.00 5.68 71.28 34.61 367.94 2.99 114.97
India 55.00 5.98 69.17 62.40 253.32 3.53 69.29 0.73
Italy 82.00 22.50 82.95 23.49 3619.70 8.84 2840.13 3.96
Japan 83.00 27.11 84.10 12.85 4563.46 10.94 4168.99 2.34
Kenya 55.00 2.26 65.91 24.04 158.16 4.80 76.61 0.20
Least
developed
countries:
UN
classification 43.53 3.52 64.71 4.25
Low income 42.23 3.28 63.39 5.25
Sri Lanka 66.00 10.12 76.65 49.76 503.56 3.81 159.48
Lower
middle
income 54.83 5.40 68.32 3.86
Low &
middle 62.61 6.93 70.80 5.39
4520
ISSN: 2005-4238 IJAST
Copyright ⓒ 2020 SERSCInternational Journal of Advanced Science and Technology
Vol. 29, No. 9s, (2020), pp. 4513-4522
income
Middle
income 65.11 7.38 71.70 5.39
Myanmar 61.00 5.56 66.56 76.23 287.64 4.66 58.04
Malaysia 73.00 6.43 75.83 37.95 1138.96 3.86 384.07
North
America 84.51 15.56 78.91 16.56
Norway 87.00 16.83 82.61 14.18 6518.87 10.45 7936.38 4.43
Nepal 48.00 5.66 70.17 57.80 150.07 5.55 47.92 0.60
OECD
members 81.59 16.82 80.14 12.55
Pakistan 45.00 4.31 66.95 60.24 160.56 2.90 44.59 0.81 0.60
Philippines 61.00 4.94 70.95 53.05 371.74 4.45 132.90
South Asia 52.88 5.69 69.17 3.46
Singapore 86.00 10.58 83.10 32.13 4269.96 4.44 2618.71 2.04
Thailand 80.00 11.44 76.68 11.15 670.88 3.75 247.04
South Asia
(IDA &
IBRD) 52.88 5.69 69.17 3.46
Upper
middle
income 76.72 9.62 75.52 5.84
United States 84.00 15.42 78.54 10.99 10246.14 17.06 10246.14 2.58
Vietnam 75.00 7.03 75.24 45.26 375.64 5.53 129.58 0.78 2.60
World 65.69 8.65 72.38 9.90
Source: http://datatopics.worldbank.org/universal-health-coverage/coronavirus/
Table2: Coronavirus cases in India as on 14thMay, 2020
States/ UTs Total Confirmed cases* Cured/Discharged/Migrated Deaths**
Maharashtra 25922 5547 975
Gujarat 9267 3562 566
Tamil Nadu 9227 2176 64
Delhi 7998 2858 106
Rajasthan 4328 2459 121
Madhya Pradesh 4173 2004 232
Uttar Pradesh 3729 1902 83
West Bengal 2290 702 207
Andhra Pradesh 2137 1142 47
Punjab 1924 200 32
Telengana 1367 940 34
Jammu and Kashmir 971 466 11
Karnataka 959 451 33
Bihar 940 388 7
Haryana 793 418 11
Odisha 538 143 3
Kerala 534 490 4
Chandigarh 187 28 3
4521
ISSN: 2005-4238 IJAST
Copyright ⓒ 2020 SERSCInternational Journal of Advanced Science and Technology
Vol. 29, No. 9s, (2020), pp. 4513-4522
Jharkhand 173 79 3
Tripura 155 16 0
Assam 80 39 2
Uttarakhand 72 46 1
Himachal Pradesh 66 39 2
Chhattisgarh 59 55 0
Ladakh 43 22 0
Andaman and Nicobar
Islands 33 33 0
Meghalaya 13 10 1
Puducherry 13 9 1
Goa 7 7 0
Manipur 2 2 0
Arunachal Pradesh 1 1 0
Dadar Nagar Haveli 1 0 0
Mizoram 1 1 0
Total 78003# 26235 2549
Source: https://www.mohfw.gov.in
Table 3: Health Expenditure in India across states (2015-16)
Health Expenditure State-wise (2015-16)
Expenditure incurred on healthcare and family welfare
Public
Expenditure
on Health in
Rs. Crores
(Medical & Per Capita Health
as % as % of Total public health expenditure in Rs. crores
of State + Family (Total state health
STATE GSDP Expenditure welfare) expenditure/population)
Maharashtra 0.6 5.08 10052 1011
Karnataka 0.69 5.03 6015 1124
Gujarat 0.72 5.86 7199 1189
Tamil Nadu 0.74 4.99 8525 1235
Non-EAG
States 0.76 5.34 67162 1172
Delhi 0.76 11.45 3759 1992
West Bengal 0.8 5.33 7976 778
Telangana 0.82 4.8 3948 1322
EAG States +
Assam 1.36 5.05 44831 871
Uttar Pradesh 1.42 5.07 13796 733
Rajasthan 1.44 5.61 7818 1360
North East
States 2.76 6.3 3453 2878
Source: http://www.cbhidghs.nic.in/WriteReadData/l892s/Chapter%204.pdf
4522
ISSN: 2005-4238 IJAST
Copyright ⓒ 2020 SERSCYou can also read