Mining employment in SA - exploration and exports boom but what about jobs? - John Spoehr and Simon Molloy March 2011
←
→
Page content transcription
If your browser does not render page correctly, please read the page content below
Mining employment in SA -
                       exploration and exports boom but
                       what about jobs?

                       John Spoehr and Simon Molloy

                       March 2011

                       Prepared with assistance from the:
                       Institute for Minerals and Energy Resources

AISR – [Report name]                                                 1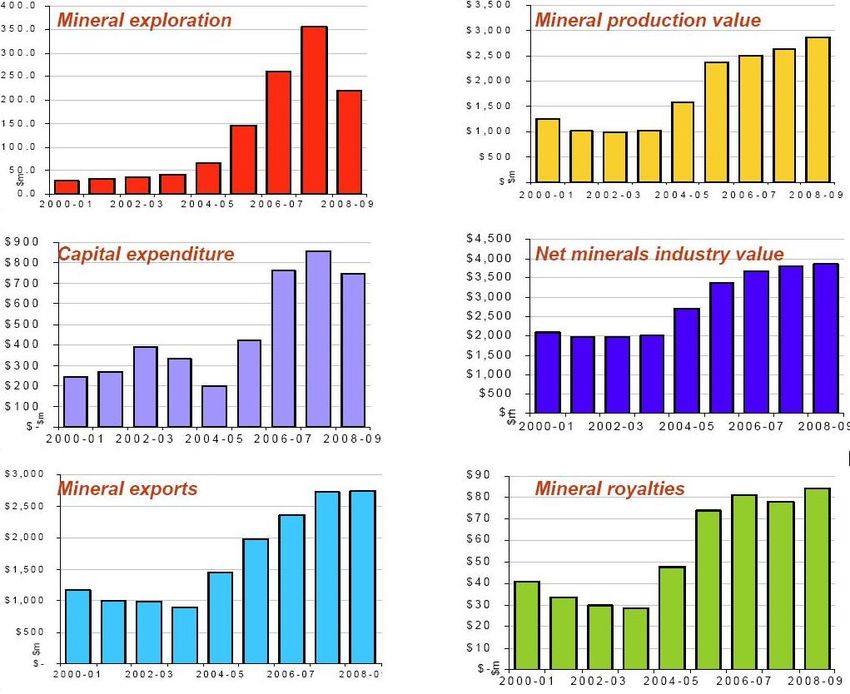
CONTENTS

1      CONTEXT ................................................................................................................................................. 2

      1.1        MINING EMPLOYMENT TRENDS ......................................................................................................... 3

2      FACTORS DRIVING INCREASED DEMAND FOR LABOUR ............................................................................ 7

      2.1        PRODUCTIVITY AND PRICE EFFECTS .................................................................................................... 8

      2.2        SKILL SHORTAGES .............................................................................................................................. 10

      2.3        CHANGES IN WORK ARRANGEMENTS .............................................................................................. 11

3      CONCLUSION ......................................................................................................................................... 12

4      REFERENCES .......................................................................................................................................... 13

                                                               TABLE OF FIGURES

FIGURE 1: PERSONS EMPLOYED, MINING, SOUTH AUSTRALIA, BY QUARTER, 1984 TO 2010 ...................................................... 3
FIGURE 2: PERSONS EMPLOYED, MINING, BY MINING ACTIVITY, SOUTH AUSTRALIA, BY QUARTER, 2002 TO 2010.......................... 4
FIGURE 3: PERSONS EMPLOYED, MINING, BY STATE, BY QUARTER, 2002 TO 2010 ................................................................... 5
FIGURE 4: PROPORTION OF TOTAL STATE EMPLOYMENT IN MINING, BY STATE, AUGUST 2002 AND 2010 ..................................... 6
FIGURE 5: INDICATORS OF MINING INDUSTRY ACTIVITY , 2000-01 TO 2008-09 ...................................................................... 7
FIGURE 6: INDEX OF MINERAL AND ENERGY COMMODITY PRICES .......................................................................................... 9
FIGURE 7: MINING INDUSTRY MFP AND PRIMARY INPUTS ................................................................................................ 10
FIGURE 8: MINING MFP WITH DEPLETION AND CAPITAL EFFECTS REMOVED ......................................................................... 10

    AISR – Workforce report: the South Australian minerals and resource sector                                                                                  1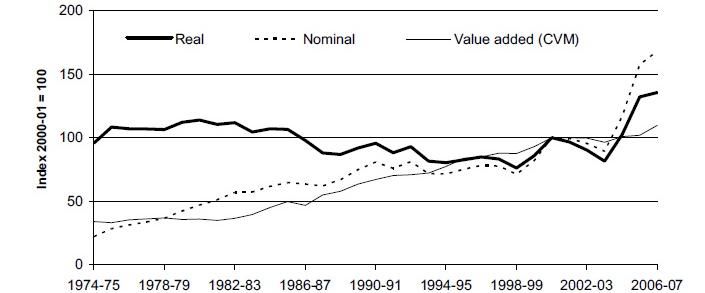
1    CONTEXT

The mining and resources sector offers the South Australian economy the desirable prospect of increased
diversification and renewed export-driven economic growth. It is therefore strategically important to the State
and accordingly the current Government has taken a strong interest in the resource sectors growth and
development. The prospects for growth in the sector are strong and employment growth is expected to flow
from this.

There is ample evidence of rapidly increasing activity in the South Australia mining sector: new mines are
opening, exploration is at a historically high level, the pipeline for the new mine developments is at
unprecedented levels and mining is now South Australia's largest export earner. Data from Primary Industries
and Resources South Australia (PIRSA) indicate that mining exports, royalty payments and production value are
all increasing in value.

In the context of this growth, it is unsurprising to find industry concerns with skills shortages. In 2009 the
Resources and Engineering Skills Alliance (RESA) reported that, based on industry consultations, that mining
stakeholders reported that they were experiencing:

         -    Continuing problems sourcing specialist professional, para professional and skilled trade’s
              employees.

         -    Ongoing concerns at the relatively poor literacy and numeracy levels of school leavers and
              young people applying for positions with employers.

         -    Some attraction and retention pressures from the emerging mega-projects in WA and Qld.

         -    No shortages of applicants/labour for entry level and semi skilled positions.

         -    No shortages of applicants for apprenticeships. (RESA 2009, p5)

It seems reasonable to expect that, in the context of strong industry growth, we would observe an increase in
mining employment in South Australia. Indeed, in the period from 2000 to 2007 this is exactly what we
observe. Subsequently, however, employment has fallen from a peak of around 12,000 in 2007 to around
7,700 persons in November 2010. Clearly, the global financial crisis has played a role in this decline.
Nonetheless, it is curious that, given all the growth indicators described above, that employment has fallen as
much as the official figures indicate and that it has not recovered more rapidly. It is worth emphasising that
most of the indicators of mining activity have shrugged off the global recession without diverging from their
upward trends.

The absence of a recovery in employment in South Australia has important implications for the conduct of
mining sector workforce policy. Do these low levels of employment suggest that the calls from industry to
address skills shortages are unfounded? Or do these low levels of employment in fact reflect systemic
persistent shortages of labour for the South Australian mining sector in the context of a national (and global)
mining boom? Is the historically low level of employment merely a momentary aberration as the industry
moves from the post-GFC period into a phase of sustained output and employment growth? Or have there
been fundamental changes in productivity and therefore the relationship between outputs and labour inputs
in the industry which need to be factored into our thinking about workforce planning going forward?
Alternatively, have changes in the measurement of employment in the sector affected the outcome? In
addition, the impact of the Federal Government’s taxation policy for the resources sector needs to be
considered.

All of these questions are highly relevant to workforce policy in the mining industry. This paper examines
published employment statistics and indicators of activity in the South Australian mining industry and offers

    AISR – Workforce report: the South Australian minerals and resource sector                                    2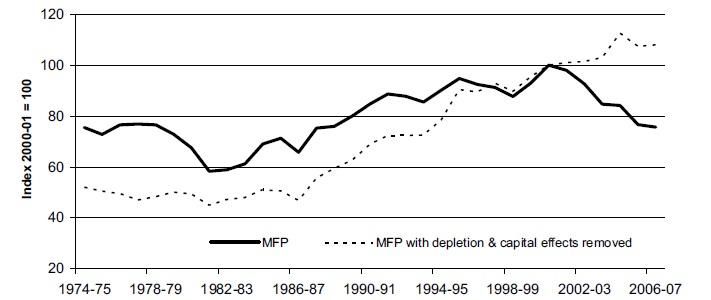
some suggestions for explaining the relatively low level of employment at this time in the face of increasing
mining industry activity. This increase in activity is set to generate a rise in employment demand in the sector,
particularly if large scale projects like the expansion of Olympic Dam proceed in 2012.
1.1 MINING EMPLOYMENT TRENDS
1
The long term view of mining employment in South Australia from 1984 to the present is surprising in that
employment in the sector is currently only slightly higher than the level it was 26 years ago. Employment in
this period falls into three broad phases: relatively high levels of activity between 1985 and 1987, a long trough
of relatively low (around 4,000 persons employed) between 1988 and 2003 and a period of renewed but more
volatile activity between 2004 and 2008 with a significant peak of 12,400 persons employed in February 2007
followed by a fall off to the present level of 7,700 employees (November 2010). There is tentative evidence of
an upturn in employment from lows of around 6,000 persons in 2008 and 2009 but it is a little early to assert
that this is the beginning of the sustained increase in employment that could be expected to be associated
with the relatively rapid increases in mining activity indicators.
Figure 1: Persons employed, mining, South Australia, by quarter, 1984 to 2010, ‘000
14.0
12.0
10.0
8.0
Persons '000
6.0
4.0
2.0
0.0
Nov-1984
Nov-1985
Nov-1986
Nov-1987
Nov-1988
Nov-1989
Nov-1990
Nov-1991
Nov-1992
Nov-1993
Nov-1994
Nov-1995
Nov-1996
Nov-1997
Nov-1998
Nov-1999
Nov-2000
Nov-2001
Nov-2002
Nov-2003
Nov-2004
Nov-2005
Nov-2006
Nov-2007
Nov-2008
Nov-2009
Nov-2010
Source: ABS Cat 6291.0.55.003 - Labour Force, Australia, Detailed, Quarterly, May 2010, Table 5
1
The ABS, Labour Force, Australia, Detailed (Cat 6291.0.55.003), provides estimates of employment by industry by State, most recently for
August 2010. The ABS includes in its definition of mining includes the mining of minerals, oil and gas extraction, and exploration and
mining services. It is worth noting that the PIRSA includes metal refining and manufacturing within its definition of mining.
AISR – Workforce report: the South Australian minerals and resource sector 3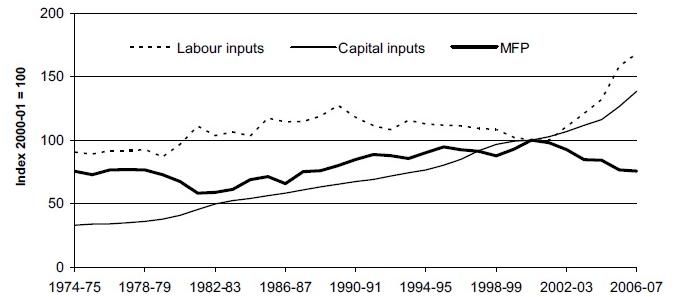
Digging deeper into the structure of employment, the ABS provides a breakdown of employment by mining
activity for Australia as a whole. (Figure 2) show the two most volatile sub-categories of employment in the
period 2002 to 2010 together with total industry employment. This indicates that the main factors driving the
decline in employment were a collapse in employment in the category ‘Metal Ore Mining’ from over 7,000
persons in November 2006 to around 1,500 by August 2010. This decline was, to some extent, offset by a rise
in exploration activity in mid- to late-2008, but this sub-category also declined rapidly after February 2009
before recovering somewhat in mid May 2010.

Figure 2: Persons employed, mining, by mining activity, South Australia, by quarter, 2002 to 2010, ‘000

  14

  12

  10

   8

   6

   4

   2

   0
    May-02       May-03        May-04          May-05           May-06          May-07          May-08    May-09   May-10

                            Metal Ore Mining            Exploration and Other Mining Support Services    Total

Source: ABS Cat 6291.0.55.003 - Labour Force, Australia, Detailed, Quarterly, May 2010, Table 5

Trends in the mining sector employment in South Australia also need to be placed in the context of the
national mining sector. Western Australia and Queensland are the big mining employers. In August 2010, for
example, South Australia's employment of 6200 in the mining sector is small by comparison with Western
Australia's 86,900 and Queensland's 51,600. New South Wales and Victoria also employs significantly more
persons in mining with figures of 35,500 and 11,000 respectively.

    AISR – Workforce report: the South Australian minerals and resource sector                                              4
Figure 3: Persons employed, mining, by state, by quarter, 2002 to 2010, ‘000
100.0
90.0
80.0
70.0
60.0
Persons '000
50.0
40.0
30.0
20.0
10.0
0.0
Jul-2006
Jul-2010
Jul-2003
Jul-2004
Jul-2005
Jul-2007
Jul-2008
Jul-2009
Nov-2003
Nov-2007
Nov-2002
Nov-2004
Nov-2005
Nov-2006
Nov-2008
Nov-2009
Nov-2010
Mar-2005
Mar-2009
Mar-2003
Mar-2004
Mar-2006
Mar-2007
Mar-2008
Mar-2010
SA WA Queensland NSW Vic
Source: ABS Cat 6291.0.55.003 - Labour Force, Australia, Detailed, Quarterly, May 2010, Table 5
Also relevant, is the importance of mining in each state in terms of its share of total employment. Figure 4
shows mining employment as a percentage of total employment for each Australian state. It can be seen that
mining has increased in importance in all states over the period 2000 to 2010. However, in South Australia, the
increase has been relatively small while in both Western Australia and Queensland the proportion of
employment in mining has approximately doubled in both cases. It is important to note that mining
employment as a proportion of total employment is relatively low in South Australia.
AISR – Workforce report: the South Australian minerals and resource sector 5Figure 4: Proportion of total state employment in mining, by state, August 2002 and Nov 2010, percent
8.0%
7.0%
6.0%
5.0%
4.0%
3.0%
2.0%
1.0%
0.0%
SA WA Qld NSW Vic Tas NT ACT Aust
Source: ABS Cat 6291.0.55.003 - Labour Force, Australia, Detailed, Quarterly, May 2010, Table 5
AISR – Workforce report: the South Australian minerals and resource sector 62 FACTORS DRIVING INCREASED DEMAND FOR LABOUR
The level of employment is driven ultimately by the interplay between output and productivity. If productivity
is not changing and output is increasing we should observe an increase in employment. Beyond these obvious
relationships between output, productivity and employment lie a set of complex measurement issues which
presents significant challenges for making definitive statements on the course of these variables over time.
PIRSA provides multiple sources of data on the state of the mining sector in Australia. All of these indicators
show significant growth in activity over the period 2004-05 to 2008-09 (see Figure 5). In particular, except for
mineral exploration and capital expenditure, the various indicators showed no significant decline. In most
cases, an increase is evident during the period 2006-07 to 2008-09 when employment was in steep decline.
Figure 5: indicators of mining industry activity , 2000-01 to 2008-09
Source: PIRSA website Source:
http://www.pir.sa.gov.au/__data/assets/pdf_file/0018/132381/Heithersay_SAREIC_2010.pdf
accessed 15/11/2010
AISR – Workforce report: the South Australian minerals and resource sector 7In addition to this data on mining output, PIRSA produces a summary of the South Australian mining sector
called South Australia's Mining Pipeline (PIRSA, 2010). It shows 12 major mines active in South Australia and 29
projects which are at some stage of feasibility study. These levels of activity represent substantial growth on
previous long term trends. For example, until early this decade there were only four major mines in South
Australia. If this growth is sustained or even accelerates then the absolute numbers of new employees
required by mining may begin to become significant relative to the South Australia labour force.
The evidence of increased activity in the South Australian mining industry seems emphatic. There are a range
of possible reasons why this increase in activity is not being reflected in ABS employment statistics. Some of
these are canvassed below.
2.1 PRODUCTIVITY AND PRICE EFFECTS
The most obvious possible reason for falling employment in the face of increasing mining activity is an increase
in labour productivity. Such an increase in productivity could be due to a number of factors including a relative
increase in the use of capital in mining, a shift towards mining activity which is less labour-intensive (for
example, a shift from underground to open cut mining) and an increase in the average level of skills and
human capital in general of mining labour. As we shall see, the assessment of productivity in the mining sector
is particularly complex and there is insufficient data to definitively assess the state of productivity in the
mining sector in South Australia.
Another factor which could lead to some decoupling of the relationship between labour inputs and outputs is
that the indicators of mining activity are expressed in dollar terms and prices are changing. In particular,
increases in the value of mineral production are, in significant part, due to increases in commodity prices.
In a 2008 paper The Productivity Commission notes that:
The mining industry has had a major influence on Australia’s productivity performance and
prosperity in recent years. While its influence on prosperity has been positive, the opposite has
been the case in relation to productivity.
A surge in commodity prices from 2003-04 to 2006-07 has been the major influence on the sector.
Higher commodity prices have resulted in large increases in the value of output as well as in
income and prosperity. But they have not induced a commensurate increase in the volume of
mining output. Because substantially increased usage of capital and labour inputs has
accompanied only a modest increase in output, multifactor productivity (MFP) has fallen.
(Productivity Commission, 2008, pXV)
The Productivity Commission reports real and nominal indexes of mineral and energy commodity prices for
Australia (see Figure 6). These rise as expected and therefore go some way to explaining the rising value of
output in the face of static or falling labour inputs.
The critical question is the extent to which the apparent increase in mining output is due to commodity price
increases, that is, the increasing value of mining output is driven primarily by price increases rather than
increases in physical output. The behaviour of commodity indexes shown in Figure 6 suggests that price effects
are significant. These indexes, however, are based on national output. The composition of South Australia’s
mineral output is quite different from the national aggregate output and therefore the national indexes will
not provide an accurate picture of the overall movement in the prices of South Australian commodity outputs.
Thus, to be definitive about the impact of prices and therefore the extent to which value changes are
attributable to prices changes, it would be necessary to construct a South Australian commodity price index.
AISR – Workforce report: the South Australian minerals and resource sector 8This would enable the aggregate value of production to be discounted for price effects and provide a more reliable basis for assessing labour productivity changes. Figure 6: Index of mineral and energy commodity prices Source: Productivty Commission 2008 In addition to the influence of commodity prices on assessments of productivity, a number of other factors need to be included in any analysis of productivity in the mining sector. The Productivity Commission points out that, because the quality of mining deposits is depleted over time, productivity may appear to fall by more than is the case if such quality depletion is taken into account. In addition, large capital expenditures and long mine development lead times will also adversely affect mining productivity. During a period of high mining investment, productivity may fall significantly due to this factor. Figure 8 provides the Productivity Commission’s estimates of MFP allowing for mine quality and capital effects removed. The conclusion of this analysis is that underlying productivity is increasing if these effects are taken into account. It is still the case, however, that if mine quality is falling and investment is at a high level, productivity will appear to fall and more labour will be required to produce a particular level of mineral output so, again, increasing productivity cannot be called upon to explain increasing output and decreasing employment. Figure 7 shows trends in labour and capital inputs as well as multifactor productivity (MFP). If these trends for Australia are also characteristic of South Australia and they have continued to the present, then the trend for productivity would be downwards. Therefore it would not be possible, on this basis, to account for the divergence between mining output and mining employment being cased by an increase in productivity. This, in turn, raises the question of whether South Australia’s productivity is likely to be similar or dissimilar to the Australia-wide experience. There are a number of factors that suggest that the South Australian industry may be atypical: the mix of commodities in South Australia is different to Australia; the scale of mining operations is, in general, smaller than in other states (especially Western Australia and Queensland) and there is a preponderance of new mine in South Australia which is likely to mean new techniques and technologies are being used (which may contribute to higher productivity). Figure 8 provides the Productivity Commission’s estimates of MFP allowing for mine quality and capital effects removed. The conclusion of this analysis is that underlying productivity is increasing if these effects are taken into account. It is still the case, however, that if mine quality is falling and investment is at a high level, productivity will appear to fall and more labour will be required to produce a particular level of mineral output AISR – Workforce report: the South Australian minerals and resource sector 9
so, again, increasing productivity cannot be called upon to explain increasing output and decreasing
employment.

Figure 7: Mining industry MFP and primary inputs

Source: Productivty Commission 2008

Figure 8: Mining MFP with depletion and capital effects removed

Source: Productivty Commission 2008

2.2    SKILL SHORTAGES

It needs to be recalled that the interpretation of any particular set of employment statistics needs to take into
account the state of the labour market. The expression economics that applies is: ‘the short side dominates’. If
there is a shortage of labour in a particular market or market segment, then the reported employment
statistics reveal the supply of labour. Conversely, if there are unfilled vacancies, the reported employment
statistics will indicate the demand for labour. It is only when the particular market is in balance that
employment statistics will indicate both supply and demand.

When we observe that indicators of mining activity point to significant growth, the logical conclusion,
notwithstanding the other factors discussed in the section, is an increase in the demand for labour. If,

  AISR – Workforce report: the South Australian minerals and resource sector                                   10
however, there is insufficient labour supply to meet this demand, shortage will emerge which will, under the
circumstances, probably grow over time. Therefore, to the extent that the mining labour market was in
balance previously and is now experiencing an increasing shortage, the published statistics will show only the
current labour supply and will not represent the true extent of demand in the market.

This interpretation of the current statistics is consistent with the calls from industry stakeholders to address
existing and looming labour shortages in the industry.

2.3    CHANGES IN WORK ARRANGEMENTS

The mining industry makes significant use of contractors. These contractors are often large companies that
service several industries such as mining, construction and infrastructure. It is possible that definitional issues
for the ABS’s Labour Force collection and an increase could lead to an understatement of mining employment.
For example, a truck driver that is employed by a major subcontracting company might, in a given month,
provide services to be mining industry, the transport industry and the construction industry. When such a
worker responds to an ABS survey he or she may not be able to give an accurate picture of what industry
labour services were supplied to. The ABS’s Labour Force survey is a household survey in which respondents
self enumerate. Answers to the question: ‘What industry do you work for?’ may become less accurate over
time as workers move into positions with contracting organisation which supply services across several
industries.

  AISR – Workforce report: the South Australian minerals and resource sector                                       11
3 CONCLUSION
This paper has highlighted what can reasonably be called the South Australian mining employment paradox:
that is why, in the face of rising activity in the mining sector, do we observe static or declining employment?
The short answer to this question is that we do not have sufficient data to provide a rigorous answer. More
specifically, in order to provide a rigorous evaluation of this paradox we would need to address following data
deficiencies:
To what extent is the increase in the value of output of the resources sector in South Australia been due to
increases in commodity prices or increases in physical output? To answer this question the development
of a South Australian commodity price index would be a useful first step.
To what extent have changes in working arrangements in the in the resources sector – primarily, a shift
from employment to contracting – led to understatement of the level of employment in the industry in
the ABS statistics and, if this has happened, what can be done to derive more accurate estimates of the
number of persons employed in the resources sector?
What is happening to labour productivity in the South Australian resources sector? To what extent is a
South Australian experience in this area atypical of the Australian average?
To what extent is the apparently low level of employment in South Australia attributable to labour supply
constraints? What is the extent of labour shortages for specific occupations/skills? What are the drivers of
the demand for labour in the South Australian industry? To what extent has the supply of labour being
detected by demand from interstate, in particular from the two big mining states?
To what extent do factors such the GFC and the mining tax debate feature in the decision-making of
resources sector employers? Can we quantify these impacts?
Answers to these questions are required in order to form a clear picture of the current state of the resources
workforce in South Australia. Without this clearer picture it is difficult to form definitive conclusions about
how the South Australian Government should assist the industry in the areas of skills development and
workforce planning more generally.
AISR – Workforce report: the South Australian minerals and resource sector 124 REFERENCES
Australian Manufacturing Workers Union, (AMWU), 2010, Resourcing the future.
Australian Bureau of Agricultural and Resource Economics (ABARE), 2009, Minerals and energy-major
development projects-October 2009, www.abare.gov.au/interactive/09_Listings/pL09_Oct/
Australian Bureau of Statistics, Cat No 6291.0.55.003 Labour Force, Australia, Detailed, Quarterly Table 5
Employed persons by State and Industry,
BHP Billiton, 2009, Olympic Dam Expansion Draft Environmental Impact Statement, Chapter 19.
Chamber of Minerals and Energy of Western Australia, the Minerals Council of Australia and the Department
of Education, Science and Training, August 2006, Staffing the Supercycle: Labour Force Outlook in the Minerals
Sector, 2005 to 2015.
Chen, KY, Plott, CR, March 2002, Information Aggregation Mechanisms: Concept, Design and Implementation
for a Sales Forecasting Problem, Social Science Working Paper 1131.
Department of Further Education, Employment, Science and Technology and the Department of Trade and
Economic Development, February 2006, Estimated Demand for Labour in the Mining Sector: 2006-2014 (the
report was also part-commissioned by Primary Industries and Resources South Australia and was undertaken
by The South Australian Centre for Economic Studies).
Department of Further Education, Employment, Science and Technology (DFEEST), May 2009, Skills for Jobs:
Priorities for developing South Australia’s workforce: the Training and Skills Commission’s Five Year Plan for
skills and workforce development.
Hoeckel, K, Field, S, Justesen, TR and Moonhee, K, November 2008, Learning for Jobs OECD Reviews of
Vocational Education and Training AUSTRALIA, p25.
Hubbard, WH, How to measure anything: finding the value of intangibles in business, John Wiley and Sons,
2007.
Lowry, D, Molloy, S and Tan, Y, National Institute of Labour Studies, May 2006, The Labour Force Outlook in the
Minerals Resources Sector: 2005 to 2015.
Molloy, S and Tan, Y, 2008, The labour force outlook in the Australian minerals sector 2008 to 2020
(commissioned by the Minerals Council of Australia).
National Resources Sector Employment Taskforce (NRSET), March 2010, Australian Workforce Futures A
National Workforce Development Strategy Skills Australia.
OECD, Hoeckel, K, Field, S, Justesen, TR and Kim, M, Learning for Jobs, OECD Reviews of Vocational Education
and Training, Australia, November 2008
Peng, X, Spoehr, J, and Windsor, L, Labour Market Forecasting: How can projections better inform workforce
planning and development? Prepared for the Australian Research Council (ARC) Linkage Project, Demographic
Change, Ageing and the Workforce: An Integrated Model to Inform Workforce Development and Planning in
Australia, August 2005.
Primary Industries and Resources South Australia, Government of South Australia, June 2010, South Australia’s
Mining Pipeline.
AISR – Workforce report: the South Australian minerals and resource sector 13Resources and Engineering Skills Alliance (RESA), Resources Industry Workforce Action Plan, 2010. Richardson, S and Tan, Y, National Institute of Labour Studies, Flinders University 2007, Forecasting future demands: What we can and cannot know, National Centre for Vocational Education Research (NCVER) Research report. Richardson, S and Teese, R, July 2007, A Well Skilled Future, NCVER Research report. South Australian Chamber of Mines and Energy, (SACOME), 2009, Resources Industry Skills Survey. South Australian DFEEST submission to NRSET, Submission to the National Resource Sector Employment Taskforce. Thessaloniki, October 2008, Cedefop working paper No 1 Systems for anticipation of skill needs in the EU Member States. Topp V, Soames L, Parham D and Bloch H, Productivity in the Mining Industry: Measurement and Interpretation, Productivity Commission, Staff Working Paper, December 2008 Western Australian Department of Education and Training, April 2004, Argus Report (2004), Western Australian Development Projects: Employment Demand and Predicted Skill Requirements 2003-2007. AISR – Workforce report: the South Australian minerals and resource sector 14
You can also read