Coronavirus: Impact on the labour market - UK Parliament
←
→
Page content transcription
If your browser does not render page correctly, please read the page content below
BRIEFING PAPER
                Number 8898, 12 November 2020

                Coronavirus: Impact on                                                    By Brigid Francis-Devine
                                                                                          Andrew Powell
                the labour market                                                         Niamh Foley

                                                                                          Contents:
                                                                                          1. November Labour Market Statist
                                                                                          2. Employment support schemes
                                                                                          3. Most affected workers
                                                                                          4. Further Reading

www.parliament.uk/commons-library | intranet.parliament.uk/commons-library | papers@parliament.uk | @commonslibrary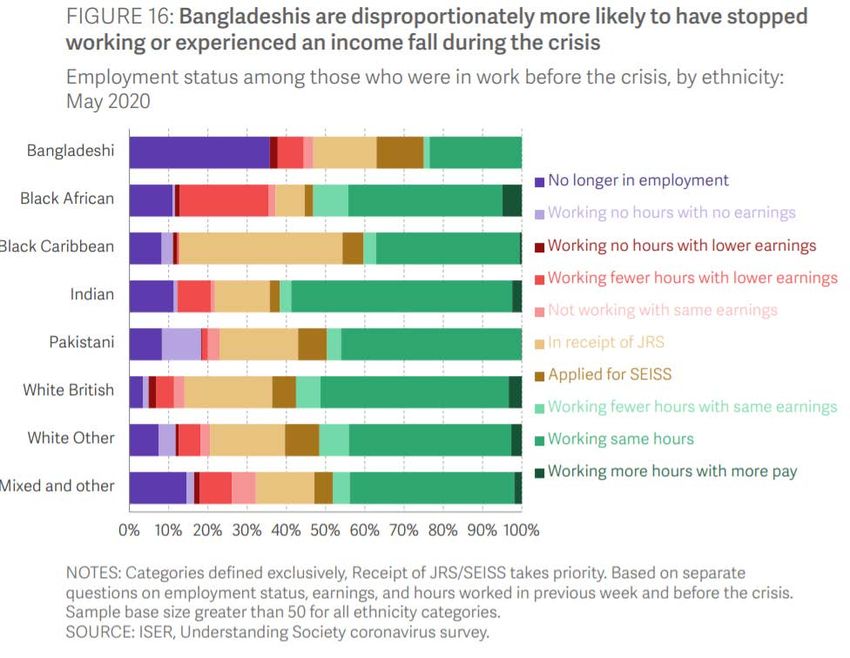
2   Coronavirus: Impact on the labour market

    Contents
    Summary                                                                         3
    1.    November Labour Market Statistics                                         4
    1.1   Payrolled employees                                                       4
    1.2   Employment and unemployment                                               5
    1.3   Labour market flows                                                       5
    1.4   Impact by age                                                             5
          Unemployment forecasts                                                    6
    1.5   Redundancies                                                              6
    1.6   Vacancies                                                                 7
    1.7   Working hours                                                             7
    1.8   People claiming unemployment benefits                                     7
    2.    Employment support schemes                                                 9
    2.1   Self-employed Income Support Scheme (SEISS)                                9
          Tranche 1                                                                  9
          Tranche 2                                                                  9
    2.2   Coronavirus Job Retention Scheme (CJRS) National statistics               10
    2.3   Furloughed workers by day                                                 11
    2.4   CJRS - Furloughed workers by sector                                       11
          Jobs still furloughed as at 31 August                                     11
          Furlough by day and sector                                                12
    2.5   Furloughed workers by age and gender                                      13
          Jobs still furloughed as at 31 August                                     13
    2.6   Furloughed workers by area                                                14
          Country and region                                                        14
          Constituency                                                              15
    3.    Most affected workers                                                     17
    3.1   Workers from minority ethnic groups                                       17
    3.2   Women                                                                     18
    3.3   Young and older workers                                                   19
    3.4   Low paid workers                                                          20
    3.5   Disabled workers                                                          20
    4.    Further Reading                                                           21
    4.1   House of Commons Library                                                  21
    4.2   Other sources                                                             21

      Cover page image copyright Click & browse to copyright info for stock image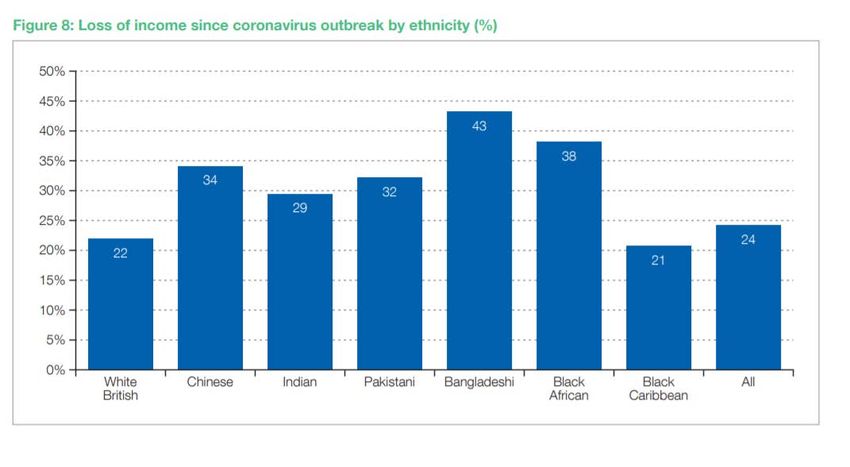
3   Commons Library Briefing, 12 November 2020

    Summary
    This briefing was last updated on 12 November 2020. This is a fast-moving situation, so
    please be aware that information may have changed since the date of publication. The
    Library intends to update this briefing.
    This paper tracks the evolving impact of the coronavirus outbreak on the labour market.
    On 10 November, the labour market statistics for July-September 2020 were published.
    These statistics showed a sharp increase in unemployment from quarter to quarter, and
    the level redundancies were at their highest since records began in 1995. The level of
    vacancies and working hours continued to recover, although remained below the levels
    seen prior to the start of the pandemic.
    To date, the pandemic has had more of an impact on the labour market status of
    particular age groups.
    Since the start of the pandemic, employment levels for those aged 16-24 and 65+ have
    fallen by 357,000, or 7%. In comparison, employment levels for those aged 25-64 have
    also fallen, but by much less at 141,000, or 0.5%.
    The number of people claiming unemployment related benefits increased by 1.4 million
    between March 2020 and October 2020.
    9.6 million employee jobs had been furloughed through the Government's Coronavirus
    Job Retention Scheme (CJRS) by midnight on the 18 October.
    Throughout April and May, over 8 million jobs were on furlough, with a peak of 8.9
    million jobs furloughed on the 8 May. 6.8 million jobs were on furlough at the end of
    June, 5.1 million were on furlough at the end of July, and 3.3 million were still on
    furlough on 31 August.
    The second tranche of the Government’s Self-Employment Income Support Scheme
    (SEISS) opened for applicants on the 17 August 2020. By midnight on the 18 October, 2,3
    million claims had been made.
    Some workers are disproportionally economically impacted by the coronavirus outbreak.
    Workers who are from a BAME (Black, Asian, Minority Ethnic) background, women,
    young workers, low paid workers and disabled workers, have been most negatively
    economically impacted by the coronavirus outbreak.
    For example, 15% of workers in sector which have shut down because of the coronavirus
    are from a BAME ethnic background, compared to 12% of all workers, 57% are women,
    compared to a workforce average of 48%, and nearly 50% are under 35 years old. Low
    paid workers are more likely to work in shut down sectors and less likely to be able to
    work from home.
4   Coronavirus: Impact on the labour market

    1. November Labour Market Statistics
    On the 10 November the latest labour market statistics were published by the Office for
    National Statistics (ONS). This section provides an overview of the data that was published.
    These statistics showed a sharp increase in unemployment from quarter to quarter, and
    redundancies at their highest since records began in 1995. The level of vacancies and
    working hours continued to recover, although remained below the levels seen prior to the
    start of the pandemic.

        Revisions to data
        In the October Labour Market Bulletin, the ONS revised the labour market data that had
        previously been published back to January-March 2020. 1
        The labour market statistics are collected by a survey, and analysis by the ONS of this survey
        had shown that the make-up of respondents had changed from before the start of the
        pandemic. Respondents were now more likely to own their own homes and less likely to be
        renting.
        To address this, the ONS have revised the weighting of the labour force survey to include
        housing tenure, and datasets have been reweighted from January-March 2020 to the latest
        period, June-August 2020. The ONS have reported that although this has not been “a perfect
        solution”, it has “redressed some of the issues that had previously been found in the survey
        results”.
        People living in owner-occupied accommodation are more likely to be employed than those
        living in rented accommodation, which means that the reweighting has reduced the total
        employment level.
        In June-August 2020, the ONS have reported that 32.59 million were in employment, and the
        employment rate was 75.6%. Under the original weights, employment in this period would
        have been 400,000 higher and the employment rate would have been 1.0 percentage points
        higher.

    1.1 Payrolled employees
    Since the start of the pandemic the ONS has been publishing experimental monthly
    estimates of payrolled employees using HMRC PAYE data. As the official employment
    statistics have a time lag (as detailed in section 2.1, the latest data is for July-September
    2020), this data provides a more timely indicator of the impact of the pandemic on
    employment. The ONS have reported that this data is currently the best source for the
    overall number of employees. 2
    The number of payrolled employees fell month-on-month in October 2020 by 33,000. The
    number of payrolled employees was 782,000 below levels in March 2020. 3

    1
         ONS, Coronavirus and its impact on the Labour Force Survey, 13 October 2020
    2
         ONS, Measuring the labour market during the pandemic, 12 October 2020
    3
         ONS, Earnings and employment from Pay As You Earn Real Time Information, UK: November 2020, 10
         November 2020
5 Commons Library Briefing, 12 November 2020
1.2 Employment and unemployment
The latest published employment and unemployment statistics are for July-September
2020, and by comparing this quarter with the pre-pandemic quarter of January-March
2020, we get an indication of the impact that the pandemic has had on the labour
market. 4
Between these two quarters:
• Employment levels for people aged 16+ have fallen by 499,000.
• Unemployment levels have risen by 258,000.
• The number of people who are economically inactive who are aged 16-64 has risen by
205,000.
The pandemic has not yet resulted in the expected flow from employment to
unemployment, although this will be partly due to the Coronavirus Job Retention scheme
(see section 2) as furloughed workers are classed as employed.
More information on labour market statistics can be found in the Library briefing, People
claiming unemployment benefits by constituency.
1.3 Labour market flows
The statistics also show the flows between employment, unemployment and inactivity in
July-September 2020 from the previous quarter. 5
Between these quarters there was a large flow from employment to inactivity, and a large
flow from inactivity to unemployment:
• There was a net flow to unemployment of 214,000, the biggest net flow since records
began in 2001. This flow was driven by those who had previously been inactive.
• There was a net flow from employment to inactivity of 133,000.
There was also a large net flow from employment to inactivity in April-June 2020 from the
pre-pandemic quarter of January-March 2020.
1.4 Impact by age
To date, the pandemic has had more of an impact on the labour market status of
particular age groups.
For young people aged 16-24 there has been a shift from employment to
unemployment and inactivity since the start of the pandemic. 6
Between January-March 2020 and July-September 2020 there has been:
• A fall in employment levels for young people of 274,000
• An increase in unemployment of 79,000
• An increase in the number of young people who are economically inactive of 175,000.
• An increase in the youth unemployment rate from 12.1% to 14.6%, the highest this
has been since 2015.
4
ONS, Labour market overview, UK: November 2020, 10 November 2020
5
ONS, X02: Labour Force Survey Flows estimates, 10 November 2020
6
ONS, A06 SA: Educational status and labour market status for people aged from 16 to 24 (seasonally
adjusted) , 10 November 20206 Coronavirus: Impact on the labour market
More information on the labour market statistics can be found in the Library briefing
Youth unemployment statistics.
Since the start of the pandemic there has been a flow for older workers aged 65+ from
employment to inactivity. In the quarter following the pandemic, almost 150,000 workers
of this age left employment, with a big rise in inactivity.
In the most recent quarter there has been an increase in employment for these older
workers, although employment levels were 83,000 fewer in July-September 2020 than in
January-March 2020.
Since the start of the pandemic, employment levels for those aged 16-24 and 65+ have
fallen by 357,000, or 7%. In comparison, employment levels for those aged 25-64 have
also fallen, but by much less at 141,000, or 0.5%.
Larger falls in employment for young and older workers
Fall in employment levels, Jan-March to Jul-Sep 2020, thousands
-50 -22
-63 -56 -63
-100 -83
-150
-200
-211
-250
16-17 18-24 25-34 35-49 50-64 65+
Source ONS, Labour Force Survey
Further analysis of the impact of the pandemic on young and older workers is provided in
section 3.3 of this paper.
Unemployment forecasts
In the July Fiscal sustainability report, the OBR forecast that the unemployment rate would
peak at a level between 9.7% and 13.2%, compared to a rate of 3.9% in the first quarter
of 2020. 7
The Treasury’s October 2020 survey of independent forecasts for the unemployment rate
showed an average forecast of 7.3% for Quarter 4 2020 and 7.0% for Quarter 4 2021. 8
1.5 Redundancies
The level of redundancies in July-September 2020 was the highest in any quarter since
records began in 1995.
Redundancies increased by 181,000 from the previous quarter and 195,000 from the
previous year, to 314,000. The quarterly increase was also the highest increase since
records began. 9
7
OBR, Coronavirus analysis, 14 July 2020
8
HM Treasury, Forecasts for the UK economy publication, 21 October 2020.
9
ONS, Labour market overview, UK: November 2020, 10 November 20207 Commons Library Briefing, 12 November 2020
1.6 Vacancies
One of the earliest indicators of the impact that the pandemic was having on the labour
market was a record fall in the number of job vacancies in April-June 2020. The number
of vacancies in that 3-month period was at a record low of 330,000.
Since then the number of vacancies has been steadily recovering. In August-October
2020, there were 525,000 job vacancies, 146,000 higher than the previous quarter.
Despite this the number of vacancies remains well below levels seen pre-pandemic, with
271,000 fewer vacancies than in January-March 2020. 10
In July-September 2020 there were 3.3 unemployed people per every job vacancy, up
from 1.7 unemployed people per vacancy in January-March.
1.7 Working hours
Another early indicator of labour market impact was a fall in working hours as millions of
people were furloughed after the introduction of the job retention scheme in April 2020.
The total number of hours worked fell to 842 million hours in April-June, its lowest level
since 1994. 11
The total number of weekly hours worked in the three months to September 2020
increased by 83 million hours compared to the previous quarter, although there were over
100,000 hours less than in January-March 2020.
The average weekly hours worked in the three months to September 2020 was 28.5
hours, down from 31.2 hours in January-March 2020.
1.8 People claiming unemployment benefits
In October, the ONS published September 2020 figures for the number of people claiming
unemployment related benefits (the unadjusted claimant count). This is a useful data
source for tracking changes in the labour market, although many of those who have
started to claim will not be unemployed (see box below). 12
In October 2020, 2.6 million people claimed unemployment related benefits, which was a
decrease of 30,000 from September. Since March 2020, when the lockdown began, the
claimant count has increased by 1.4 million.
The claimant count has more than doubled since March
Unadjusted claimant count (Millions), 2020
2.7 2.7 2.7 2.7 2.6
2.6
2.1
1.2 1.2 1.2
January February March April May June July August September October
10
ONS, Vacancies and jobs in the UK: November 2020, 10 November 2020
11
ONS, HOUR01 SA: Actual weekly hours worked (seasonally adjusted), 10 November 2020
12
ONS, CLA01: Claimant Count, 10 November 2020.8 Coronavirus: Impact on the labour market
Constituency level claimant count figures are published in the library briefing People
claiming unemployment benefits by constituency.
The unadjusted count includes those people who were claiming Jobseeker’s Allowance
(JSA) or were claiming Universal Credit and are required to seek work. Unlike the
alternative count (see below), the unadjusted count is not adjusted to take into account
the roll-out of Universal Credit. The Department for Work and Pensions alternative
claimant count series adjusts for this, but figures for this series are not as up to date:
they have only been published up to August 2020.
Why is the claimant count so different from the unemployment rate?
Usually, trends in the number of people claiming unemployment benefits in the UK closely
follow trends in unemployment. But since the coronavirus pandemic began, we have seen
sharp increases in the claimant count while the unemployment rate has hardly moved at all.
This suggests that people who do not classify themselves as unemployed may be claiming
unemployment related benefits. This may be because:
• They have a job but are temporarily away from work due to the pandemic. The ONS
pointed out that almost half a million people were employed but not earning in May.
• They are in employment but are also able to claim unemployment benefits. People in
employment can claim unemployment related benefits if their income is below a set
threshold, and the job retention scheme and a reduction in working hours means this
group has grown.
• They are temporarily inactive, and so are not actively looking for work.
In their report The truth will out (July 2020) the Resolution Foundation have estimated that
only around half of the Claimant Count rise relates to those newly out of work. The
report provides detailed analysis of why these figures are different and concludes that
neither are accurate representations of current unemployment levels.9 Commons Library Briefing, 12 November 2020
2. Employment support schemes
The Government has published a Plan for Jobs document which highlights the measures
that are being put in place to help replace the employment support schemes discussed
below, and help get people back into employment and keep people in their jobs. The
library briefing paper Coronavirus: Getting people back into work provides more
information on these measures.
2.1 Self-employed Income Support Scheme (SEISS)
Tranche 1
On 13 May 2020, the first tranche of the Self-Employment Income Support Scheme
(SEISS) opened to applications, and closed on 13 July. By midnight on 19 July 2020, 2.7
million claims had been made under the scheme. 13
Self-Employment Income Support Scheme Tranche 1 paid
(SEISS) taxable grants
worth 80% of
Tranche 1 of the scheme opened on the 13 average monthly
May 2020 trading profit for a
By midnight on 19 July
3 month period,
worth up to £7,500
Total number of claims 2.7 million in total.
Total amount claimed (£) £7.8 billion
Source Gov.uk, HMRC coronavirus (COVID-19) statistics
Tranche 2
The second tranche of the SEISS opened for applicants on the 17 August 2020. By
midnight on the 18 October, 2.3 million claims had been made.
Self-Employment Income Support
Tranche 2 of the
Scheme (SEISS) SEISS will pay cash
Tranche 2 of the scheme opened on the 17 grants worth 70%
August 2020 of average monthly
profit, over a three-
By midnight on 18 October 2020 month period,
Total number of claims 2.3 million capped at £6,570 in
total.
Total amount claimed (£) £5.9 billion
Source Gov.uk, HMRC coronavirus (COVID-19) statistics
67% of the eligible population for this scheme made a claim, with 69% of men making a
claim compared to 62% of women.
More information on the SEISS can be found in the Library briefing, Coronavirus: Self-
Employment Income Support Scheme.
13
Gov.uk, HMRC coronavirus (COVID-19) statistics, 15 July 2020, new data is posted weekly with up-to-date
statistics.10 Coronavirus: Impact on the labour market
2.2 Coronavirus Job Retention Scheme (CJRS) National
statistics
By midnight on 18 October, 9.6 million jobs had been furloughed through the
Government's job retention scheme. 14
Coronavirus Job Retention Scheme (CJRS) From 1 July 2020,
staff who have not
The scheme opened on the 20 April 2020
already been
By midnight on 18 October 2020 furloughed under
the scheme may not
Number of jobs furloughed 9.6 million be included in
Number of employers furloughing 1.2 million claims for support
Total claimed (£) £41.4 billion
Notes
Jobs furloughed' is calculated as the sum of the maximum number of
employees furloughed by any PAYE scheme across all claims by that
scheme
Employers furloughing is calculated by counting the number of CJRS
claims from distinct PAYE schemes on employer reference (where the
PAYE scheme reference is a proxy for a single employer)
Source Gov.uk, HMRC coronavirus (COVID-19) statistics
On 31 October 2020, the Prime Minister announced the furlough scheme would be
extended, due to the new national lockdown for England. Under the extension,
employees will receive 80% of their current salary for hours not worked up to a maximum
of £2,500. Employers will only have to contribute national insurance and pension costs.
More information on this can be found in the Library insight, Extending furlough via the
Coronavirus Job Retention Scheme.
In November, the Bank of England (BoE) published their Monetary Policy Report. In the
report the BoE estimated that around 5 and a half million employees will be
furloughed under the extended CJRS in November. 15
More information on the Job Retention Scheme can be found in the Library briefing,
FAQs: Coronavirus Job Retention Scheme.
Statistics for the job retention scheme are published every month by HMRC. These
statistics show the following:
• The number of jobs that have been furloughed from March to August 2020.
• The number of jobs that were still on furlough as at 31 August.
• The number of jobs that were furloughed on each day between the start of the
scheme and the end of August.
The rest of section 2 presents statistics on the number of jobs which were still on furlough
on 31 August, or daily time series of jobs on furlough.
14
Gov.uk, HMRC coronavirus (COVID-19) statistics, 21 August 2020, This data was initially provided on a daily
basis, but is now provided weekly since a fall in the number of daily claims
15
BoE, Monetary Policy Report, Monetary Policy Summary and minutes of the Monetary Policy Committee
meeting ending on 4 November 2020, 5 November 2020, para 3811 Commons Library Briefing, 12 November 2020
2.3 Furloughed workers by day
The chart below shows the total number of jobs that were on furlough on each day from
the 20 March 2020.
Throughout April and May, over 8 million jobs were on furlough, with a peak of 8.9
million jobs on furlough on the 8 May.
The number of jobs on furlough fell by 13% by the start of June to 7.7 million. This may
have reflected the gradual loosening of the lockdown restrictions during May, and sectors
opening up in June. The scheme was originally going to end at the end of May.
Throughout June and July there was a steady decline in the number of furloughed jobs,
with another drop at the end of June. This is likely to have been partly the result of sectors
continuing to open up, and changes to the scheme that meant that employers were only
able to furlough an employee for whom they had already successfully claimed a grant.
6.8 million jobs were on furlough at the end of June, 5.1 million were on furlough at the
end of July, and 3.3 million were still on furlough on 31 August.
Jobs furloughed per day
20 March to 31 August 2020, millions
10
9
8
7
6
5
4
3
2
1
0
March April May June July August
Source: HMRC, Coronavirus Job Retention Scheme statistics: October 2020- data tables, 22 October 2020
The drop in people on furlough between 31 July and 1 August was driven by the
Accommodation and food services sector, which saw a 28,400 decrease of employee jobs
on furlough that day, 21% of the total decrease. This coincides with the start of the
Government’s Eat Out to Help Out Scheme, which ran throughout August. This can be
seen in the chart in the section below.
2.4 CJRS - Furloughed workers by sector
Some sectors have been disproportionately affected by the coronavirus pandemic, and this
is reflected in the proportion of eligible jobs furloughed in each sector.
Jobs still furloughed as at 31 August
As at 31 August 2020, the sector that had the highest proportion of employee jobs
furloughed was the Arts, entertainment and recreation sector, where 33% (218,400) of
eligible jobs were furloughed.12 Coronavirus: Impact on the labour market
27% (592,800) of eligible jobs in the Accommodation and food services sector, and 23%
(769,300) of eligible jobs in the Construction sector were also furloughed by the end of
August. 16
Note that the sector is unknown for 10,000 furloughed employee jobs.
Percentage of employee jobs furloughed by sector
Coronavirus Job Retention Scheme claims received as at 31 August 2020
Arts, entertainment and recreation 33%
Accommodation and food services 27%
Other service activities 23%
Construction 14%
Professional, scientific and technical 13%
Manufacturing 12%
Wholesale and retail; repair of motor vehicles 12%
Real estate 12%
Administrative and support services 12%
Transportation and storage 10%
Information and communication 9%
Water supply, sewerage and waste 7%
Agriculture, forestry and fishing 6%
Mining and quarrying 6%
Education 5%
Health and social work 4%
Finance and insurance 3%
Households 2%
Energy production and supply 1%
Public administration and defence; social security 0%
0% 5% 10% 15% 20% 25% 30% 35%
Source: HMRC, Coronavirus Job Retention Scheme statistics: October 2020- data tables, 22 October 2020
Library Insight Coronavirus: The importance of different sectors to the economy provides
data on the number of jobs in each sector. 17
Furlough by day and sector
The number of furloughed jobs has followed a similar pattern over time in each sector,
with all sectors experiencing drops when changes in schemes or lockdown rules were
announced.
Some sectors have seen a larger decrease in the number of jobs furloughed than others.
The Wholesale and retail sector was the sector with the most furloughed jobs in March
and April, but these numbers fell quickly as shops re-opened, as shown in the chart
below.
In comparison, the number of furloughed jobs in the Arts, entertainment and recreation
sector has remained more static, with only small drops in reaction to changes in
restrictions.
16
HMRC, Coronavirus Job Retention Scheme statistics: October 2020- data tables, 22 October 2020
17
House of Commons Library, Coronavirus: The importance of different sectors to the economy, 1 April 2020.13 Commons Library Briefing, 12 November 2020
Jobs furloughed by day in certain sectors
23 March to 31 August 2020, millions Restaurants,
pubs and hotels
2.0 Wholesale and retail reopen (4 July) 'Eat out to help
out' scheme
1.8 (1 August)
1.6
Accommodation and food
1.4
services
1.2
1.0 Manufacturing
0.8
0.6 Construction
0.4 Arts, entertainment
and recreation
0.2
0.0
23 Mar 23 Apr 23 May 23 Jun 23 Jul 23 Aug
Source: HMRC, Coronavirus Job Retention Scheme statistics: October 2020- data tables, 22 October 2020
2.5 Furloughed workers by age and gender
Jobs still furloughed as at 31 August
On the 31 August, 11% of jobs held by women and 10% of jobs by men were still on
furlough.
Eligible jobs held by young people were more likely to still be on furlough.
Those aged under 18 experienced the highest proportion of furloughed jobs, with 16% of
eligible jobs held by women and 15% of eligible jobs held by men in that age group
furloughed as at the 31 August 2020.
This was followed by those aged over 65, where 14% of eligible jobs held by men and
women were furloughed.
Jobs held by women were slightly more likely to be furloughed than jobs held by men
across every age group under the age of 45.14 Coronavirus: Impact on the labour market
Furloughed employee jobs by age and gender
Coronavirus Job Retention Scheme claims received as at 31 August 2020
18% Female Male
16%
16% 15%
14% 14%
14% 13%
12%
12%
10% 10% 10%
10% 9%
8%
6%
4%
2%
0%
Under 18 18 to 24 25 to 44 45 to 64 65 and over
Source: HMRC, Coronavirus Job Retention Scheme statistics: October 2020- data tables, 22 October 2020
2.6 Furloughed workers by area
Country and region
The number and proportion of eligible jobs that were still on furlough varies slightly
between the different countries and regions of the UK.
The region where the highest number of jobs were furloughed was in London where
557,400 jobs were still furloughed as at 31 August 2020. London also had the highest
proportion of eligible jobs furloughed, at 13%.
Yorkshire and the Humber, the North East, the East Midlands and Northern Ireland saw
the lowest proportion of eligible employee jobs furloughed at 9% on the 31 August.
The table below shows the number of jobs furloughed as at 31 August 2020 as a
percentage of eligible employee jobs by region and gender.
Note that for over 144,000 furloughed jobs the region was unknown.15 Commons Library Briefing, 12 November 2020
Furloughed employee jobs by country and region
Coronavirus Job Retention Scheme Claims received as at 31 August 2020
Female Male Total
Jobs Jobs Jobs
furloughed % of eligible furloughed % of eligible furloughed % of eligible
(thousands) jobs (thousands) jobs (thousands) jobs
East 156.0 11% 130.7 9% 286.7 10%
East Midlands 110.4 10% 98.6 9% 209.0 9%
London 284.2 13% 273.2 13% 557.4 13%
North East 49.1 9% 46.9 9% 96.0 9%
North West 163.2 10% 156.0 10% 319.2 10%
Northern Ireland 35.4 9% 35.1 9% 70.5 9%
Scotland 123.8 10% 118.8 10% 242.6 10%
South East 239.0 11% 198.2 9% 437.2 10%
South West 132.8 10% 110.7 9% 243.5 10%
Wales 68.1 10% 62.3 10% 130.4 10%
West Midlands 137.3 11% 141.1 11% 278.4 11%
Yorkshire & The Humber 112.8 9% 107.2 9% 220.0 9%
Unknown 19.5 - 19.8 - 183.9 -
England 1,384.9 11% 1,262.6 10% 2,647.5 10%
Total 1,631.6 11% 1,498.8 10% 3,274.9 11%
Source: HMRC, Coronavirus Job Retention Scheme statistics: October 2020- data tables, 22 October 2020
Data on the number of jobs furloughed by parliamentary constituency can be found in the
excel sheet attached to this briefing.
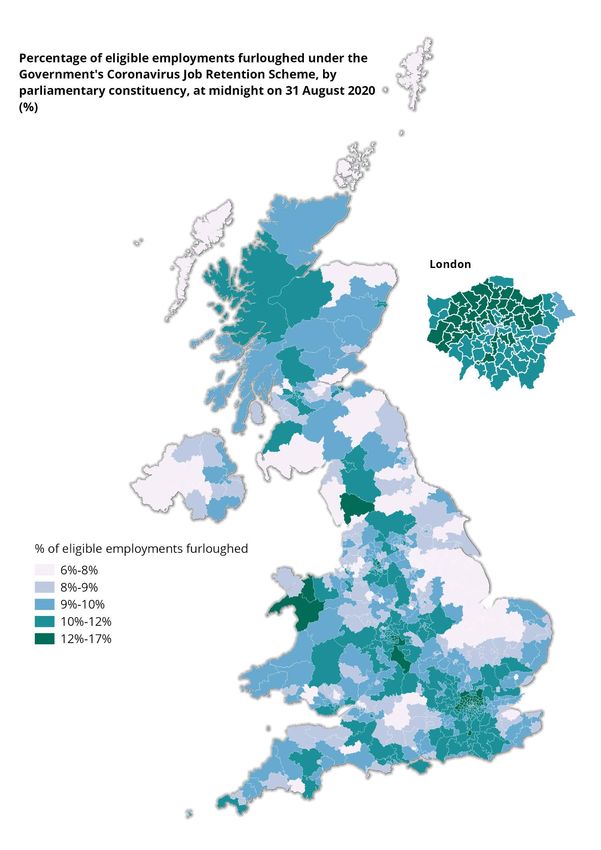
Constituency
The map overleaf shows the variation between constituencies of the percentage of
working age residents in each constituency that were still on furlough on 31 August 2020.
Note that for around 184,000 furloughed jobs, the constituency was unknown.16 Coronavirus: Impact on the labour market Source: HMRC, Coronavirus Job Retention Scheme statistics: October 2020- data tables, 22 October 2020
17 Commons Library Briefing, 12 November 2020

   3. Most affected workers
   Analysis produced to date suggests that workers who are from a BAME (Black, Asian, and
   Minority Ethnic) background, women, young workers, low paid workers and disabled
   workers, have been most negatively impacted economically by the coronavirus outbreak.
   For more information on workers disproportionally affected by coronavirus, please see the
   Library insight, Coronavirus: Which workers are economically impacted?

   3.1 Workers from minority ethnic groups
   The sectors most affected by the coronavirus pandemic, or ‘shut down sectors’ have a
   higher than average proportion of workers from a minority ethnic group. 18 15% of
   workers in the shut-down sectors the IFS outlines are from a minority ethnic group,
   compared to 12% of all workers.
   Some shut down sectors have an especially high proportion of workers from a minority
   ethnic group. Workers from a minority ethnic group make up 28% of the vulnerable jobs
   in the transport sector and 16% of the vulnerable jobs in the accommodation and food
   service sector. 19
   The Resolution Foundation finds that as of May 2020, Bangladeshi adults in work before
   the crisis were much more likely to have left employment altogether, while Black African
   adults were most likely to be working fewer hours and earnings less in May 2020, and
   least likely to have been furloughed. 20
   Note that these figures come from a small sample and should be treated as estimates.

   18
      Reliable data for more specific ethnic groups is not available because of small survey samples.
   19
      Library analysis of the Labour Force Survey, 2019 Q4, using IFS definition of vulnerable sectors.
   20
      Resolution Foundation, The Living Standards Audit 2020, 21 July 2020
18 Coronavirus: Impact on the labour market
A survey by the Runnymede Trust found that only 35% of people from an ethnic minority
said they had not been affected financially by the coronavirus pandemic, compared to
54% of people from a White ethnic group.
They find that 43% of people from a Bangladeshi ethnic group and 38% of a Black
African group the loss of some income, as shown in the chart below. 21
A BMG poll for the Independent estimates that on 7-9 April approximately 46% of people
from a BAME ethnic group reported their household income had reduced as a result of
coronavirus, compared to around 28% of people from a White British Ethnic group.
Around 15% of respondents from a BAME ethnic group reported losing their jobs,
compared to an estimated 8% of people from a White British ethnic group. 22
3.2 Women
57% of shut down sectors are women, compared to a workforce average of 48%. 23
Women were about one third more likely to work in a sector that is now shut down than
men: one in six (17%) female employees were in such sectors, compared to one in seven
(13%) male employees. 24
According to the IFS, mothers are 1.5 times more likely than fathers to have lost their job
or quit since the start of the lockdown and are also more likely to have been furloughed.
Mothers who were in paid work in February are 9 percentage points less likely to be
currently working for pay than fathers. 25
The Women’s Budget group fund that women are more likely to be in the categories
above – women make up 69% of low earners, 54% of temporary employees, 54% of
workers on zero-hours contracts, and 59% of part-time self-employment. 26
21
Runnymede Trust, Over-Exposed and Under-Protected, The Devastating Impact of COVID-19 on Black and
Minority Ethnic Communities in Great Britain, August 2020
22
Independent, Coronavirus economic effects hitting ethnic minorities and young people hardest, 14 April
2020.
23
Library analysis of the Labour Force Survey, 2019 Q4, using IFS definition of vulnerable sectors.
24
Institute for Fiscal Studies, Sector shutdowns during the coronavirus crisis: which workers are most
exposed?, 6 April 2020.
25
Institute for Fiscal Studies, How are mothers and fathers balancing work and family under lockdown?, 27
May 2020.
26
Women’s Budget Group, Crises Collide, Women and Covid-, 9 April 2020.19 Commons Library Briefing, 12 November 2020
3.3 Young and older workers
The youngest and oldest workers are most likely to have been furloughed and more likely
to be out of work.
Employees aged under 30 and 65+ are more likely to have ever been furloughed in the
March-June period, or to be out of work in June. Average hours worked fell between
2019 Q4 and 2020 Q2 by around a third for the very youngest (aged under 22) and oldest
(aged 65+), compared to 15-20% for those in their 30s and 40s. 27
6% of those aged 66-70 and 11% of those aged 71+ who were working immediately
before the crisis are now retired, half of whom were not planning to do so anyway. 28
Part of the reason for the disproportionate effect on young people is age the distribution
in different sectors. Library analysis of the Labour Force Survey shows that of the workers
in the shut-down sectors outlined by the IFS, nearly half are under 35.
Nearly half of workers in shut down sectors are under 35
25%
24% 24%
20%
18%
15% 16%
13%
10%
5%
4%
0%
16-24 25-34 35-44 45-54 55-64 65+
Source: Labour Force Survey, Q1 2020
According to the IFS, employees aged under 25 were about two and a half times as likely
to work in a sector that is now shut down as other employees. 29
The IFS find that those under 25 are more exposed to jobs that cannot be worked from
home, these difference across age groups are larger for those with GCSE qualifications or
less. 30
The IFS find that coronavirus is also likely to disrupt career progression for those early in
their career. Early career wage growth is driven by workers moving into higher-paying
occupations and because of reductions in vacancy postings and increases in layoffs, this
has become much more difficult. 31 The Resolution Foundation suggests that many
graduates will delay their entry into the labour market by staying in education. 32
27
Resolution Foundation, An intergenerational audit for the UK 2020, 7 October 2020.
28
Institute for Fiscal Studies, The coronavirus pandemic and older workers, 30 September 2020.
29
Institute for Fiscal Studies, Sector shutdowns during the coronavirus crisis: which workers are most
exposed?, 6 April 2020.
30
Institute for Fiscal Studies, Covid-19: the impacts of the pandemic on inequality, 11 June 2020.
31
Institute for Fiscal Studies, COVID-19 and the career prospects of young people, 03 July 2020.
32
Resolution Foundation, An intergenerational audit for the UK 2020, 7 October 2020.20 Coronavirus: Impact on the labour market
3.4 Low paid workers
Median weekly wages in the most vulnerable sectors are among the lowest in the
economy. 33 The Resolution Foundation estimates that the median weekly pay for a worker
in a shut-down sector is £348, compared to £707 a week for workers they calculate can
work from home. 34 The IFS found that one third of employees in the bottom 10% of
earners work in shut down sectors, compared to 5% in the top 10%. 35
The IFS estimate that excluding key workers, 80% of people in the bottom tenth of the
earnings distribution are wither in a shut-down sector or are unlikely to be able to do their
job from home, compared to 25% of the highest earning tenth. 36
A PwC Research survey on 16-19 April found that 70% of those earning more than
£50,000 a year continued to work their usual hours, compared to 40% of those earning
less than £20,000. 37
ONS figures show that less than 10% of the bottom half of earners say they can work
from home. 38
3.5 Disabled workers
Before the coronavirus outbreak, disabled people had an employment rate 28.6
percentage points lower than that of people without disabilities. This difference is often
referred to as the disability employment gap. 39
15% of workers in shut down sectors are disabled (as defined by the Equality Act 2010),
about the same as the total workforce average of 14%. Disabled workers make up 17%
of vulnerable jobs in the retail sector. 40
Disability groups have raised concerns about the impact the outbreak will have on
disabled people in work. In a submission to the Work and Pensions Committee for the
DWP’s response to the coronavirus outbreak inquiry, Disabled People Against Cuts noted
that disabled workers have reported difficulties getting access to workplace adjustments
and equipment to enable them to work from home. This places disabled workers at a
considerable disadvantage. 41
33
ONS, Annual Survey of Hours and Earnings, 2019.
34
Resolution Foundation, Risky business, Economic impacts of the coronavirus crisis on different groups of
workers, 28 April 2020.
35
Institute for Fiscal Studies, Sector shutdowns during the coronavirus crisis: which workers are most
exposed?, 6 April 2020.
36
Institute for Fiscal Studies, Covid-19: the impacts of the pandemic on inequality, 11 Jun 2020.
37
PwC, Covid-19, UK Economic Update, 20 May 2020.
38
Resolution Foundation, The economic effects of coronavirus in the UK, 10 April 2020.
39
ONS, Labour market bulletin, July-September 2019. See also Library paper People with disabilities in
employment, January 2020.
40
Library analysis of the Labour Force Survey, 2019 Q4, using IFS definition of vulnerable sectors.
41
Disabled people Against Cuts’ (DPAG) submission to Work and Pensions Committee inquiry into the DWP’s
response to the coronavirus outbreak, 23 April 2020.21 Commons Library Briefing, 12 November 2020 4. Further Reading 4.1 House of Commons Library This is a fast-moving issue and briefings should be read as correct at the time of publication Coronavirus This page provides links to reports from the Commons Library, the Parliamentary Office of Science and Technology (POST) and the Lords Library. People claiming unemployment benefits by constituency Extending furlough via the Coronavirus Job Retention Scheme Which ethnic groups are most affected by income inequality? Coronavirus: Employment Support Youth unemployment statistics Coronavirus: Which workers are economically impacted? FAQs: Coronavirus Job Retention Scheme. Coronavirus: Support for businesses Coronavirus: Employment rights and sick pay (update) Coronavirus: Support for household finances Coronavirus: Latest economic data Coronavirus: Effect on the economy and public finances The UK economy: a dashboard Coronavirus: The importance of different sectors to the economy 4.2 Other sources Coronavirus (COVID-19) roundup This page is a summary of insights from the most recent ONS analysis and will be updated as new publications are released | ONS Coronavirus and the latest indicators for the UK economy and society 5 November 2020 | ONS Wake me up when November ends: The economic outlook amid Lockdown II 3 November 2020 | Resolution Foundation Coronavirus and the social impacts on Great Britain 30 October 2020 | ONS Understanding the impact of the coronavirus at a local level 30 October 2020 | ONS Jobs, jobs, jobs: Evaluating the effects of the current economic crisis on the UK labour market 27 October 2020 | Resolution Foundation Sorting it out: The Chancellor moves to fix the Job Support Scheme 22 October 2020 | Resolution Foundation
22 Coronavirus: Impact on the labour market

   An intergenerational audit for the UK 2020
   7 October 2020 | Laura Gardiner et al, Resolution Foundation
   Over-Exposed and Under-Protected, The Devastating Impact of COVID-19 on Black and
   Minority Ethnic Communities in Great Britain,
   August 2020 | Zubaida Haque et al. Runnymede Trust
   Dataset: Business Impact of COVID-19 Survey (BICS)
   5 November 2020 | ONS
   Coronavirus Business Impact Tracker
   19 August 2020 | British Chamber of Commerce
   Understanding the impact of coronavirus on the workforce
   11 May 2020 | ONS
   Measuring the labour market during Coronavirus
   20 April 2020 | ONS
   Ensuring the best possible information during COVID-19 through safe data collection
   27 March 2020 | ONS
About the Library
                   The House of Commons Library research service provides MPs and their staff
                   with the impartial briefing and evidence base they need to do their work in
                   scrutinising Government, proposing legislation, and supporting constituents.
                   As well as providing MPs with a confidential service we publish open briefing
                   papers, which are available on the Parliament website.
                   Every effort is made to ensure that the information contained in these publicly
                   available research briefings is correct at the time of publication. Readers should
                   be aware however that briefings are not necessarily updated or otherwise
                   amended to reflect subsequent changes.
                   If you have any comments on our briefings please email papers@parliament.uk.
                   Authors are available to discuss the content of this briefing only with Members
                   and their staff.
                   If you have any general questions about the work of the House of Commons
                   you can email hcenquiries@parliament.uk.
                   Disclaimer
                   This information is provided to Members of Parliament in support of their
                   parliamentary duties. It is a general briefing only and should not be relied on as
                   a substitute for specific advice. The House of Commons or the author(s) shall
                   not be liable for any errors or omissions, or for any loss or damage of any kind
                   arising from its use, and may remove, vary or amend any information at any
                   time without prior notice.
                   The House of Commons accepts no responsibility for any references or links to,
BRIEFING PAPER     or the content of, information maintained by third parties. This information is
Number 8898
                   provided subject to the conditions of the Open Parliament Licence.
12 November 2020
You can also read