The FIFA World Cup and the Hours of Work of American Males * Very preliminary * Fernando Antonio Lozano
←
→
Page content transcription
If your browser does not render page correctly, please read the page content below
The FIFA World Cup and the Hours of Work of American Males

                                     * Very preliminary *

                                 Fernando Antonio Lozano*

                                  Department of Economics
                                      Pomona College
                                  425 North College Avenue
                                    Claremont CA 91711

       In this paper I document changes in the hours worked by American males during
       the FIFA Soccer World Cup. The World Cup is a natural experiment that can be
       used to estimate the sensitivity of a worker’s allocation between leisure and
       market work during events whose timing overlaps with he workday. To estimate
       the effect that an event like the world cup has on hours of work my empirical
       strategy exploits two sources of exogenous variation: the first one is the calendar
       timing of the World Cup as it occurs in June/July every four years, this allows
       me to compare labor market outcomes in June/July for a worker in World Cup
       year t, with the outcomes in June/July for a worker in non-World Cup years t+1,
       t+2 and t+3.The second type of variation is the scheduled time at which games
       are played. The hour of the day when games are played differentially affects
       hours of work across different regions of the United States. For example during
       the Korea-Japan 2002 World Cup most of the games were at 8:30 pm Eastern
       Asia time, this is 7:30 am on the East Coast and 4:30 am on the West Coast. My
       results show that after controlling for observable demographic characteristics the
       average American male reduces his weekly number of hours of work during the
       World Cup by statistically significant estimates that range from 1 5 hour to 1 2
       hour, depending on specification choice and time of the day in which games are
       played.

*
    Please send correspondence to fernando.lozano@pomona.edu
1

1. Introduction

       Economists have long been concerned with understanding how economic agents

allocate their time between leisure and paid labor. Recent research that addresses this

question include Connolly (2008) who shows that the whether determines a worker’s

allocation of market hours as they supply more hours during rainy days than in sunny

days, or Gonzalez-Chapela (2007) who shows that as prices of recreation goods

(complements of leisure) raise, the number of hours of work of American workers also

increase. While the above papers document changes in the number of hours of work due

to changes in the prices of substitutes (good weather) or complements (recreation) goods,

we cannot say anything whether workers would decrease their hours of labor when there

is an event that overlaps with market work during the workday. If workers value such

event enough, then is conceivable that they choose to consume the event rather than show

up to work. In this paper I use the FIFA World Cup (world cup, hereafter) to analyze how

people change their time allocation in the face of an event that requires skipping work to

consume it. As the World Cup is played every four years in a different host country

which is determined exogenously from the U.S. labor markets, it presents a useful natural

experiment that should contribute to our understanding of this labor-leisure tradeoff.

       The world cup has recently received some attention by economists. For example,

Dohmen et al (2007) use an opinion survey in Germany to argue that the performance of

the German national team improved in the 2006 world cup, the economic sentiments and

expectations of Germans increased. Similarly Edmans et al (2007), use cross section of

countries to show that when a country’s national team looses in the world cup, the

country’s stock market will observe al loss of 64 basis points in the following trading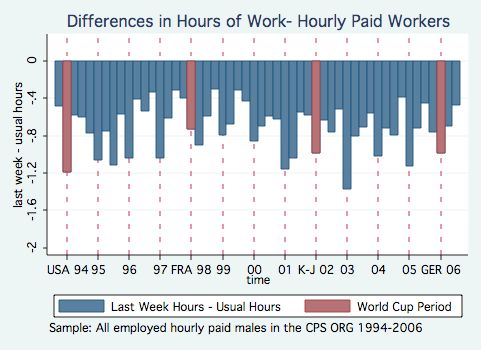
2

day. Differently to these papers, I focus my attention in workers living in the United

States. While it has been argued that American workers don’t care much about soccer,

maybe due to the over saturation of the American sports scene with already four

professional established leagues (Markovits and Hellerman, 2001), this does not seem to

be true during the world cup. For example, for the 2006 soccer world cup television

ratings in the U.S. indicate that almost 17 million Americans watched the final match

(New York Times, 2006); this figure is equivalent to the viewership in the same year for

the NCAA Basketball finals, and surpasses by 4 million the NBA finals in that same year.

       My empirical strategy to estimate the causal effect that the world cup has on a

worker’s market hours consists in taking advantage of two independent sources of

variation: the calendar timing and the schedule timing of the world cup. Specifically,

since the world cup occurs every four years during the summer, this allows me to

compare the hours of work in world cup year t with the hours of work of a

demographically equivalent worker in non-world cup year t+1. Furthermore, FIFA

(international soccer’s governing body) determines exogenously the place where the

world cup is played and due to differences in U.S. local times, changes in the hours of

work of American workers should vary according to which country hosts the tournament.

That is games played in different countries are televised live at different local times, and

the time games are televised locally will determine whether the timing of the world cup

overlaps with the worker’s regular work schedule. For example in France 1998 most of

the games were played at 9:00 pm Central European Time; this is 4:00 pm on the U.S.

East Coast and 1:00 pm on the Pacific Coast. In contrast, in Korea-Japan 2002 most of

the games were at 8:30 pm Eastern Asia time, this is 7:30 am on the East Coast and 4:30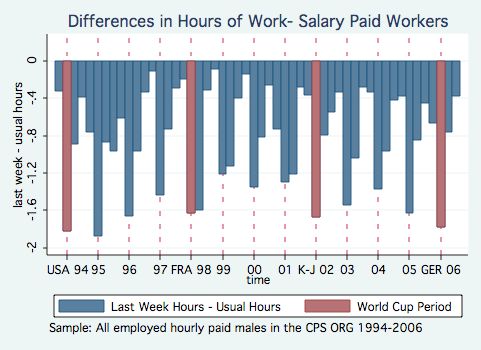
3

am on the West Coast. In a sense, my strategy is similar to Hamermesh et al (2008) who

analyze the timing and coordination between a person’s activities and local television

schedules. They show that the timing of market work is determined by coordination with

people in other times zones and their local television schedules. Similarly, I hypothesize

that when the world cup is played in different host countries, the effect on the work

decision of American workers varies accordingly to the time games are televised in the

U.S.: when the games are televised early in the morning or late in the afternoon,

Americans will not reduce their hours of work as much as if games are televised between

9 am and 4 pm locally.

       My results show that after controlling for observable demographic characteristics,

as well as year and monthly fixed effects American males reduced their weekly hours of

work on average during the world cup up to    1
                                                  2   hour – or one of every three workers

reduces their weekly hours by the time it takes to watch a complete soccer match (90

minutes plus fifteen minutes half time intermission). Interestingly, this reduction in hours

of work is concentrated among salary paid workers. This is perhaps significant because

the opportunity cost of leisure in the short run among these workers is arguably zero or

very small, while for hourly paid workers the short run opportunity cost of leisure is their

hourly wage. Further my results suggest that this reduction in hours of work is

heterogeneous across different income levels: differences between world cup periods and

all other times are zero among the lowest earners, and the hours of market work during

the World Cup decrease as we move to the right of the distribution of observed wages.

       Finally in this paper I investigate whether any reduction in hours of work during

the world cup is compensated with an increase in the hours worked either in the month
4
before the world cup, or the month after it. This would be the case if salaried paid
workers contracted with their employers to work for a set number of hours during certain
period, and reducing their number of hours in during the world cup period t will imply an
increase in period t-1 or t+1. The results in the paper show that among salaried paid
workers reductions of labor during the world cup are not accompanied with an increase in
hours in either the next time period or in the period before.
The rest of the paper is structured as follows: section two introduces the data and
my measurement strategy. Section three introduces my empirical specification. The
results are presented in section four, and section 5 concludes.
2. Data
In this paper I use data from the 1994-2006 NBER Collection of the Current
Population Survey Outgoing Rotations Groups (CPS OGR). The CPS ORG is a
nationally representative survey of American households. It is collected each month
during the week containing the 19th of each month and the labor market questions in it
refer to the week that contains the 12th of each month. Each monthly collection of the
CPS is composed of eight nationally representative samples called rotations, which enter
sequentially into the survey. Each rotation stays in the survey for 4 consecutive months,
then is taken out of the survey for 8 months, and then returns into the survey for 4 extra
months. In the 4th and 8th time a household is interviewed, the CPS administers a special
supplement that asks about the respondent’s labor market questions, including usual
hours worked in the main job, actual hours worked last week in the main job, and weekly
earnings.5
In order to identify variations in hours of work between households that are
surveyed during the world cup and not, I estimate the difference between the
respondent’s hours worked last week and his usual hours of work. These two questions
are consistent as they refer to the hours of work in the respondent’s main job, and the
only difference is the time frame they refer to1. A negative difference between last week
hours and usual hours means that the hours of work last week were less than the hours in
the usual week – a positive difference means that hours in the usual week are less than
hours last week. The null hypothesis to test is whether the difference between usual and
last week hours is zero, and during the world cup I expect these difference in hours of
work to be negative. Hereafter I will refer to this difference as the “weekly working gap.”
The sample in this paper includes all employed males in the CPS between 1994
and 2006. Notice that during this time four world cups were played: USA 1994, France
1998, Korea-Japan 2002 and Germany 2006. To control for outliers, I drop observations
weekly working gap are greater than the 99th percentile and observations that are smaller
than the 1st percentile. I also drop all observations whose hourly wage is smaller than
$2.00. All monetary units are in real dollars where the base period is January 1994. Basic
summary statistics are presented in Table 2, the first column presents means for
observations surveyed in months other than a world cup month and the second column
presents means for observations surveyed in months during the world cup. The top panel
presents means for all observations in the sample, and the bottom panel presents
1
The question for usual hours is HRUSL1: How many hours per week (do/does)
(name/you) USUALLY work at (your/his/her) (job?/main job? By main job we mean) (the
one at which (you/he/she) usually) ((work/works) the most hours.) and the question for
actual hours is HRACT1: ((LAST WEEK/THE WEEK BEFORE LAST)/So, for (LAST
WEEK/THE WEEK BEFORE LAST)), how many hours did (you/he/she) ACTUALLY
work at (your/his/her) (job?/MAIN job?)6
observations that are salary paid. There are two important points to note in these raw
estimates when analyzing the complete sample: first usual hours worked are 0.22 hours
greater when the world cup is at play than during other months -- this is most likeley
because the world cup is played during summers--, while hours worked last week are
shorter during world cup months by 0.31 hours. Second, the proportion of employed
workers who did not work last week is greater during the world cup months as well – and
this difference is 1.3 percentage points. If I restrict the sample exclusively to salaried paid
workers, usual hours of work are indistinguishable between world cup and non world cup
surveys, but the difference in hours worked last week is almost an hour worked shorter
during the world cup months. Importantly, the proportion of employed workers reporting
zero hours last week is twice as big during world cup months than at other times.
Figure 1 shows differences between last week hours and usual hours for 48
periods of time between 1994 and 2006. The top panel refers to salary paid workers, and
the bottom panel refers to hourly paid workers. Each period is composed as follows:
Period 1 contains observations surveyed during March(t), April(t) and May(t); Period 2
contains observations surveyed during June (t) and July(t); Period 3 contains observations
from the August(t), September(t), and October(t) surveys and Period 4 from the
November(t), December(t) and January(t+1) surveys. The data in these figures highlights
three facts: First, differences in hours of work between last week’s hours and a usual
week’s hours tend to be negative, this is not surprising as workers tend to take days off,
holidays, sick leave and vacation. Figure 1 also shows that American workers do tend to
work less hours last week on average during the world cup than at other periods, but
these differences do not seem greater than differences in other June/July periods. Finally,7
these data shows that the variance in difference between last week and usual hours is
greater among salaried paid workers than among hourly paid workers – which is not
surprising salaried paid workers have more discretion over their hours of work in the
short run than hourly paid workers (Bureau of Labor Statistics, 2005).
3. The FIFA World Cup
The FIFA Soccer World Cup is played every 4 years. All countries that are
members of FIFA must qualify in regional tournaments to play in the final round where
are games are played in he host country over the span of a month. Until the 1998 world
cup the final round consisted of 24 teams, and since then the number of teams playing in
the final round has increased to 32. For example the 2006 finals were played by 5 African
teams, 4 Asian teams (including the Middle East), 1 team from Oceania, 4 teams from
Central America, North America or the Caribbean, 4 from South America and 14 teams
from Europe. These 32 teams are divided into 8 groups of 4. The top two teams in each
group (16 total) qualify to the second round, where the tournament takes a format of
direct elimination. The second round is followed by the quarterfinals (third round) which
consist of every winner of the second round (8 in total). The winners from each
quarterfinal play in the semifinals, and finally the grand final ad third place match that are
played a month after the tournament started.
Table 1 presents information on local times and dates in which games were
played for each of the four world cups covered by the sample. Importantly, note that even
within world cup years there is variation in the calendar dates that the world cup is
played, and hence the CPS will observe different stages of the world cup in different8
years. In particular, USA 1994 was played from June 17 to July 17, and two CPS surveys
capture world cup games in these days. The June survey, whose reference week refers to
the days 12-18, includes the inauguration and first round games and the July survey
includes the semifinals, the third place game and the grand final. France 1998 was played
from June 12 to July 10 and also includes observations on the June survey when the first
round was played (reference week June 7 to June 13) and the July surveys as the
tournament’s final took place on Sunday of the reference week (July 12 to July 18). In
contrast, Korea-Japan was played from May 31st to June 30th, and the June survey’s
reference week includes 23 first round games. Germany 2006 was played between June
9th and July 9th, and the June survey includes first round games from the week of June 11-
June 17 plus the final match who was played on Sunday of the July survey’s reference
week.
The identification strategy on this paper assumes that FIFA’s decision of where
and when the world cup is played is independent from the U.S. labor markets. If the
choice of host country is done to maximize television viewership in the U.S then using
variation in the time at which games are televised in the U.S.’s fails to identify workers’
decision between market hours and time spent watching the world cup. If such is the
case, then it is conceivable that the world cup games are scheduled at times that
maximize viewership, and in the absence of those games American workers will consume
other types of leisure anyway, and observed decreases of hours of work during the world
cup will be spurious. This seems unlikely: First, the world cup’s host country is chosen 7
years in advance of each tournament by FIFA’s executive committee. The host country is
chosen by a single transferable vote system, and each candidate country must fulfill the9
requisite of not belonging to the regional federation that hosted any of the previous two
world cups2. But even if the decision by FIFA’s executive committee is made by
forecasting the best time to maximize U.S. viewership, variation across different local
time zones across different world cups will identify the effect of the world cup on hours
of work.
4. Empirical Strategy
The empirical strategy in this paper consists in comparing the difference between
hours of work last week and usual hours of work – heuristically this is similar as a match
pairs estimation where we observe for the same observation’s hours during the world cup
(hours last week) and hours at other times (usual hours of work). Specifically I estimate
the following equation:
Giyt = WCiyt + x |iyt + iyt (1)
where Giyt represents the gap between last week and usual hours, WCiyt is an indicator
variable that takes a value of one during a world cup month, and zero otherwise; x iyt is a
vector of demographic characteristics that may or may not vary with time (age, age
square, education, state, year dummies and occupation fixed effects). The subscript i
represents each worker, y represents each year and t represents each month. The
parameter of interest is which represents the change in hours of work during the world
cup, < 0 means that hours last week are smaller than usual hours in the main job.
Equation 1 will estimate consistently as long as cov(WCiyt ,iyt ) = 0 which is an
2
This is a recent change followed a rotation system until 2002 world the host nation
alternated between Europe and America.10
implausible assumption. As suggested with Figure 1 it is quite possible that hours of
work are lower during the World Cup because this event takes place during the summer,
and hours of work decrease during summers anyway even in the absence of the world
cup. Alternatively it may be that hours of work are less during the world cup because of
some idiosyncratic macroeconomic phenomenon during 1994, 1998, 2002 and 2006 – a
time variant characteristic. To control for this I decompose iyt = μt + y + iyt where y is
a year specific component, μt is a month specific component and iyt is a random
variable assumed to have mean zero and iid across observations. Estimating equation 1
with year and month fixed effects estimates consistently as long as differences in hours
of work within each period of time are time invariant and cov(WCiyt , iyt ) = 0 .
An alternative specification, that relaxes the time invariance assumption, is to take
advantage of the scheduled times the world cup is played. As mentioned above, the world
cup is played in a different country every four years, which generates variation in the
time games are televised in the United States. For example, during the USA 94 World
Cup most games were played at 4:35 pm eastern time, and 1:35 pm in the pacific coast.
In the other hand, during the Korea-Japan 02 World Cup games that were played at 20:30
pm Asian Standard Time, were televised at 7:30 am in the United States’ East Coast, and
at 4:30 am in the Pacific Coast. As argued in the previous section, the variation in the
choice of host country and therefore times games are televised in the United States is
assumed to be exogenous because FIFA’s Executive Committee chooses the country
where the world cup will be played arbitrarily. To take advantage of this variation I
estimate the following equation:
Gijt = 1T1ijt + 2T2 ijt + 3T 3ijt + x |ijt + ijt (2)11
where T1ijt equals one if games were televised in region j between 12 am and 6 am and
zero otherwise, T2 ijt takes a value of one if games were televised in region j between 6
am and 12 pm, and T3ijt takes a value of one if games were televised between 12 pm and
6 pm in region j. For this specification I use the time when most of the games were
played during the reference week of the World Cup month, and this is the time marked
with a star in Table 1. Under this strategy, note that none of the games were played
between 6 pm and 12 am in the different U.S. local times, and the control group is all
observations in months when the world cup is not played.
5. Results
Raw estimates of equations 1 and 2 are presented in Table 2, the first two columns
correspond to all workers in the United States, and the second two columns are salaried
paid workers only. The first row represents the difference between actual hours and usual
hours in times when the word is not in play. Across all groups and specifications, this
number is robust at values of -0.736 hours worked less for all workers and
-0.781 for salary paid workers. These estimates translate roughly to 45 minutes per week.
It makes intuitive sense that these differences are negative as hours last week are likely
zero sometimes because people take vacations, sick leave, and temporary separations
from the job – and as long as the separation is temporary and the job is still the
respondent’s main job usual hours will be non-zero. The second row presents estimates of
for equation 1, suggesting that workers reduce their hours of work by half an hour
during the world cup before any type of controls are added, and salaried paid workers
decrease their market hours by a little bit more than an hour. The third, fourth and fifth12
row represent the estimates for 1, 2 and 3 in equation 2. These estimates suggest that
all American workers do not reduce their hours of work when games are played between
12 am and 6 am, they do reduce their hours by 4
10 of an hour (24 minutes per week) when
games are played between 6 am and 12 pm, and by 6
10 of an hour (36 minutes per week)
when games are played between 12 pm and 6 pm. The estimates for salary paid workers
suggest that any differences in market labor during the world cup is concentrated among
this group. In particular, there are no observed statistically significant differences when
games are played between 12 am and 6 am, but there is a statistically significant
reduction of almost an hour (54 minutes per week) when games are played between 6 am
and 12 pm, and a reduction of more than an hour (70 minutes per week) when games are
played between 12 pm and 6 pm.
Table 3 presents ordinary least squares estimates when controls are added to
equations 1 and 2. The first two columns present estimates for all workers that include
education, age, age squared, state, month fixed effects, and year fixed effects. The third
and fourth column present estimates for all workers that include occupation-year cross
product fixed effects. The next four columns replicate the first four, but for salaried paid
workers exclusively. The estimates across specifications are quite robust and suggest that
even after controlling for month and year fixed effects American workers reduce their
number of hours of work during the world cup. For example, column 3 suggests that after
controlling for observable characteristics all American workers reduce their hours of
work by an average of 15 weekly minutes during the world cup. Column 4 suggest that
after controlling for demographic characteristics all American workers supply 12 minutes
more per week if the games are between 12 am and 6 am, if games are between 6 am and13
12 pm American workers supply on average a little bit less than 15 minutes per week,
and if games are between 12 pm and 6 pm workers supply on average 15 minutes less per
week. These estimates do not seem out of line, and make intuitive sense, as they suggest
that one out of eight American workers watch a world cup game every week when the
world cup is played between 6 am and 6 pm. It is worth noting that the coefficient for
world cup games between 12 am and 6 am is positive for all American workers. While I
am not sure what may be the reason for this, I can conjecture, that some workers
especially those on the hospitality business, supplied longer hours of work during the
world cup when the games were played at such an unorthodox time3. When I restrict from
my sample salary paid workers, the estimates of the hours gap during the world cup are
zero when games are played between 12 am and 6 am, and half an hour when games are
played between 6 am and 6 pm. Again, these results suggest that 1 of every 3 salaried
paid Americans watch a world cup game per week.
Finally, it is not clear whether wages should be included in equations 1 and 2, as
wages may determine changes in the hours of work during the world cup, and preferences
for leisure may determine jointly the number hours of work and wages for a given
worker. Furthermore, when using CPS data wages are calculated by dividing usual
weekly earnings over usual weekly hours of work, and the denominator will be part of the
dependent variable in equations 1 and 2. Nevertheless, and assuming that we can identify
the role that wages have on the gap between hours last week and usual hours, I estimate
equations 1 and 2 to include up to a quartic term in log wages, plus interactions between
3
If I remove from my sample workers in the services and hospitality industry this
coefficient becomes statistically zero.14
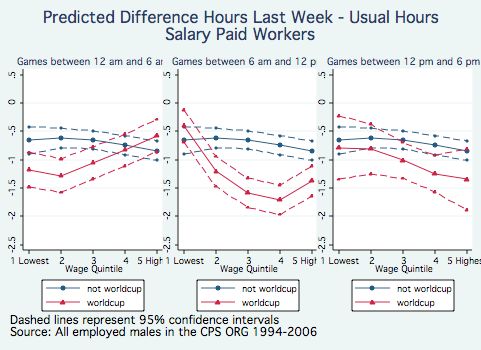
the world cup variables and log wages4. The results are presented in Figure 2: the top
panel shows the estimated gap for equation 1 and the lower panel shows the same gap for
equation 2. In both cases, and as in Table 3, the bulk of the differences are concentrated
among salaried paid workers. Furthermore as we move across the distribution of wages
from lowest earners to highest earners the magnitude of the difference between usual and
actual hours increases. That is salaried paid American workers with higher income are
more likely to watch a soccer world cup match game than lower income Americans,
suggesting that the income elasticities of leisure during the world cup are positive.
A different issue to address is whether salaried workers have a contact with their
employers that specifies a fixed number of hours of work in a set period of time, as
suggested by the results in Conolly (2008). If this is the case, then it must be that
reductions of hours of work during the world cup shall be accompanied by increases in
hours of work in the periods before or after the world cup. To address this question I
estimate the following equation for salaried workers exclusively:
Giyt = B Biyt + WC WCiyt + A Aiyt + x |iyt + iyt (3)
where Biyt represents a dummy variable that takes a value of one if the observation was
surveyed in the month before the world cup started, and Aiyt represents a dummy variable
that takes a value of n if the observation was surveyed in the month after the world cup. If
salaried paid workers do have a contract that specifies a set number of hours then it is
possible that B + A WC . Alternatively, I estimate whether changes in labor supply
during the world cup are compensated with changes in the hours of work in the months
4
As usual hours enters in the left side of the equation with a negative sign and in the
denominator on the right side of the equation my intuition with higher hourly wage due to
relatively low usual hours will bias the estimate of towards zero as higher earnings will
be associated with longer actual worked hours.15
after and before the world cup across different times when the world cup is played. To do
so I estimate the following equation for salaried workers:
Gijt = ( B
k
BTkijt + WC
k
WCTkijt + Ak ATk ijt ) + x |ijt + ijt (4)
k=1,2,3
Equation (4) is analogous to equation (2) and BT1ijt takes a value of one if the
observation was surveyed during the month before to a world cup where most of the
matches were played between 12 am and 6 am local US time; WCT1ijt takes a value of
one if an observation was surveyed during a month when the world cup was played
between 12 am and 6 am local U.S. time; AT1ijt takes a value of one if the observation
was surveyed during the month after a world cup where most of the matches were played
between 12 am and 6 am local US time. Similarly BT2 ijt , WCT2 ijt , AT2 ijt are defined for
world cups when games are played between 6 am and 12 pm local time, and BT 3ijt ,
WCT 3ijt , AT 3ijt are defined for world cup when games are played 12 pm and 6 pm.
Estimates of equation (3) are presented in Table 5. The estimates in the first and
third columns represent results from estimating equation (3) and results in the second and
fourth columns present estimates from equation 4. Specifically, the top panel presents
estimates of B , WC and A ; the second panel presents estimates of 1B , 1WC and 1A ;
similarly the third and fourth panel present estimates when k=2 and k=3 respectively.
The results in the first two columns, which do not control for any observed demographic
characteristics suggests that hours of work are lower during months when the world cup
is played and in months after the world cup is played as well. This is not surprising as the
world cup occurs mostly during June/July and the month following it will be either July16
or August. In contrast, estimates for the month before the world cup are positive in all
cases but when games are played between 12 am and 6 am local U.S. time.
Adding controls for observable demographic characteristics and year occupation
fixed effects suggest that reductions in hours of work during the world cup are not
accompanied with increases in hours of work in the month before or after the world cup.
For example, without controlling for differences in hours of work for when the games are
played in the U.S. local times, a reduction of 0.41 hours of wok during the world cup are
accompanied with statistically insignificant estimates that are not different to zero in the
months before and after the world cup. When I differentiate between different U.S. times
the games are played the results vary little: When games are played between 6 am and 12
pm, American workers reduce their hour of work by 6
10 of an hour, while the months
after and before do not report statistically significant changes in hours of work. When
games are played between 12 pm and 6 pm, workers reduce their hours of work by 4
10 of
an hour – this estimate is marginally statistically significant with a p-value of 0.06 –
while here are no changes in the hours of work before or after the world cup. In contrast,
estimates when the world cup is played between 12 am and 6 am U.S. local time show no
differences in hours of work during the world cup or the month after the world cup, but in
May 2002 salaried paid workers supplied almost half an hour less than at other times.
This estimate is surprisingly statistically significant and cannot be explained with
worker’s adapting their hours of work due to the world cup5.
5
While I cannot explained this variation in the data, note that month and year fixed
effects control for time invariant differences in hours of work, but if there is a time
variant factor that changes hours of work in My 2002, my model fails to distinguish this.17
6. Summary
In this paper I show that American workers will reduce their hours of work when
the timing of an event they care to see overlaps with their market labor. The FIFA soccer
world cup presents a good natural experiment to show that this hypothesis is true. In here
I take advantage of two exogenous sources of variation: the place where the world cup is
played which determines that the games will be televised in the United States at different
hours during the day, and the fact that the world cup is played every four years which
allows for inter-annual comparisons. My results suggest that American males supply 15
minutes of work less during the world cup, a result that indicates that 1 in 9 Americans
watch a weekly game. The magnitude of these estimates is greater among salaried paid
workers, who reduce their hours of work by half an hour on average per week, this
indicates that 1/3 of all salarypaid workers watch a world cup game per week. Further,
my results do not present any evidence that reductions of hours of work during the world
cup are accompanied with rises in the number of hours of work in the month before or
after the world cup. This suggests that salaried paid workers have more discretion over
the number of hours they work, and that their contracts do not necessarily stipulate a
fixed number of hours of work.
A back of the envelope calculation suggests that the forgone market labor due to
the world cup is rather modest in terms of wages. If the average salary paid worker in the
U.S. had an hourly wage of $16 dollars, and the total number of salary paid American
males is approximately 38,000,000, then the approximate value of forgone market labor
by Americans during a week of world cup play is 16 38,000,000 1 2 = 300,000,000 ,
which multiplied by 4 weeks it comes out to $1.2 billion per world cup. In an economy18 that annually produces more than 13 trillion dollars per year, this effects are modest and even more as these reductions in hours of work occurs every four years. One only wonders, whether these results are robust if some of the of the other principal American sports events where to occur during the work day and what will be the trade-off between consumption for such event and paid market work.
19

References

Bureau of Labor Statistics (2005). “Workers on flexible and shift schedules in May
     2004”. News, Friday, July 1, 2005, USDL 05-1198. Washington, DC: U.S.
     Department of Labor.

Camerer, Colin, Linda Babcock, George Lowenstein, and Richard Thaler. (1997). “Labor
     supply of New York City cabdrivers: One day at a time.” Quarterly Journal of
     Economics 112 (April): 407–41.

Connolly, Marie (2008), “Here Comes the Rain Again: Weather and the Intertemporal
     Substitution of Leisure” Journal of Labor Economics January 2008 26(1). 73-100.

Dohmen, Thomas, Armin Falk, david Huffman and Uwe Sunde (2006) “Seemingly
    Irrelevant Events Affect Economic Perceptions and Expectations: the FIFA World
    Cup 2006 as a Natural Experiment.” IZA Discussion Paper 2275.

Edmans, Alex., Garcia, D., and O. Norli, (2007) “Sports sentiment and stock returns,”
     Journal of Finance 62(4), 1967-1998.

Gonzalez-Chapla (2007) “On the Price of Recreation Goods as a Determinant of Male
     Labor Supply” Journal of Labor Economics October 2007 25(4) 795-824.

Hamermesh, Daniel, C. Myers and M. Pocock (2008) “Cues for Timing and
     Coordination: Latitude, Letterman and Longitude,” Journal of Labor Economics,
     April 2008.

Markovits, Andrei S. and Steven L. Hellerman (2001) “Offside: Soccer and American
     Exceptionalism” Princeton University Press.

New York Times (2006) “Cup Ratings Are Up, but Fans Deserve Better” by Richard
     Sandomil, July 11, 2006.
20 Figure 1. Differences in Hours Worked Last Week and Usual Hours of Work
21

Figure 2 Predicted Differences in Hours of Work (With Quartic on Wages)
22

Table 1. Schedule of games during the CPS reference week

a) USA 1994 June 17 to July 17
Reference week(s) June 12-18 and July 10-17

Hours Games Played          Number Matches at Hour
11:35 EDT                              1
12:05 EDT                              1
16:05 EDT                              3
16:35 EDT                              3
18:35 EDT*                             3

b) France 1998 June 10-July 12
Reference week(s) June 7-13 and July 12-18

Hours Games Played          Number Matches at Hour
14:30 CEST (UTC+2)                     1
17:30 CEST                             3
21:00 CEST*                            4

c) Korea-Japan 2002 May 31 to June 30
Reference week(s) June 5-12

Hours Games Played          Number Matches at Hour
15:30 AST (UCT+9)                      9
18:00 AST                              5
20:30 AST*                             9

d) Germany 2006 June 9 to July 9
Reference week(s) June 11-17 and July 9-15

Hours Games Played          Number Matches at Hour
15:00 CEST (UCT+2)                     7
18:00 CEST                             7
21:00 CEST                             7
Source: www.fifa.org
You can also read


