MI COVID response Data and modeling update - September 7, 2021 - State of ...
←
→
Page content transcription
If your browser does not render page correctly, please read the page content below

MI COVID response
Data and modeling update
September 7, 2021
Executive Summary – All Indicators Show Increases
Due to the Labor Day Holiday, most metrics are through Friday, Sep 3
Michigan remains at High Transmission
Percent Positivity (9.2%) is increasing for 2.5 months (up from 9.1% last week), and Case Rate (169.2 cases/million) have increased for 2.5
months (up from 148.7 last week)
 Michigan has 39th lowest number of cases (35th last week), and 14th lowest case rate (9th last week) in the last 7 days
 99% of positive tests available for sequencing in Michigan were Delta variant in the last 4 weeks
Percent of inpatient beds occupied by individuals with COVID (5.8%) has increased for five weeks (up from 5.7% last week).
 Michigan has 10th lowest inpatient bed utilization (8th last week), and 9th lowest adult ICU bed utilization (8th last week)
Deaths (1.7 deaths/million) are increasing for five weeks (1.3 deaths/million last week), and there were 118 COVID deaths between Aug 21-27.
 Michigan has the 29th lowest number of deaths (T31st last week), and T7th lowest death rate (T12th last week) in the last 7 days
7-day average state testing rate is steady at 2,615.4 tests/million/day. Daily diagnostic tests (PCR) is 26.1K per day.
10.25 million COVID-19 vaccine doses administered, 50.8% of population is fully vaccinated (5.0 million people)

Science Round Up
A few states that have experienced the largest per capita surge from Delta are starting to decline
Modeling projects continued increases in cases, hospitalizations, and deaths for Michigan
Number of reported K-12 school outbreaks increased since last week (11 to 41)
Without appropriate mitigations, large outbreaks occur in schools leading to more children being infected and experiencing severe illness
50.8% of the total population is fully vaccinated yet only account for ~25% of cases, hospitalizations, and deaths
Settings where mitigations have been consistently applied have seen a reduction in overall infection burden 2
Global and National Comparisons: US cases increasing
 What we see today (data through 9/5):
 • Globally, 220,863,303 cases and 4,570,927 deaths*
 • Countries with the highest case count are U.S. (39,955,163), India (33,027,621), and Brazil (20,890,779)*
 • Nearly all US jurisdictions have high community transmission†
 • States with the highest seroprevalence (national seroprevalence: 21.6% through end of June)†:
 State Est. Seroprevalence 95% CI
 1. Ohio 37.3% 34.3% - 40.4%
 2. Illinois 35.4% 31.8% - 39.1%
 3. Wisconsin 32.9% 29.4% - 36.8%
 4. Texas 32.2% 28.1% - 36.0%

 11. Michigan 27.8% 25.0% - 31.2%
 – Other notable states: AL (29.2%), AR (22.9%), GA (14.4%), FL (24.1%), LA (12.7%), MO (26.5%), MS (31.5%), TN (29.2%)

 Source: * Johns Hopkins COVID-19 Dashboard; † CDC COVID Data Tracker
 Public Health Other Science
National Comparison Spread Severity
 Response Indicators Round-up 3
Key Messages: COVID-19 is Spreading Faster with Delta Statewide positivity has increased to 9.2% (last week: 9.1%) • One week percent change is up 5% (vs. up 6% last week) • Increasing for two and half months (Jun 26 low of 1.2%) • Positivity is increasing in most MERC regions; and five regions > 10% Case rate (169.2 cases/million) increasing for two and half months (last week: 148.7 cases/million) • One week increase of 9% (vs. 5% increase last week) • Increasing for two months (Jun 26 low of 15.4 cases/million) • Cases per million are increasing in most MERC regions Michigan is at High Transmission level • More than 90% of the counties in Michigan are at high transmission level • CDC recommends all individuals, regardless of vaccination status, should mask indoors • The U.S. is at high transmission level (316.9 cases/100,000 in last 7 days) with 54 states/territories in substantial or high transmission Number of active outbreaks is up 18% from last week One-hundred and six new outbreaks were identified in the past week SNF/LTC reported the most total outbreaks this week, while K-12 schools have seen the highest number of new outbreaks (30) this week Public Health Other Science National Comparison Spread Severity 4 Response Indicators Round-up
Confirmed and probable case indicators Risk levels
 Table Date: 9/3/2021 (7 days from date table was produced: 8/27/2021) Low A B C D E

 Cases Positivity

 Public Health Other Science
National Comparison Spread Severity 5
 5
 Response Indicators Round-up
Positivity
 Regional Time Trends
 • Positivity for two regions on the postage
 stamp showed potential plateau trends:
 • Kalamazoo Positivity Trend Kalamazoo
 • Traverse Positivity Trend Region
 • These same two regions have elevated
 incidence plateau
 • Both regions have seen stairstep trends with
 plateaus followed by further increases in All charts
 positivity Traverse represent
 • Positivity in both regions are above the City Region data from
 substantial threshold (Kalamazoo is high) 06/02/21 –
 09/02/21
 • At this point, cumulative data do not suggest
 that the delta surge in Michigan is subsiding

 State of
 Michigan

 Source: MI Start Map; MDOC excluded

 Public Health Other Science
National Comparison Spread Severity
 Response Indicators Round-up 6
Michigan lag adjusted COVID+ cases by onset date
 New confirmed cases by onset actual and adjusted as of September 3, 2021 (-2 days)

 8K

 7K
 ADJUSTED
 NEW_CASES
 6K

 New cases
 5K statewide are on
 track for the
 4K biggest increase in
 a while
 3K

 2K

 1K

 0K
 Apr 1, 20 Jun 1, 20 Aug 1, 20 Oct 1, 20 Dec 1, 20 Feb 1, 21 Apr 1, 21 Jun 1, 21 Aug 1, 21

 7
Overview of metrics for individuals < 18

 Note: Data as of 9/3; case data 8/27, hospitalization data 9/3. Hospitalization data is for pediatric patients (
Michigan at High Transmission Level
 and continuing to increase
 Dashboard | CDC | MI Start Map for most recent data by
 reporting date

 Source: MI Start Map; data through 9/3/2021

 Public Health Other Science
National Comparison Spread Severity 9
 Response Indicators Round-up
Case Rate Trends are Increasing for All Age Groups
 Daily new confirmed and probable cases per million by age group (7-day rolling average)
 0-9 30-39 60-69
 1000 10-19 40-49 70-79 250
 20-29 50-59 80+

 200
 750

 150

 500

 100

 250
 50

 0 0
 3/1 5/1 7/1 9/1 11/1 1/1 3/1 5/1 7/1 9/1 6/26 7/10 7/24 8/7 8/21

 • Case rate trends for all age groups are increasing
 • Case rates for all age groups are between 95 and 205 cases per million (through 8/16)
 • Case rate trends are highest for 30-39-year-olds followed by 20-29, 40-49, 10-19, and 50-59
 Note: Case information sourced from MDHHS and reflects date of onset of symptoms
 Source: MDHHS – Michigan Disease Surveillance System

 Public Health Other Science
National Comparison Spread Severity 10
 10
 Response Indicators Round-up
Number of Cases and CaseRates are Increasing for Most Age Groups
 Daily new confirmed and probable cases per million by age group (7-day rolling average)

 Age Average† Average† One Week • Largest one-week growth among those
 Group daily cases Daily Case % Change (Δ #) under 10 years of age
 Rate
 0-9 147.3 127.8 28% (+32)
 • Average daily number of cases (300.0) is
 10-19 210.9 168.0 8% (+15) highest for those aged 20-29
 20-29 300.0 217.5 9% (+24)
 • Avg. daily case rate (229.3 cases/mil) is
 30-39 278.1 229.3 7% (+18) currently highest for 30-39
 40-49 218.4 185.2 5% (+10) • Case rates for all age groups are between
 50-59 224.9 166.5 13% (+27) 100-230 cases per million
 60-69 163.7 128.3 5% (+7) • Case rate trends are increasing for all age
 70-79 97.0 126.5 14% (+12) groups
 80+ 42.1 101.7 1% (+1-5) • Case rates bottomed out on June 26, 2021
 Total¶ 1694.6 169.2 12% (+150)
 † Rolling 7-day average; ¶ Total may not reflect state due to missing age data
 Note: Case information sourced from MDHHS and reflects date of onset of symptoms
 Source: MDHHS – Michigan Disease Surveillance System
 Data through 9/3/2020

 Public Health Other Science
National Comparison Spread Severity 11
 Response Indicators Round-up 11
Racial and Ethnic Case Rates are Increasing
 Daily new confirmed and probable cases per million Daily new confirmed and probable cases per
 (7 day rolling average) by race category million (7 day rolling average) by ethnicity category
 American Indian/Alaska Native Black/African American Hispanic or Latino Not Hispanic or Latino
 200 Asian/Pacific Islander White 200
 Race Case Rate

 American Indian/ 166.0
 150 Alaskan Native 150
 Asian/Pacific Islander 56.9

 Black/African American 93.3
 100 White 131.2 100

 Race Case Rate
 50 50
 Hispanic/Latino 146.3

 Non-Hispanic 126.8
 0 0
 6/26 7/10 7/24 8/7 8/21 6/26 7/10 7/24 8/7 8/21
 Updates since last week:
 • Cases per million are increasing for all races and ethnicities
 • Hispanics, American Indian/Alaskan Native, and Whites have the highest case rates
 • In the past 30 days, 20% (↔) of race data and 25% (↑1%) ethnicity data was either missing or reported as unknown

 Note: Case information sourced from MDHHS and reflects date of death of confirmed and probable cases.
 Source: MDHHS – Michigan Disease Surveillance System

 Public Health Other Science
National Comparison Spread Severity 12
 12
 Response Indicators Round-up
Identified COVID-19 Cases Caused by All Variants of Concern (VOC)
 in US and Michigan
 Variants Circulating in United States, Aug 22 – Variants of Concern in Michigan, Sep 3
 Aug 28 (NOWCAST)

 Note: The low number of
 specimens recently
 submitted for sequencing
 limits the ability to estimate
 the prevalence of variants in
 Michigan

 761 cases in Wayne attributed to Detroit

 Variant MI Reported Cases¶ # of Counties % Specimens in last 4 wks
 B.1.1.7 (alpha) 13,695* 81 0.5%
 B.1.351 (beta) 88 24 0%
 P.1 (gamma) 335 35 0.2%
Data last updated Sep 3, 2021 B.1.617.2 (delta) 1,806 (↑453) 74 (↑1) 99.3%
Source: https://covid.cdc.gov/covid-data-tracker/#variant-proportions and MDSS
 * 534 cases within MDOC; ¶ 37 cases with county not yet determined
 Public Health Other Science
 National Comparison Spread Severity 13
 Response Indicators Round-up
Emerging COVID-19 Variants
 WHO Variant Tracking Update Variant Cases in Michigan*
 • WHO announced the variant B.1.621 (Mu) as a variant of • There are currently 10 cases who have been identified to be
 interest on August 30, 2021 infected with the Mu variant plus 1 additional epi link
 • Mu was first identified in Colombia in January • All but cases acquired the Mu variant within Michigan
 • The Mu variant evolved several potential properties of immune • No cases reported international travel
 escape • 2 (18%) of cases required hospitalization
 • Preliminary data show that Mu has a capacity to reduce the • 2 (18%) of cases were breakthrough infections
 neutralization capacity of convalescent and vaccine sera
 similar to that seen for Beta (B.1.351) variant • 6 (55%) cases reported symptoms

 • WHO also reported that it is monitoring the C.1.2 • There are currently no cases identified with the C.1.2 variant
 • C.1.2 is neither a variant of concern nor a variant of interest
 • C.1.2 was first identified in South Africa in May and was
 added the WHO monitor list on September 1, 2021

* Only variants of concern are routinely reported in this weekly update
Data last updated Sep 6, 2021
Source: MDSS, WHO, outbreak.info

 Public Health Other Science
 National Comparison Spread Severity 14
 Response Indicators Round-up
Number of Outbreaks Reported has Increased
 Number of outbreak investigations by site type, week ending Sep 2
 Visibility1 Easier to identify outbreak
 Site type Outbreaks by ongoing/new classification, # Harder to identify outbreak
 Ongoing New Total
 SNF/L T C/ O T HE R A SSIS T E D LIV ING 63 19 82 Total number of active
 MA NUF A CT UR IN G , CONS T R U CT IO N 39 12 51 outbreaks is up 18% from
 CHIL DCA R E/Y O U T H PRO G RA M 33 10 43 previous week, with 106 new
 K- 12 SCHO O L 11 30 41 outbreaks identified (26 more
 *RETA IL 18 13 31 than last week)
 *SOCIA L GA THER IN G 22 3 25
 *RES TA U RA N T S A ND BA RS 12 3 15
 K-12 schools reported the
 OTHER 9 2 11
 greatest number of new
 HEA L T HCA R E 9 110
 outbreaks (30) this week,
 *CO MMU N IT Y EXPO S UR E - OUT DO O R 7 2 9
 3 4 7 followed by SNF/LTC (19),
 OFF ICE SET T IN G
 *REL I G I O U S SERV I CE S 6
 6 0
 retail (13), manufacturing/
 CORRE C T I O N S 2 3 5 construction (12), and youth/
 *PER S O NA L SERV IC E S 4 1 5 childcare (10), and ten other
 COLL EG E/ U N IV E R S IT Y 2 2 4 settings with at least 1 new
 A GRICU L T U RA L / F O O D PRO CE S S I NG 4 0 4 outbreak in the last week.
 *SHEL T E RS 4 0 4
 *CO MMU N IT Y EXPO S UR E - INDO O R 2 1 3

 TO TA L 250 106 356

 1. Based on a setting’s level of control and the extent of time patrons/residents spend in the particular setting, different settings have differing levels of ability to ascertain whether a case derived from that setting

 NOTE: Many factors, including the lack of ability to conduct effective contact tracing in certain settings, may result in significant underreporting of outbreaks. This chart does not provide a complete picture of
 outbreaks in Michigan and the absence of identified outbreaks in a particular setting in no way provides evidence that, in fact, that setting is not having outbreaks.

 Source: LHD Weekly Sitreps

 Public Health Other Science
National Comparison Spread Severity 15
 15
 Response Indicators Round-up
Key Messages: COVID-19 and Healthcare Capacity and COVID Severity Hospitalizations and ICU utilization are increasing 3.1% of ED visits are for COVID-like illness (CLI) (up from 2.9% last week) Hospital admissions are increasing for most age groups this week Hospitalizations up 5% since last week (vs. 10% increase week prior) Several regions (Region 1, 3, 5, 6, 8) experienced an increasing in hospitalization trends this week Hospitalization for COVID-19 is highest in Regions 1, 3, and 6 Fastest growth is in Regions 1 and 6 Volume of COVID-19 patients in intensive care has increased 9% since last week (vs. 28% increase last week) Death rate is 1.7 daily deaths per million people Death rate has increased five weeks 293% increase since Jul 22 low 30-day proportion of deaths among those under 60 years of age is steady from the prior week Public Health Other Science National Comparison Spread Severity 16 Response Indicators Round-up
Michigan Trends in Emergency Department (ED) Visits for COVID-19-Like
 Illness (CLI)

 3.1%

 • Trends for ED visits have increased to 3.1% since last week (up from 2.9% week prior)
 • Trends vary by age groups with all age groups seeing an increase
 • Over past week, those 50-64 years saw highest number of avg. daily ED CLI visits (4.0), but those between 25 and 74 all above state average
Source: https://covid.cdc.gov/covid-data-tracker/#ed-visits
 Public Health Other Science
National Comparison Spread Severity
 Response Indicators Round-up 17
Average Hospital Admissions Are Increase for all Age Groups

 30

 20

 10

 0
 7/25 8/1 8/8 8/15 8/22 8/29
 Peds 0 - 11 12 - 17 18 - 19 20 - 29 30 - 39 40 - 49 50 - 59 60 - 69 70 - 79 80+ Age
 Unkn
 • Trends for daily average hospital admissions have increased 2% since last week (vs. 16% increase prior week)
 • Most age groups experienced a one week increase in daily hospital admissions with largest increases for those under 30
 • Over the past week, those 60-69 years have seen the highest number of avg. daily hospital admissions (29 admissions)
 Source: CHECC & EM Resource

 Public Health Other Science
National Comparison Spread Severity 18
 Response Indicators Round-up 18
Statewide Hospitalization Trends: Total COVID+ Census
 Hospitalization Trends 3/1/2021 – 9/6/2021 The COVID+ census in hospitals has
 Confirmed Positive & Persons Under Investigation (PUI) increased by only 5% from the last
 week (previous week was up 10%).

 Confirmed Positive Growth in overall hospitalizations has
 slowed over the past 2 weeks.

 Hospitalized COVID Positive Long Term
 Trend (beginning March 2020)

 PUI

 19
Statewide Hospitalization Trends: Regional COVID+ Census
 There are notable regional variations in COVID+
 Hospitalization Trends 3/1/2021 – 9/6/2021 hospitalizations trends this week.
 Confirmed Positive by Region
 Region 6 has the fastest growth followed by
 Region 1 regions 1 and 8. Regions 2S, 2N, and 7 all show
 Region 2N
 Region 2S
 slight decreases.
 Region 3
 Region 5
 Region 6
 All regions except Region 8 have above 100/M
 Region 7 population COVID+ hospitalized.
 Region 8

 Region COVID+ Hospitalizations COVID+
 (% Δ from last week) Hospitalizations /
 MM
 Region 1 135 (13%) 125/M
 Region 2N 255 (-6%) 115/M
 Region 2S 251 (-1%) 113/M
 Region 3 167 (4%) 147/M
 Region 5 104 (7%) 109/M
 Region 6 216 (23%) 147/M
 Region 7 56 (-2%) 112/M
 Region 8 22 (10%) 71/M

 20
Statewide Hospitalization Trends: ICU COVID+ Census
 Overall, the census of COVID+ patients in ICUs has
 Hospitalization Trends 3/1/2021 – 9/6/2021 increased by 9% from last week.
 Confirmed Positive in ICUs
 Regions 1 and 6 have the largest growth in ICU
 hospitalizations from last week. Region 3 had a
 notable decrease.

 Regions 1 and 3 have adult ICU occupancy over 85%
 and >20% of ICU beds occupied by COVID+ patients.
 Region Adult COVID+ in Adult ICU % of Adult ICU
 ICU (% Δ from Occupancy beds COVID+
 last week)
 Region 1 39 (34%) 91% 22%
 Region 2N 68 (10%) 73% 12%
 Region 2S 75 (1%) 82% 11%
 Confirmed Region 3 38 (-12%) 88% 11%
 Positive in ICU Region 5 27 (0%) 71% 14%
 Region 6 58 (38%) 80% 24%
 Region 7 27 (-4%) 80% 18%
 Region 8 10 (11%) 66% 16%

 21
Average and total new deaths, by age group
 Daily confirmed and probable deaths per million by Total confirmed and probable deaths by age group
 age group (7 day rolling average) (past 30 days, ending 8/27/2021)

 20
 0-19 40-49 70-79 • 25% of deaths below age sixty
 20-29 50-59 80+ 117
 30-39 60-69 Total
 101
 15

 61
 10
 46

 5 28

 9 11
 0
 0
 6/6 6/20 7/4 7/18 8/1 8/15 8/29 0-19 20-29 30-39 40-49 50-59 60-69 70-79 80+

 • Overall trends for daily average deaths are increasing since last week
 • Through 8/27, the 7-day avg. death rate is more than 6.0 daily deaths per million people for those over the age of 70
 Note: Death information sourced from MDHHS and reflects date of death of confirmed and probable cases.
 Source: MDHHS – Michigan Disease Surveillance System

 Public Health Other Science
National Comparison Spread Severity 22
 Response Indicators Round-up 22
30-day rolling average daily deaths per million people by race and
 ethnicity
 Average daily deaths per million people by race Average daily deaths per million people by
 ethnicity
 6 American Indian/Alaska Native Black/African American 6 Hispanic or Latino Not Hispanic or Latino
 Asian/Pacific Islander White

 4 4

 2 2

 0 0
 7/1 7/15 7/29 8/12 8/26 7/1 7/15 7/29 8/12 8/26

 • Additional reviews of vital records death data were performed the weeks of 7/6 and 8/9 to search for race and ethnicity
 • This review has resulted in an adjustment of deaths for American Indian and Alaskan Natives from previous weeks
 • Currently, American Indian/Alaskan Natives have the highest death rate

 Note: Death information sourced from MDHHS and reflects date of death of confirmed and probable cases.
 Source: MDHHS – Michigan Disease Surveillance System

 Public Health Other Science
National Comparison Spread Severity 23
 Response Indicators Round-up
• `

 COVID-19 Vaccination
 Administration (doses administered)
 • 5,357 first doses administered each day (7-day rolling average*)
 • Most administered frequently by pharmacies, local health departments, and hospitals
 Coverage (people vaccinated)
 5.07 million people in the state are fully vaccinated
 82.9% of people aged 65 and older have completed the series (+0.2%)
 55.5% of total population initiated (+0.3%)
 • 66.7% (+0.3) of aged 18+ have had first dose of vaccine; 87.3% (+0.2) of aged 65+ have had first dose
 • 5,070,925 people in Michigan have completed vaccination series (5,040,341 and 4,992,872 in last 2 weeks)
 • Initiation highest among Asian, Native Hawaiian or Pacific Islander and American Indian/Alaskan Native
 individuals (MI COVID Vaccine Dashboard 9/2/21)
 • 35,922 Additional Doses for Immunocompromised Individuals administered since 8/31
 • Less than 1% of Vaccinated Individuals Later Tested Positive for COVID-19 (Number of cases who are fully
 vaccinated (n= 20,987)

*https://covid.cdc.gov/covid-data-tracker/#vaccination-trends_vacctrends-onedose-daily
 Public Health Other Science
National Comparison Spread Severity
 Response Indicators Round-up 24
• `

 Doses administered in Michigan remains steady as national
 administration is slightly increasing (data through 9/6/2021)

 13,032,980 doses delivered to providers and 10,249,429
 doses administered*

 MI 7-day rolling average ending September 2nd
 • 37,499 first doses administered †
 • 12,686 total doses/day on average †
 • 5,357 first doses/day on average †

 Total doses (between 8/29-9/4) were most frequently
 administered¶ by:
 - Pharmacies (31K)
 - LHD (3.5K) and hospitals (3.2K)
 - Family practice (2.2K), FQHCs (1.8K), Health Center
 (777) and Pediatric (690)

 Source: *CDC COVID Data Tracker > Vaccinations in the US, † CDC COVID Data Tracker > Vaccination Trends; ¶ MCIR COVID-19 Vaccine Dashboard

 Public Health Other Science
National Comparison Spread Severity
 Response Indicators Round-up 25
Over 5 Million Michiganders fully vaccinated and 50.8% of total population fully
 vaccinated

 5.07 million people in the state are fully Vaccination Coverage in Michigan as of 9/5/21
 vaccinated*
 82.9% of people aged 65 and older have Age Group % At Least % Fully Number Fully
 completed the series (+0.2%)*
 One Dose Vaccinated Vaccinated
 55.5% of total population initiated (+0.3%)*
 Total Population 55.5% 50.8% 5,070,925
 35,922 additional doses¶
 Race/Ethnicity¶ for those 12 years and older: ≥ 12 years 64.5% 59.0% 5,070,818
 • Initiation coverage highest among those of ≥ 18 years 66.7% 61.3% 4,808,320
 Non-Hispanic (NH) Asian, Native Hawaiian
 or Pacific Islander Race (54.3%), then NH ≥ 65 years 87.3% 82.9% 1,463,203
 American Indian (51.7%), NH White
 (47.5%), NH Black or African American
 Races (36.9%).
 • Initiation is at 49.0% for those of Hispanic
 ethnicity
 • Completion follows the same pattern

 • 19.9% data missing or unknown

 Source: *CDC COVID Data Tracker > Vaccinations in the US, ¶ MCIR COVID-19 Vaccine Dashboard

 Public Health Other Science
National Comparison Spread Severity
 Response Indicators Round-up 26
`

 Potential COVID-19 Vaccination Breakthrough Cases
 Michigan part of CDC’s nationwide investigation (COVID-19 Breakthrough Case Investigations and Reporting | CDC)

 Michigan Data (1/1/21 through 8/31/21):
 • 20,987 cases met criteria based on a positive test 14 or more days after being fully vaccinated
 • Less than 1% of people who were fully vaccinated met this case definition
 • Includes 302 deaths (266 in persons ages 65 years or older)
 • 945 cases were hospitalized

 • Vaccine breakthrough cases are expected. COVID-19 vaccines are effective and are a critical tool to bring the pandemic under control.
 However, no vaccines are 100% effective at preventing illness. Some fully vaccinated people will get sick, and some will even be
 hospitalized or die from COVID-19. However, there is evidence that vaccination may make illness less severe for those who are
 vaccinated and still get sick. The risk of infection, hospitalization, and death are all much lower in vaccinated compared to unvaccinated
 people.
 • More than 173 million people in the United States have been fully vaccinated as of August 30, 2021. Like with other vaccines, vaccine
 breakthrough cases will occur, even though the vaccines are working as expected. Asymptomatic infections among vaccinated people will
 also occur.
 • Current data suggest that COVID-19 vaccines authorized for use in the United States offer protection against most SARS-CoV-2 variants
 circulating in the United States. However, variants will cause some vaccine breakthrough cases.

 Public Health Other Science
National Comparison Spread Severity
 Response Indicators Round-up 27
Science Round Up
 Deeper look at trends: What happening in other states and comparison to past surges
 • A few states that have experienced the largest per capita surge are starting to decline
 • The Delta surge in many states, including Michigan, continue to see increases
 • The reproduction number ( ) in Michigan may be slowing, although burden of pandemic continues to be high in Michigan
 • CDC models project continued increases in cases, hospitalizations, and deaths for Michigan
 • As the public health pandemic response has improved in Michigan, the burden has also diminished
 What do we know about schools
 • Delta variant can be highly transmissible in schools, and failure to comply with mitigation measures consistently increases likelihood of potential outbreaks
 • Number of reported outbreaks increased since last week (11 to 41), including increases in High Schools (7 to 14), Middle/Jr High (0 to 6), Pre K-Elementary (3
 to 19), and Administrative (1 to 2).
 Update on breakthrough cases and boosters
 • 50.8% of the population is fully vaccinated yet only account for ~25% of cases, hospitalizations, and deaths
 • Without appropriate mitigations, we see large outbreaks in schools and children experiencing severe COVID-19 illness
 Importance of Continue Mitigation
 • Reduction of the severity of infections (individuals) and magnitude of people infected
 • Settings where mitigations have been consistently applied have seen a reduction in overall infection burden

 Public Health Other Science
National Comparison Spread Severity
 Response Indicators Round-up 28
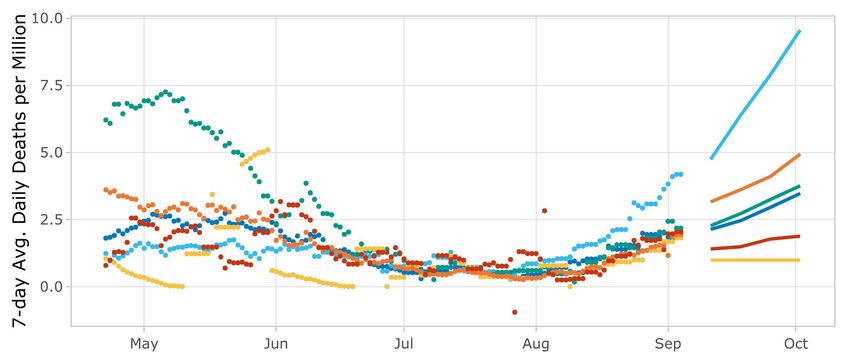
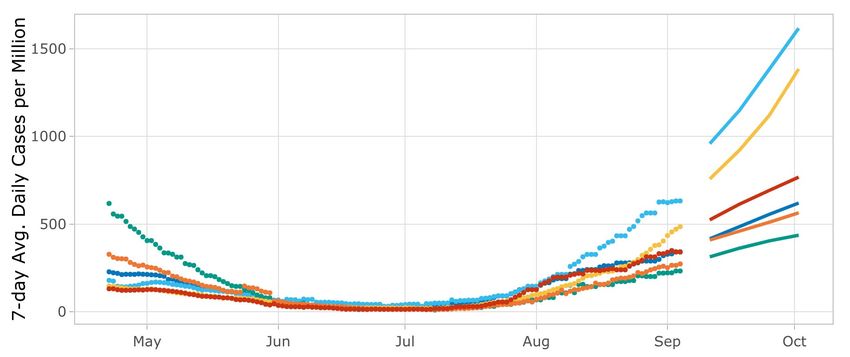
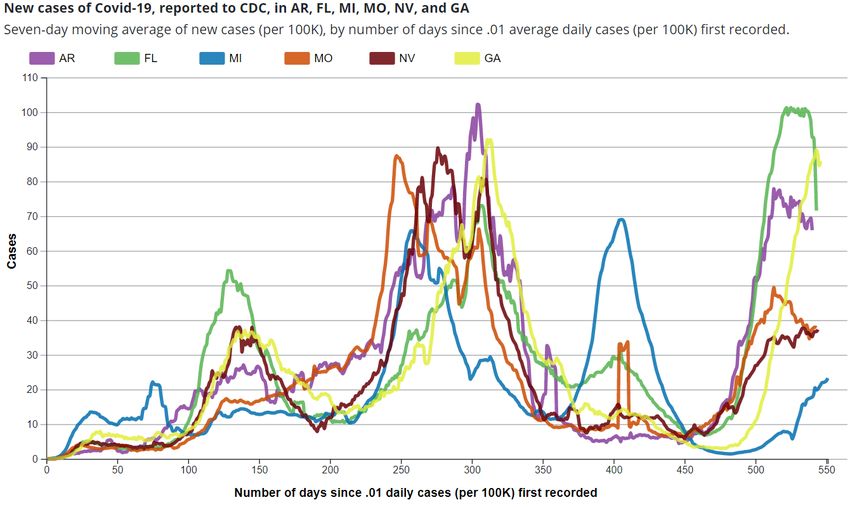
Deeper look at trends:
 What happening in other
 states and comparison
 to past surges

 Public Health Other Science
National Comparison Spread Severity
 Response Indicators Round-up
COVID-19 Case Rates: States with High Delta Comparison

 • Average daily incidence per
 100,000 cases in Michigan is
 currently lower than other
 states experiencing a surge in
 delta cases
 • Several states impacted by
 delta are beginning to see a
 decline in case rate
 • Including LA and FL

 Source: CDC COVID Data Tracker – State Trend Comparison

 Public Health Other Science
National Comparison Spread Severity 30
 Response Indicators Round-up 30
IN

Ridge regression Illinois
 Indiana
 Ohio
 Pennsylvania
 OH

model projects Michigan Wisconsin

continued increases WI
 IL
 PA

for Michigan and
 MI

neighboring states IN
• Cases and deaths are projected to continue
 increasing across the Midwest
• Uncertainty range includes potential for
 sustained or slowed growth (not shown) PA
 MI
 IL
• Line is the ridge regression model projection, and
 the shaded region represents the 95% (not WI
 shown for ease of viewing) confidence region OH
 (2.5% and 97.5% quantiles).
• Projections are based on previous data on cases,
 hospitalizations, and deaths, as well as data on
 mobility and vaccinations.
• Cases are plotted by report date. Sources: Data from MDHHS/JHU,
• For full projections, see dataepi.org UM Ridge Regression Model
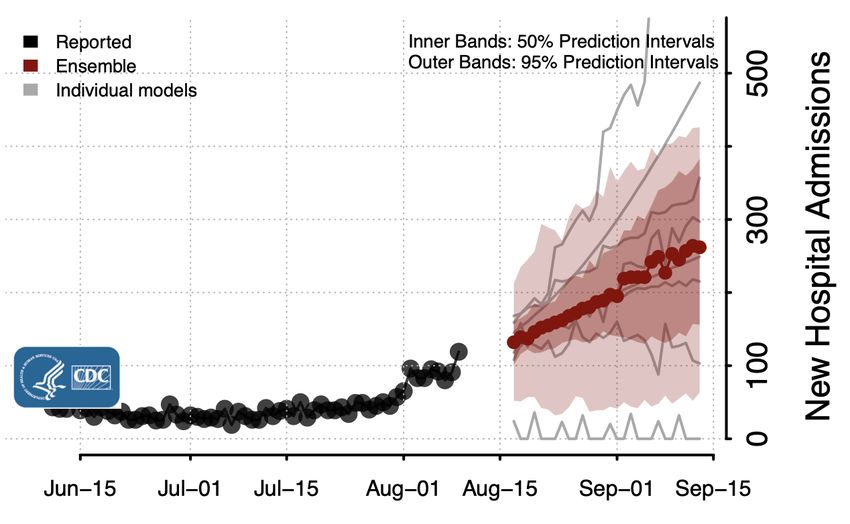
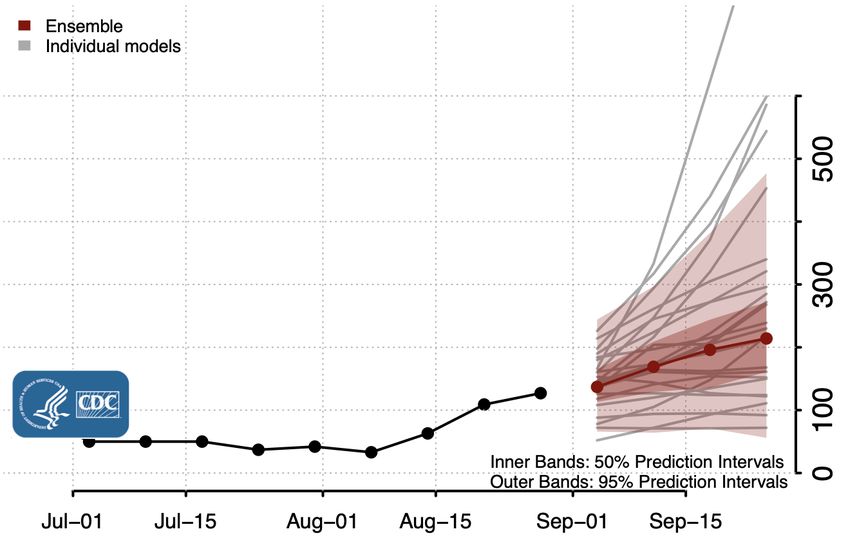
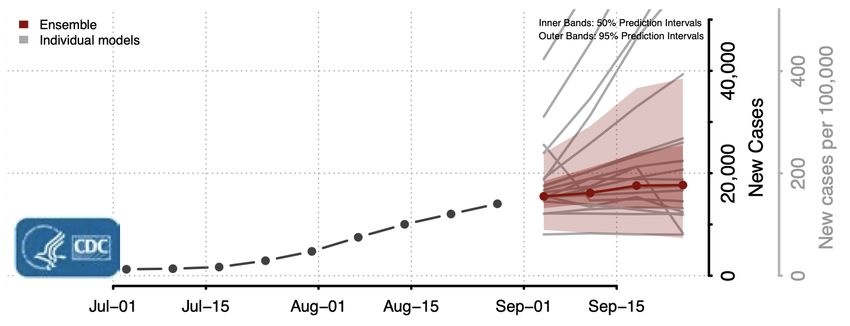
CDC models project continued
increases in hospitalizations, As of 30-Aug-2021

cases, and deaths for Michigan
Uncertainty ranges from flat to increasing—suggests slowing
but still increasing

As of 16-Aug-2021

 As of 30-Aug-2021

 Data Sources: CDC mathematical model
 forecasting, CovidComplete Data Center model
 forecast evaluations. Individual models shown as
 grey lines, ensemble shown in red
Although the winter
 and spring surges
 had similar peak
 cases and
 hospitalizations, the
 spring surge had
 fewer excess deaths
 above expected
 • By the spring surge,
 early vaccination efforts
 had reached the most Observed deaths
 Average expected
 vulnerable age groups deaths

Sources: CDC, MDHHS
What do we know about
 COVID impact on schools

 Public Health Other Science
National Comparison Spread Severity
 Response Indicators Round-up
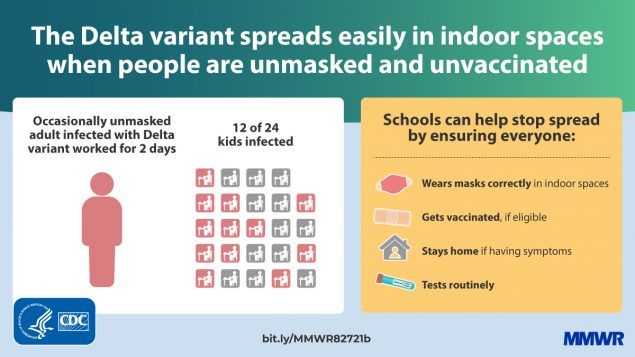
Outbreak Associated with SARS-CoV-2 B.1.617.2 (Delta)
 Variant in an Elementary School

 • 22 of the 24 students were ineligible for vaccine due to age; 12 kids infected
 • Students in the first two rows were more likely be infected
 • In addition to vaccination, consistent and correctly adhering to multiple nonpharmaceutical prevention strategies, including masking, are important to ensure safe school
 instruction
 Source: Lam-Hine (2021) Outbreak Associated with SARS-CoV-2 B.1.617.2 (Delta) Variant in an Elementary School — Marin County, California, May–June 2021
 Public Health Other Science
National Comparison Spread Severity
 Response Indicators Round-up
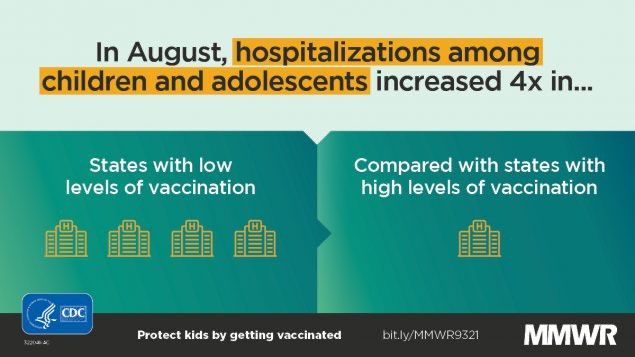
August hospitalizations increased 4x in states with low vaccination levels
 compared to those with high vaccination levels
 • Severe COVID-19 illness can occur in children
 and adolescents
 • Between August 14 – August 27, 2021,
 COVID-19 related ED visits in the states with
 the lowest vaccination coverage were 3.4
 times that in the states with the highest
 vaccination coverage
 • Between August 14 – August 27, 2021,
 COVID-19 related hospital admissions in the
 states with the lowest vaccination coverage
 were 3.7 times that in the states with the
 highest vaccination coverage
 • Between August 2020 and August 2021, the
 proportion of COVID-19 patient who were
 children or adolescents ranged from 10% to
 25%*
 • Broad, community-wide vaccination of all
 eligible persons is critical to protect
 pediatric populations from SARS-CoV-2 and
 severe COVID-19 illness

 * Select hospital included for hospital COVID-19 surveillance
 Source: MMWR, 2021

 Public Health Other Science
National Comparison Spread Severity
 Response Indicators Round-up
K-12 school outbreaks, recent and ongoing, week ending Sep 2
 Number of reported outbreaks increased since last week (11 to 41), including increases in High Schools (7 to 14), Middle/Jr High (0 to 6), Pre
 K-Elementary (3 to 19), and Administrative (1 to 2).
 Number of Range of cases
 Region Number of reported cases, # # Ongoing - Excluding New # New outbreaks per outbreak
 Region 1 31 45 14 2-14
 Region 2n 2 9 4 2-4
 Region 2s - 11 3 2-6
 Region 3 6 65 9 2-23
 Region 5 6 5 4 2-4
 Region 6 0 14 4 2-6
 Region 7 0 0 0 0-0
 Region 8 4 5 3 2-5
 Total 49 154 41 2-23

 Number of Range of cases
 Grade level Number of reported cases, # # Ongoing - Excluding New # New outbreaks per outbreak
 Pre-school - elem. 10 93 19 2-23
 Jr. high/middle school 0 31 6 2-10
 High school 37 25 14 2-14
 Administrative 52 2 2-5
 Total 52 151 41 2-23
 Many factors, including the lack of ability to conduct effective contact tracing in certain settings, may result in significant underreporting of outbreaks. This chart does not provide a complete picture
 of outbreaks in Michigan and the absence of identified outbreaks in a particular setting in no way provides evidence that, in fact, that setting is not having outbreaks.
 Source: LHD Weekly Sitreps

 Public Health Other Science
National Comparison Spread Severity 37
 Response Indicators Round-up
Update on breakthrough
 cases

 Public Health Other Science
National Comparison Spread Severity
 Response Indicators Round-up
Cumulative COVID-19 Cases by Vaccination Status, Michigan, Jan 15 – Aug 31
 Fully Vaccinated People (4,720,133)
 Cases Hospitalization Deaths
 Percent of Cases In People Not Percent of Hospitalizations In People Percent of Deaths In People Not
 Fully Vaccinated Not Fully Vaccinated Fully Vaccinated
 (426,978 / 447,965) (12,160 / 13,105) (4,911 / 5,213)
 95.3% 92.8% 94.2%
 426,978 12,160 4,911
 Total Cases Not Fully Vaccinated Total Hospitalized Not Fully Vaccinated Total Deaths Not Fully Vaccinated

 Total Breakthrough Cases Total Breakthrough Hospitalizations Total Breakthrough Deaths
 20,987 945 302
 0.445% 0.020% 0.006%
 Percent of Fully Vaccinated People who Percent of Fully Vaccinated People Who Were Percent of Fully Vaccinated People Who Died of
 Developed COVID-19 (20,987 / 4,720,133) Hospitalized for COVID-19 (945 / 4,720,133) COVID-19 (302 / 4,720,133)

 4.7% 7.2% 5.8%
 Percent of Cases Who Were Fully Vaccinated Percent of Hospitalizations Who Were Fully Percent of Deaths Who Were Fully Vaccinated
 (20,987 / 447,965) Vaccinated (945 / 13,105) (302 / 5,213)

 Total Cases: 447,965 Total Hospitalizations: 13,105 Total Deaths: 5,213
Michigan Disease Surveillance System may underestimate the frequency of COVID-19 hospitalizations:
- Case investigation and follow-up is more difficult for individuals who get vaccinated (e.g., they are too ill to speak to investigators, don’t answer their phone, or otherwise).
- These hospitalizations include individuals who are hospitalized for issues other than COVID19 (the same as breakthrough COVID-19).
- Individuals who get hospitalization will lag after infection and may occur after case investigation.

 Public Health Other Science
National Comparison Spread Severity
 Response Indicators Round-up 39
Trends in Breakthrough Cases, Hospitalizations, and Deaths
 • 50.8% of the population is fully 30%
 vaccinated yet only account for ~20-
 25% of cases, hospitalizations, and 25% 24%
 deaths 23% 23%

 21%
 • As the fully vaccinated population 20%
 21%
 20%
 has increased, so have the percent 18%
 17%
 of breakthrough incidents; but
 breakthrough burden remains lower 15%
 12% 12%
 11%

 In the last 30 days (Aug 1 – Aug 30), 10%

 10,359 (23%) of 44,623 cases, 269 6%
 (21%) of 1,312 hospitalizations, and 32 5%
 5% 5%

 (18%) of 178 deaths were among fully 2% 2%
 1%
 vaccinated individuals 0% 0% 0% 0% 1% 0%
 1%

 0%
 January February March April May June July Last 30
 days
 Cases Hospitalizations Deaths

Michigan Disease Surveillance System may underestimate the frequency of COVID-19 hospitalizations:
- Case investigation and follow-up is more difficult for individuals who get vaccinated (e.g., they are too ill to speak to investigators, don’t answer their phone, or otherwise).
- These hospitalizations include individuals who are hospitalized for issues other than COVID19 (the same as breakthrough COVID-19).
- Individuals who get hospitalization will lag after infection and may occur after case investigation.

 Public Health Other Science
National Comparison Spread Severity
 Response Indicators Round-up 40
`

 COVID-19 Vaccination Breakthrough Cases and Deaths
 1200 Breakthrough Case Rate vs. Not Fully Vaccinated Breakthrough Death Rate vs. Not Fully Vaccinated Death
 Case Rate Rate
 1000 Case Rate among Fully Vaccinated
 12
 Case Rate among Not Fully Vaccinated
 800 10

 8
 600
 6
 400
 4
 200
 2

 0 0
 1/25 2/25 3/25 4/25 5/25 6/25 7/25 8/25 1/25 2/25 3/25 4/25 5/25 6/25 7/25 8/25

 • Trends over time show that both case and death rates among the Fully Vaccinated are lower than the Not Fully vaccinated rates in Michigan
 • The proportion of breakthrough cases and deaths among all cases and deaths has shown some increases as more people become fully
 vaccinated
 • However, the risk of infection and death remains significantly lower among the fully vaccinated

 Public Health Other Science
National Comparison Spread Severity
 Response Indicators Round-up
Why do we still need
 mitigation measures?

 Public Health Other Science
National Comparison Spread Severity
 Response Indicators Round-up
Why do we still need mitigation measures?
 Factors we normally talk about
 Protect unvaccinated individuals
 • Under twelves
 • Immunocompromised

 Avoid overwhelming the health system
 • Stagger (or space out) infections
 • Don’t let your entire population get infected at once

 Protect vulnerable populations
 • Infections may still be severe in high-risk groups; elderly, underlying
 conditions
 Public Health Other Science
National Comparison Spread Severity
 Response Indicators Round-up
Exposure and Infection “Aren’t we all going to get
 infected anyway?”

 A. How many people tend to think about infection and exposure

 Not exposed= Exposed=
 not infected infected

 B. A more nuanced view (must also take into account individual factors)

 No exposure Minimal exposure Moderate exposure Large exposure Massive exposure
 No disease Asymptomatic Mild Severe Overwhelming
 infection symptoms symptoms symptoms

 Public Health Other Science
National Comparison Spread Severity
 Response Indicators Round-up
Amount of exposure matters We can reduce the severity of infections: the inoculum effect Vaccination, masking and distancing reduce the viral dose Individual Exposed to small Milder disease than someone viral dose exposed to large viral dose Communities Masks, distancing, Less disease spread, fewer vaccination severe cases • Van Damme W, Dahake R, van de Pas R, Vanham G, Assefa Y. COVID-19: Does the infectious inoculum dose-response relationship contribute to understanding heterogeneity in disease severity and transmission dynamics?. Med Hypotheses. 2021;146:110431. doi:10.1016/j.mehy.2020.110431 • María Pilar Guallar, Rosa Meiriño, Carolina Donat-Vargas, Octavio Corral, Nicolás Jouvé, Vicente Soriano. Inoculum at the time of SARS-CoV-2 exposure and risk of disease severity. International Journal of Infectious Diseases. Volume 97. 2020. Pages 290-292. ISSN 1201-9712. https://doi.org/10.1016/j.ijid.2020.06.035. • Fain B, Dobrovolny HM. Initial Inoculum and the Severity of COVID-19: A Mathematical Modeling Study of the Dose-Response of SARS-CoV-2 Infections. Epidemiologia. 2020; 1(1):5-15. https://doi.org/10.3390/epidemiologia1010003 • Gandhi M, Beyrer C, Goosby E. Masks Do More Than Protect Others During COVID-19: Reducing the Inoculum of SARS-CoV-2 to Protect the Wearer. J Gen Intern Med. 2020 Oct;35(10):3063-3066. doi: 10.1007/s11606-020-06067-8. Epub 2020 Jul 31. PMID: 32737790; PMCID: PMC7393808. • Michel Bielecki, Roland Züst, Denise Siegrist, Daniele Meyerhofer, Giovanni Andrea Gerardo Crameri, Zeno Stanga, Andreas Stettbacher, Thomas Werner Buehrer, Jeremy Werner Deuel, Social Distancing Alters the Clinical Course of COVID-19 in Young Adults: A Comparative Cohort Study, Clinical Infectious Diseases, Volume 72, Issue 4, 15 February 2021, Pages 598–603, https://doi.org/10.1093/cid/ciaa889 Public Health Other Science National Comparison Spread Severity Response Indicators Round-up
Outbreak at a Swiss Army Base
 Slow spread was occurring, but
 infections were more likely to be mild

 Company 1 • No symptomatic cases
 154 soldiers
 • 13+ asymptomatic cases
 Social distancing and masking

 Companies 2&3 • 102 symptomatic cases (29%)
 354 soldiers
 • 113+ asymptomatic cases
 No measures before first case

 Michel Bielecki, Roland Züst, Denise Siegrist, Daniele Meyerhofer, Giovanni Andrea Gerardo Crameri, Zeno Stanga, Andreas Stettbacher, Thomas Werner Buehrer, Jeremy Werner
 Deuel, Social Distancing Alters the Clinical Course of COVID-19 in Young Adults: A Comparative Cohort Study, Clinical Infectious Diseases, Volume 72, Issue 4, 15 February 2021, Pages
 598–603, https://doi.org/10.1093/cid/ciaa889
 Public Health Other Science
National Comparison Spread Severity
 Response Indicators Round-up
Clusters of COVID-19 in Madrid
 3rd Cluster
 10 adults meeting in a small
 1st Cluster conference room for 3 hours
 25 women living in a large house No masks, no distancing
 High ceilings, good ventilation, social Uninfected = 0
 distancing Asymptomatic = 0
 Mild = 5
 Uninfected = 3 2nd cluster Severe = 5
 Asymptomatic = 4 12 women living in an
 Mild = 18 apartment
 Severe = 0 Crowded and poor compliance
 with social distancing
 Uninfected = 0
 Asymptomatic = 2
 María Pilar Guallar, Rosa Meiriño, Carolina Donat-Vargas,
 Octavio Corral, Nicolás Jouvé, Vicente Soriano. Inoculum at the
 Mild = 4
 time of SARS-CoV-2 exposure and risk of disease severity. Severe = 6
 International Journal of Infectious Diseases. Volume 97. 2020.
 Pages 290-292. ISSN 1201-9712.
 https://doi.org/10.1016/j.ijid.2020.06.035.

 Public Health Other Science
National Comparison Spread Severity
 Response Indicators Round-up
Type of exposure matters • Different routes of exposure present Reducing aerosolized with distinct disease patterns particles can prevent severe disease • Intranasal and aerosol inoculation • severe respiratory disease • higher viral load • early shedding • Fomite exposure • milder disease • delayed shedding Port, J.R., Yinda, C.K., Owusu, I.O. et al. SARS-CoV-2 disease severity and transmission efficiency is increased for airborne compared to fomite exposure in Syrian hamsters. Nat Commun 12, 4985 (2021). https://doi.org/10.1038/s41467-021-25156-8 Public Health Other Science National Comparison Spread Severity Response Indicators Round-up
It is better to get infected after vaccination instead
 of before

 11,453 HCWs in Israel

 39 breakthrough infections
 (Alpha variant predominant)

 This data needs to be reevaluated in light of Delta Mild 67%
 Asymp. 33%

 5 long
 COVID

 Bergwerk M et al. Covid-19 breakthrough infections in vaccinated health care workers. N Engl J Med 2021 Jul 28; [e-pub]. (https://doi.org/10.1056/NEJMoa2109072)

 Public Health Other Science
National Comparison Spread Severity
 Response Indicators Round-up
Appendix
Backfill of case data by onset date is lagging by two weeks
 • Over the last 8 weeks, it has Michigan
 MichiganCase
 CaseRate
 Rate (7-day rollingaverage)
 (7-day rolling average)
 taken longer for cases to be 150
 150
 reported to local public health
 which means that the graphs
 are not as accurate for recent

 Cases per Million Population
 Cases per Million Population
 days 100
 100
 • More cases are reported to
 local public health with an
 earlier onset date (i.e.,
 between 7 and 14 days prior) 5050
 • The likely explanation is that
 fewer individuals are seeking
 a COVID-19 test earlier in their
 disease progression 00
 6/28
 6/26 7/5
 7/3 7/12
 7/10 7/19
 7/17 7/26
 7/24 8/2
 7/31 8/9
 8/7 8/16
 8/14 8/23
 8/21 8/30
 8/28
 14-Jul 20-Jul 26-Jul 2-Aug 9-Aug 16-Aug 23-Aug 30-Aug
 14-Jul 20-Jul 26-Jul 2-Aug 9-Aug 16-Aug 23-Aug 30-Aug

 Source: MI Start Map; MDOC excluded

 Public Health Other Science
National Comparison Spread Severity
 Response Indicators Round-up 51
Note: The low number of
 Identified COVID-19 Delta Variants by County specimens recently
 submitted for sequencing
 This week (Sep 3, 2021) Last week (Aug 30, 2021) limits the ability to
 estimate the prevalence
 of variants in Michigan

Data last updated Sep 3, 2021
Source: MDSS

 Public Health Other Science
 National Comparison Spread Severity 52
 Response Indicators Round-up
You can also read